Figure 1: GM Fuel Cell Concept Car at Rochester
Polymer Electrolyte Membrane(PEM) fuel cells are very promising high power suppliers. They produce electric power by transforming hydrogen and oxygen into water at a low temperature with a high efficiency. Platinum is the major catalyst in proton-exchange-membrane fuel cells (PEMFC).
The high cost of Pt is the primary problem which is making commercialization difficult for Fuel cells
Solution:
Dr. Li's lab in the Mechanical Engineering department has has come up with a novel solution to solve this problem. Using the electrospinning fabrication technique his group has made one dimensional nanostructures of Pt and Pt-Fe alloys. They have the following advantages:
The seven EM techniques used to characterize the Nanowires are:
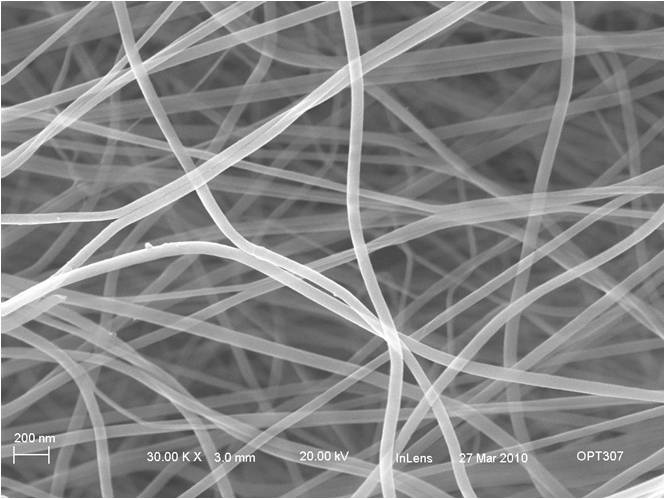
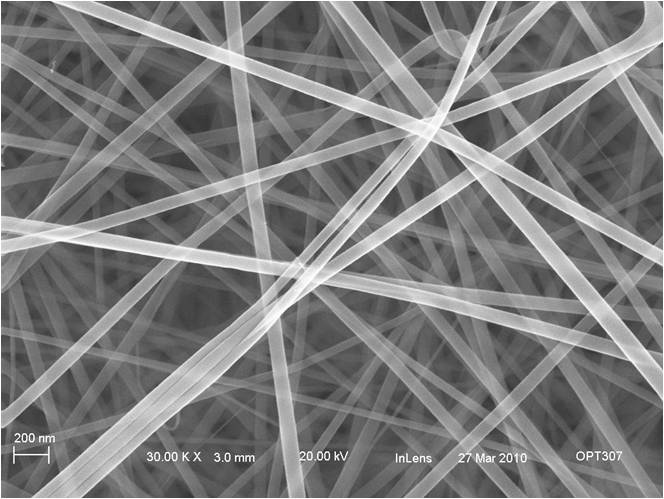
In InLense detector gave the best images. The working distance was kept very short( ~2cm)for InLense imaging. The accelerating voltage used was 20 KV. Both porous and solid wires were characterized. However in the SEM they do not show any difference. Four different types of samples were imaged:
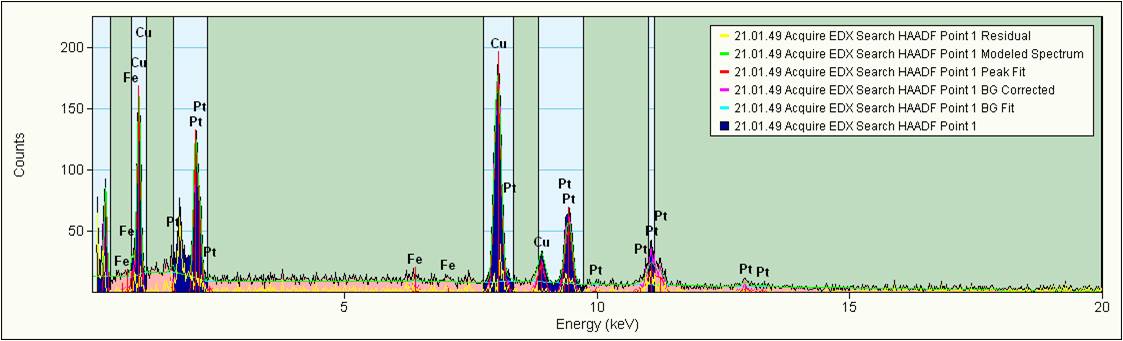
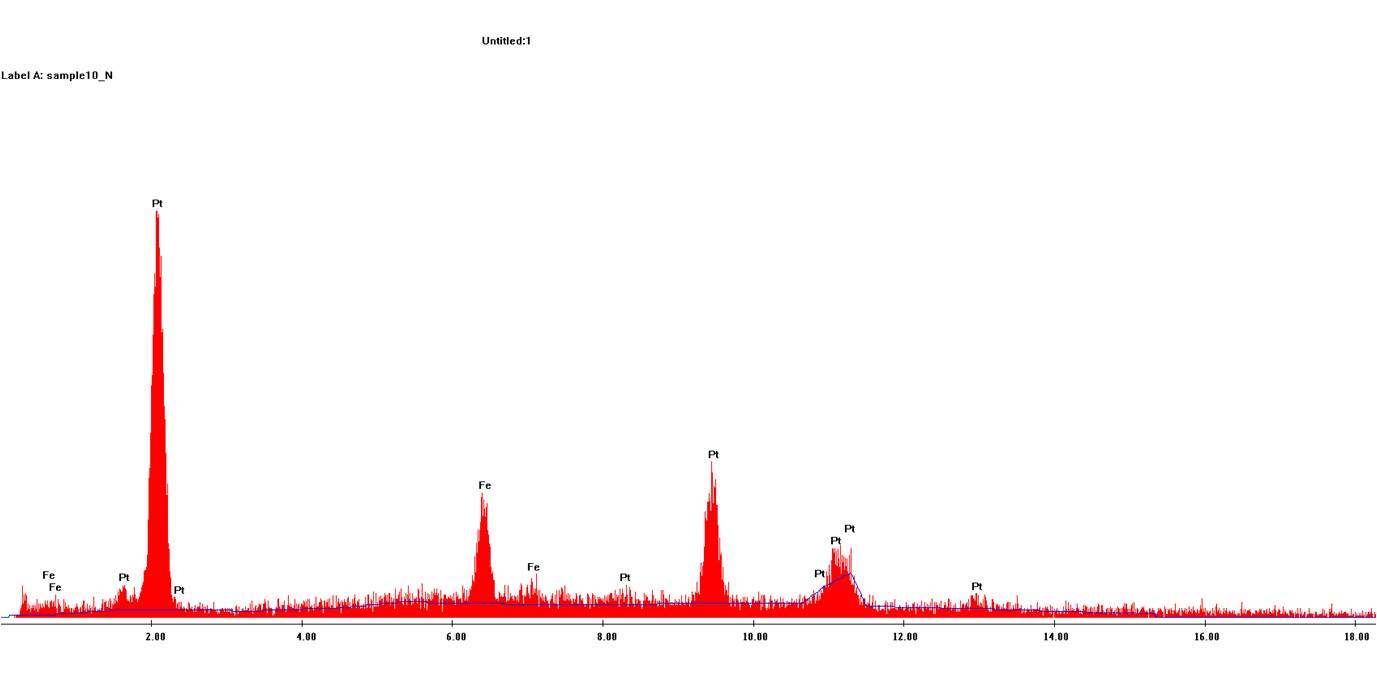
F From the images we can see that the wires appear uniform phase and there are no discernable Fe or Pt regions. Thus Pt and Fe are a single phase and it seems to be a homogeneous alloy.
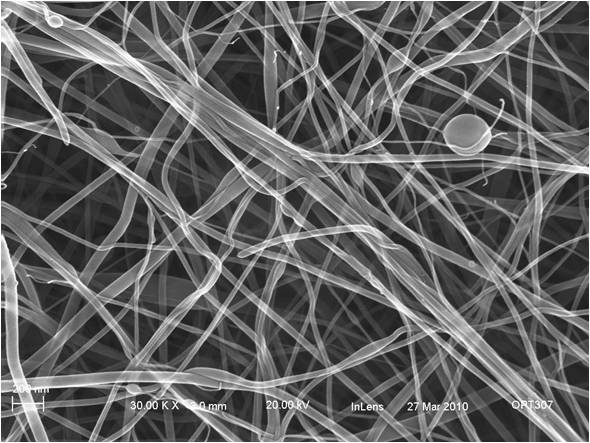
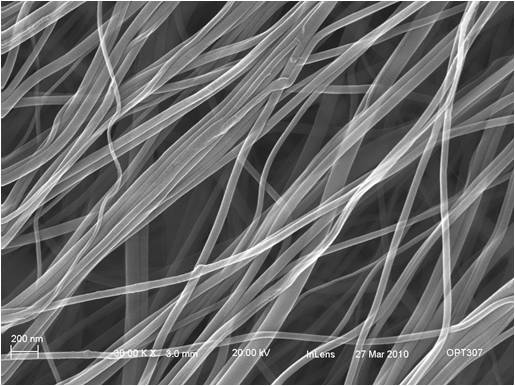
Figure 2: Pt nanowire Figure 3: Pt-Fe nanowire
The length of the NWs is in microns while the diameter is in tens of nm (10-50nm).
Bright field TEM imaging of PtFe3 Nanowires(NW) was done on FEI Tecnai F20 TEM. The sample was dissolved in ethanol and ultrasonicated to disperse it well it the solution. Sonication is important as otherwise all the nanowires agglomerate together and it is very difficult to find a single NW to image.
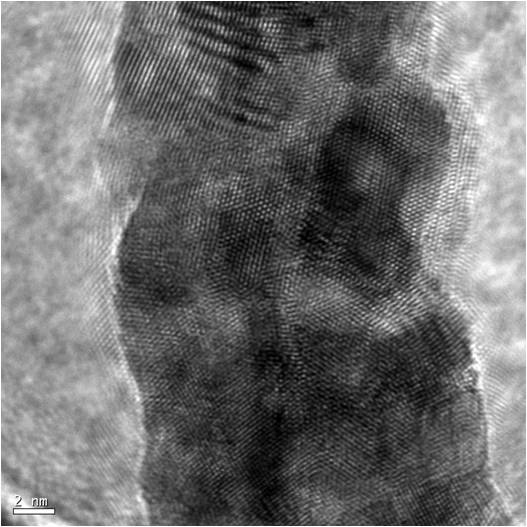
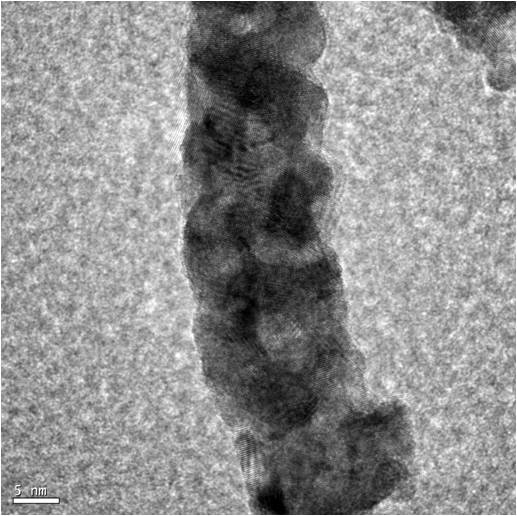
Figure 6: HRTEM of PtFe3 Solid Nanowires; Figure 7: Low magnification TEM image of Ptfe3 Solid nanowire; Dark area are Pt rich area, Lighter area are Fe rich Polycrystalline in nature
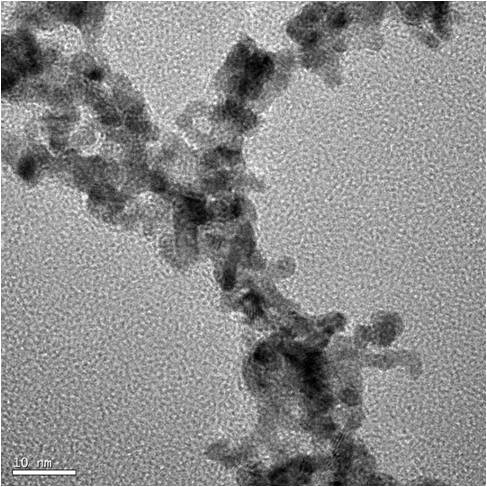
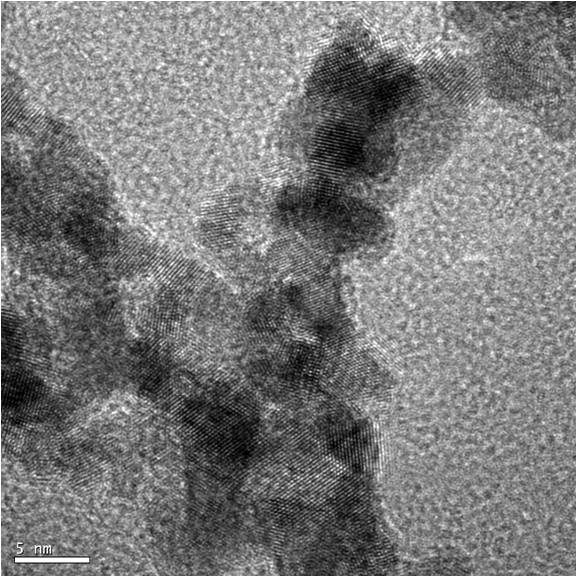
Figure 8: Low magnification TEM image of PtFe3 Porous Nanowires Figure 9 : HRTEM of PtFe3 nanowires; Dark areas are Pt rich, Lighter are Fe rich
HAADF detector was used for taking STEM micrograph of PtFe3 nanowires. The image quality is not very good. This could be because the beam was being focused on a single NW. Since the diameter of the NW is only 10 nm, the interaction volume is very small for the electron beam. This leads to a very small signal for the STEM detector
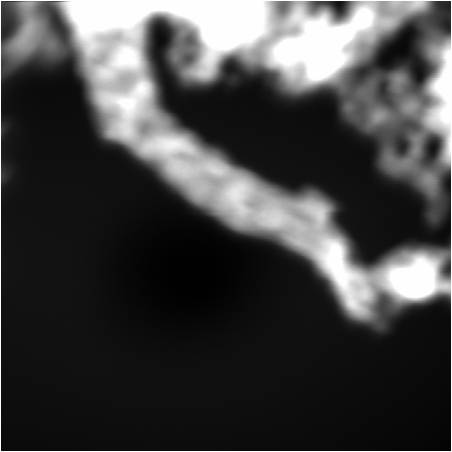
Image colorization was done using Photoshop. Multiple layers were used to get the desired picture. For the SEM image one layer was used to paint the NWs blue while another layer was used to color the background NWs green. For the HRTEM image the Pt rich area has been colored dark blue while Fe rich region has been colored light blue .The background was colored black. Choice of color was very tricky because the natural color of Pt is grey and of Iron is also blackish-grey. However some Pt alloys do have a bluish tinge and so it was decided to use various shades of blue.
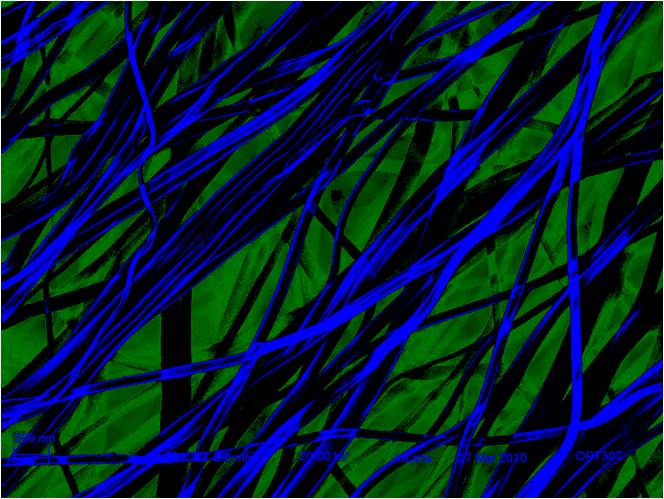
Figure 13: Colorization of SEM micrograph using Photoshop
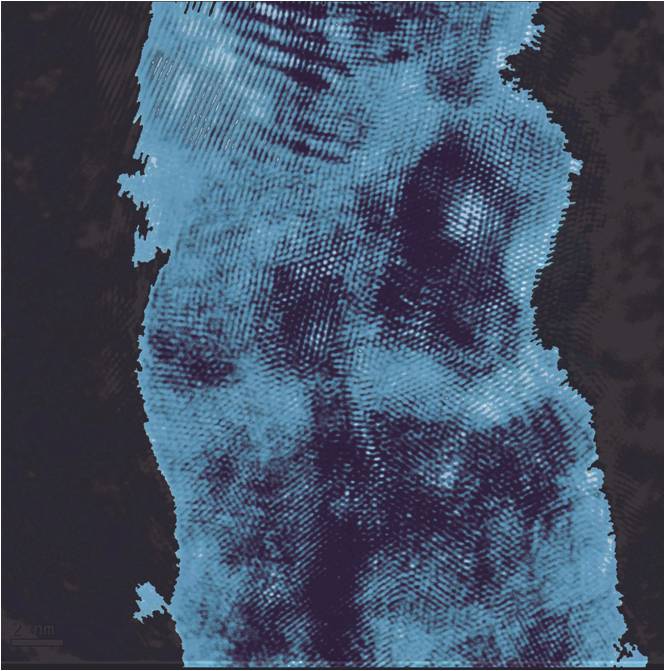
Figure 14: Photoshop Colorization of HRTEM image; Pt rich area has been colored dark blue;
Fe rich region has been colored light blue
“Winxray-1.3” is freely available electron flight simulation software which was used to simulate the electron-sample interaction for the PtFe3 sample in the SEM. The accelerating voltage was set as 20KV as most of the micrographs were taking using this value. The atomic ratios of Pt:Fe was set as 1:3. The simulation calculated a maximum depth of penetration of the electrons as ~ 830nm. The width of penetration was calculated as ~ 600nm.
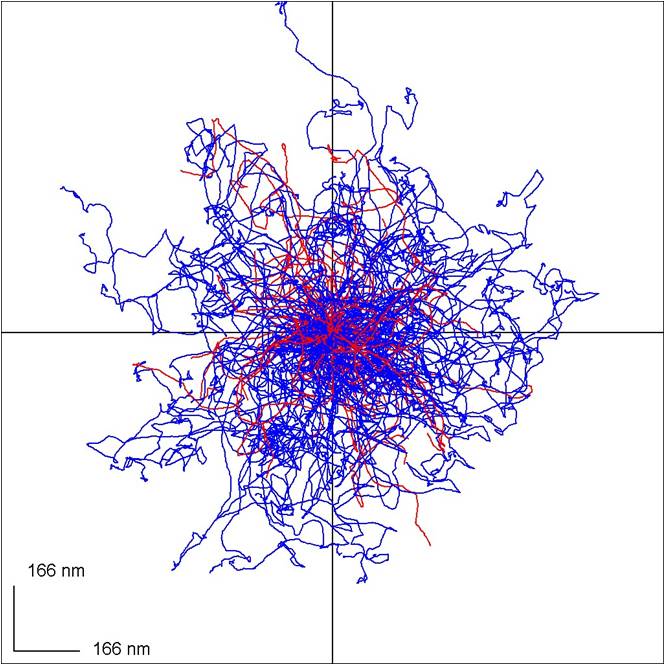
Figure 15: X-Y Plane (the plane of the sample):
Width of penetration ~ 600nm
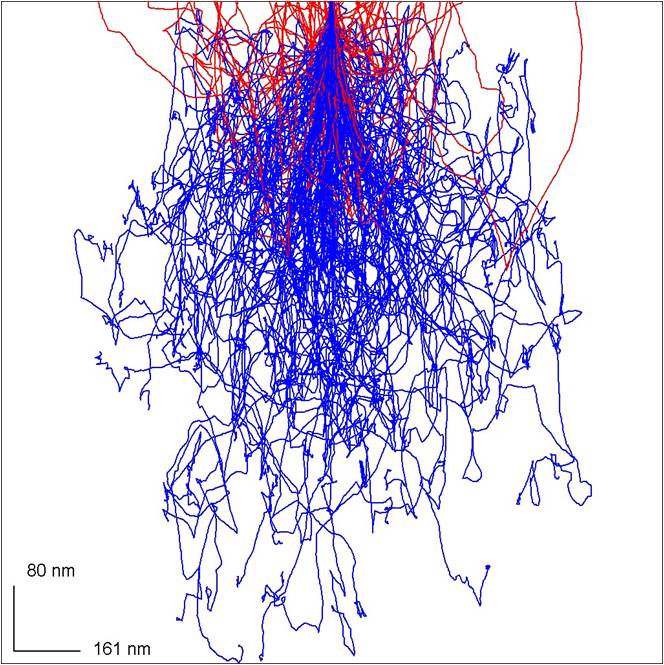
Figure 16: X-Z Plane:
Depth of Penetration~ 830nm
(1) ,P.J. Ferreira, G.J. La, O.Y. Shao-Horn, D. Morgan, R. Makharia, S.Kocha, H.A. Gasteiger,“Detachment of Pt and/or Pt alloy nanoparticles from the carbon support” J. Electrochem. Soc. 152, A2256-A2271, (2005).