Guitar String Gunk
What an Electron Microscope Sees
Benjamin Berson, The Institute of Optics
University of Rochester, Rochester, New York
benjamin.berson.rochester.edu
Return to Other Projects

Image 1: An SE2 image of a guitar string
Table of Contents
- What we're dealing with
- Why Electron Microscopes
- EM Perspectives
- Depth of Focus
- New String
- The Gunk
- Stereo Pairs
- Backscatter
- EDAX maps
- Colorization
Introduction
I.What We're Dealing With
Let’s explore what happens to old wound guitar strings. Wound strings have a core wire wrapped with a thinner wire of a different material. We’ll be using strings that my Optics 101 professor,
Wayne H. Knox provided.s The strings are all D'Addario EJ16-3D Phosphor Bronze. The sound of guitar strings degrades over time, but there hasn't been much academic study on why. They're cheap enough, and sparse available scientific literature focuses on the effect of metals on guitarists' fingers as opposed to the sound. Professor Knox had told me that his guitar teacher, local musician Kinloch Nelson would be able to keep his guitar strings in suitable shape for ridiculous amounts of time, just by washing them and putting them back onto the guitar. I decided to use my SEM practicum final project to explore why.
I compared Dr. Knox's old strings that he had just changed with both brand new strings and strings that had been left in the air for a few days to corrode, to see if there was any immediate difference that might lead to the stunning brilliance of brand new strings that lasts only a few hours. The amount of corrosion that happened did not provide a large enough difference to justify a conclusion, whereas the gunk, well, just look and see!
Return to Top
II.Why Electron Microscopes?
Guitar strings are macroscopic objects, so why would we need such a powerful microscope to look at them? Couldn't we just use an optical microscope? Well, I tried, using Nomarsky imaging on an Olympus Optical Microscope . First I got this.
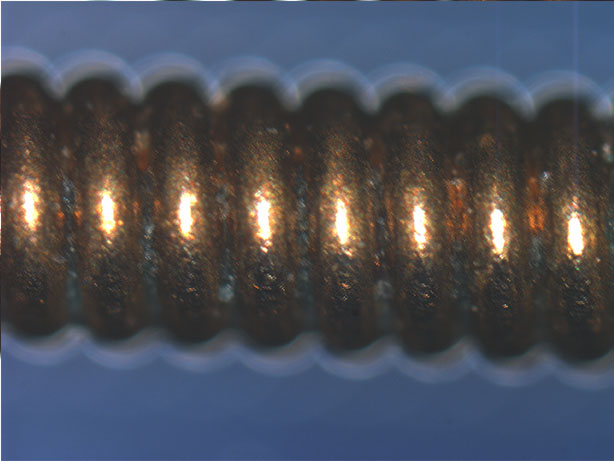
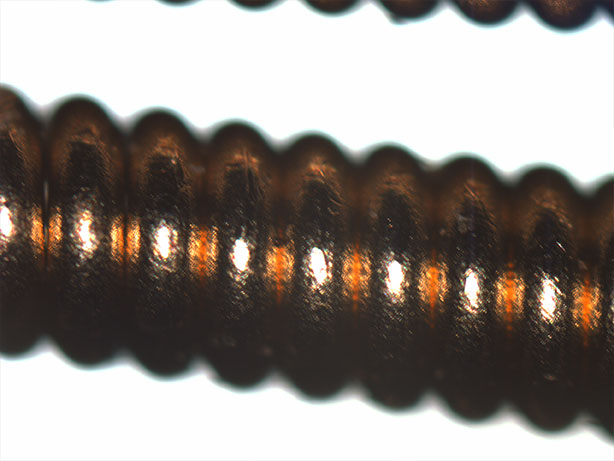
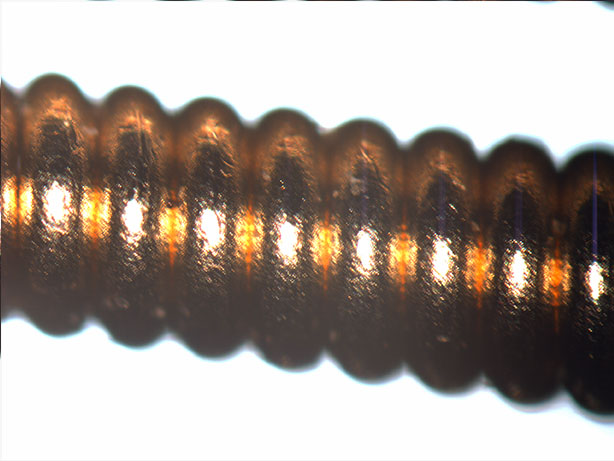
Images 2-4: Old, corroded, and brand new strings, respectively, taken with Nomarsky imaging mode with the University of Rochester's Olympus microscope.
Note that these are all D strings with diameter ~.8mm. That's not too bad, right? Let's see if we can get a bit closer.
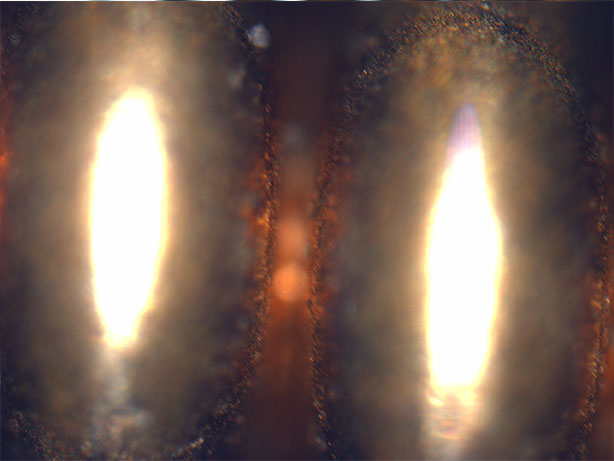
Image 5: Oof. Optical microscopes just don't have the depth of field to give us images of much use.
Return to Top
Electron Microscope Perspective
1. Depth of Focus
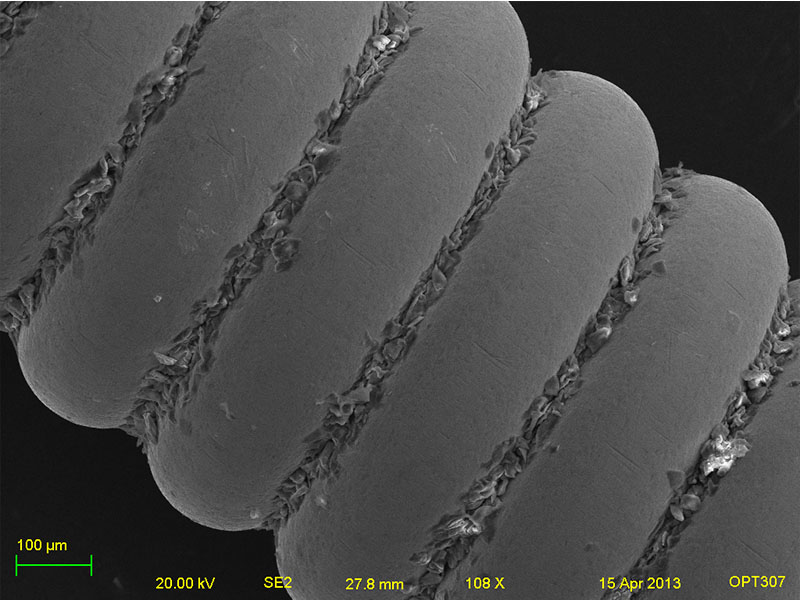 Image 6: SE2 Image of a guitar string
So that’s what it looks like! Initially, I sputter coated the sample with ~100 angstroms of gold (the artifacts we're dealing with are on the relatively large side, so 100 angstroms was reasonable) but due to the conductivity of the samples and tricky topology, uncoated images generally came out better. Unfortunately, electron microscopes only take black-and-white images, but their depth of focus allows them to get much more useful images of small things with variable topography.
Return to Top
2. Compare to a new string
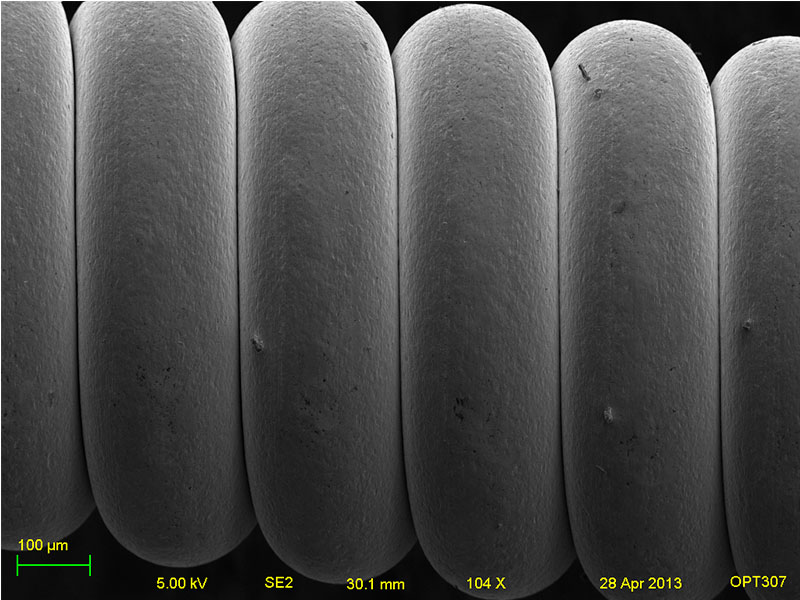 Image 7: A string right out of the bag
Return to Top
3. Check out that gunk!
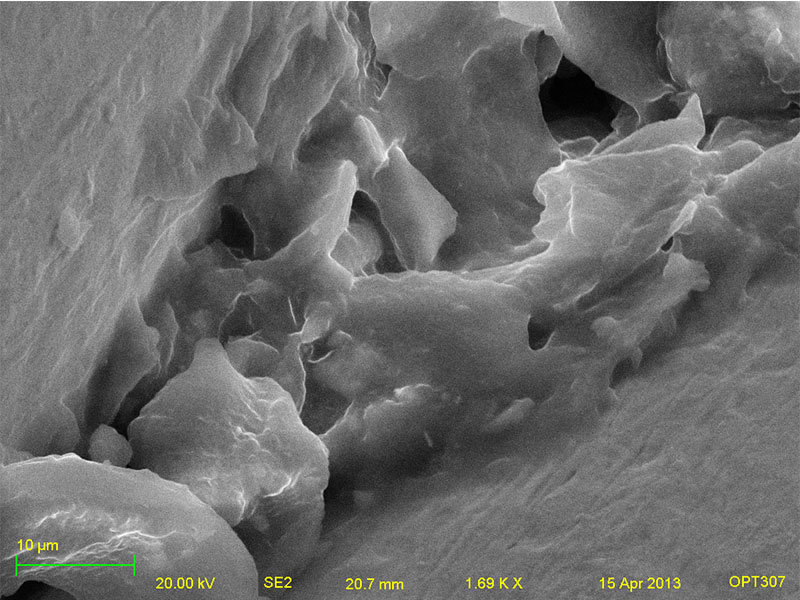 Image 8: Closeup of the gunk: it appears to be skin particles ad dirt
Return to Top
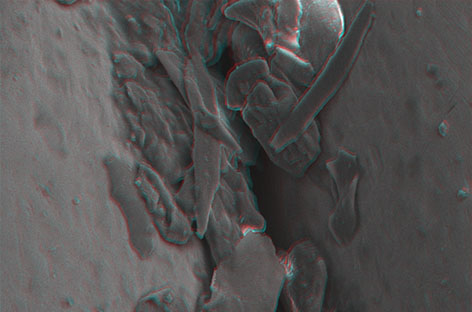
4. Wouldn't it be nice if we could get some depth perception?
Hint: Put on some red/blue 3D glasses. These are 3D anaglyphs, also known as stereo pairs, and they give you a clearer idea of the depth of the image.
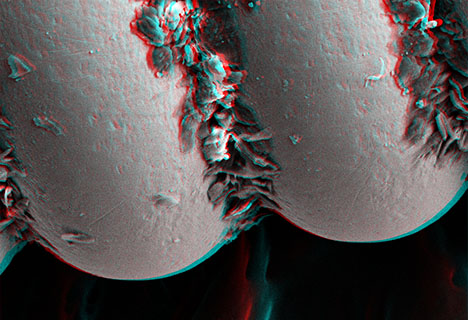
Image 9: Anaglyph 1
Return to Top
Image 10: Anaglyph 2
Return to Top
3.What's the gunk, pt. 1 - Backscatter Techniques
Backscatter detection images were taken to see whether the gunk and spots were made of the same stuff as the overall wire: the results are below:
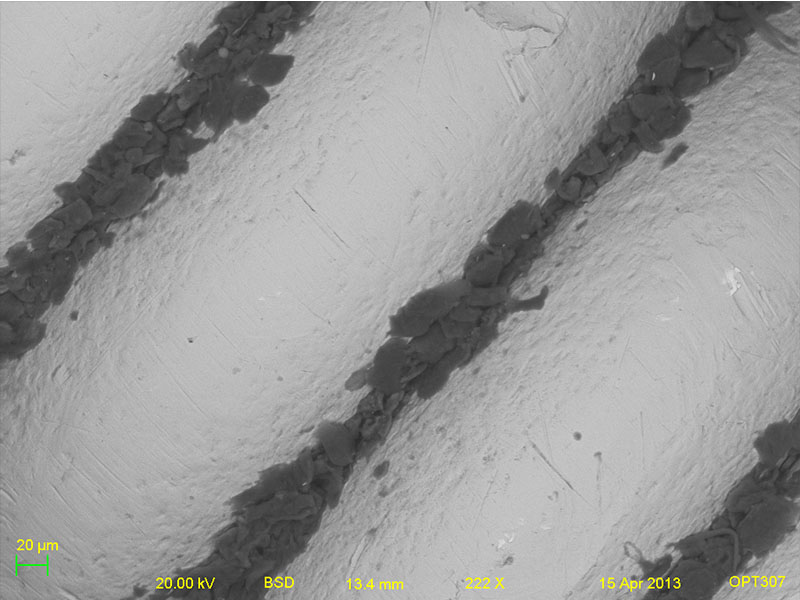 Image 11: Backscatter Electron Detected Image
Return to Top
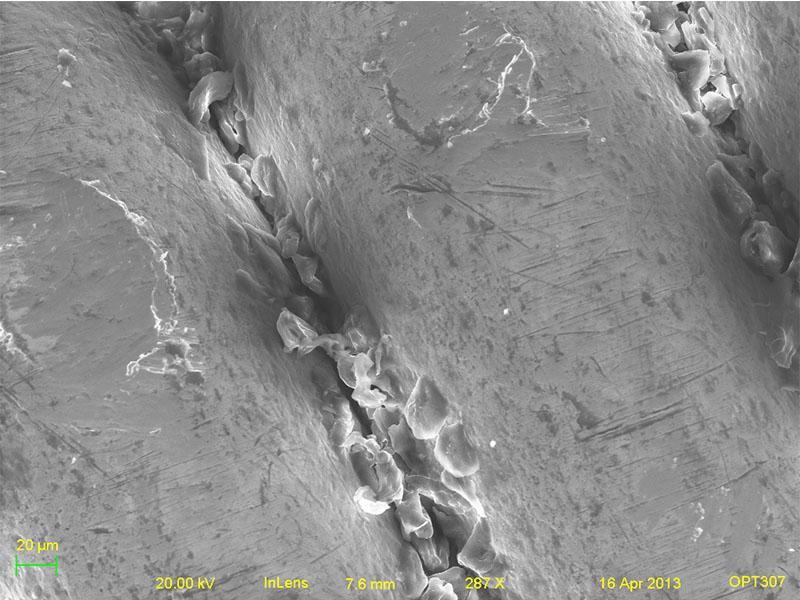
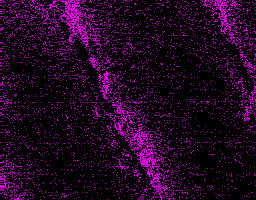
4. What's the gunk, pt 2. X-Ray Spectral Maps
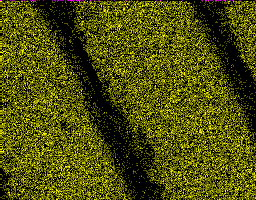
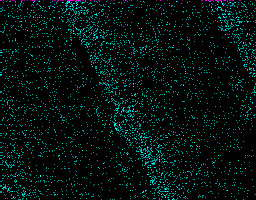
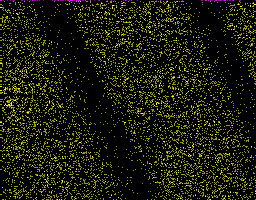
With x-ray spectroscopy, we can see roughly what elements correspond to which parts of the strings. Matched with an image of the same area, it is evident that the gunk is carbon, which is consistent with the skin particles in the 3D anaglyph. The sample contained significant amounts of copper and tin (from the wire itself), Oxygen from oxidation, and Carbon from the gunk.
Energy Dispersive Spectral mapping allows us to see roughly where each element is in an image. Due to the portion of the interaction volume of the beam where x-rays radiate, EDS is much less precise than secondary electron or backscatter imaging. Here are the maps of Carbon, Copper, Oxygen, and Tin for a gunked string.
Return to Top
Images 13-17: An Inlens image (for better top-down viewing) with accompanying spectral maps
5. Colorized SE2 and BSE Image Detector
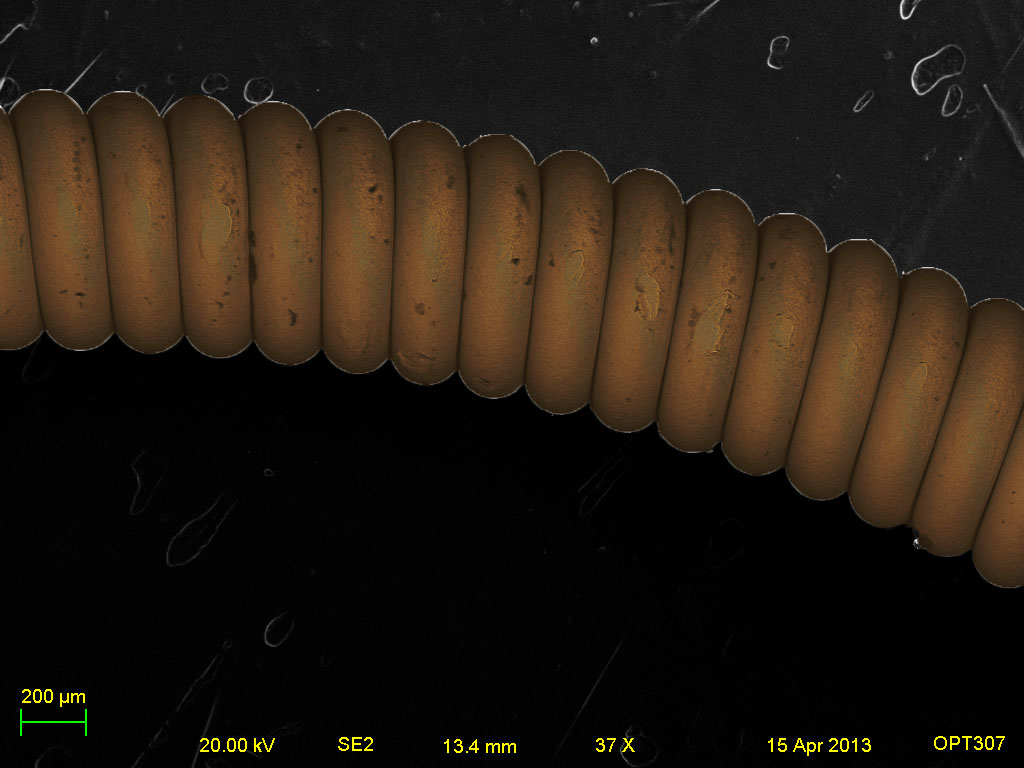
Image 18: Colorized Image
This is a sample from the same wire but from the neck of the guitar not touched as much. Lets see the gunk. This is a composite backscatter/SE2 image, colorized to show the surface atomic makeup (via backscatter) as well as the topology (from both).
In this backscatter image, we see the scratches this shows the played part of the wire. Note that the depth of the scratches comes nowhere near the depth of the gunk. Kinloch Nelson, local celebrity guitar player, figured out that if you clean the gunk and corrosion off of guitar strings, they can be reused with excellent results. The thick gunk may be the prime cause for premature retirement of strings, and assuming sound degrades more with larger artifacts, the relative thickness of the scratches vs. the gunk helps us understand why.
Return to Top
Acknowledgements
- Brian McIntyre, SEM Microscopist, Senior Engineer and Instructor:
For the unparalleled lessons, constant reassurace, and refreshingly intelligent conversation.
- Professor Wayne H. Knox:
For letting me use his guitar strings, sparking and supporting this project, and making me wish I lived in Hawaii.
- Kinloch Nelson: For helping me to help poor guitarists everywhere.
"Well, what I do is coil up the strings, then put them in boiling water for a few minutes to loosen the grit. Then I take a bar of Lava soap, which has pumice in it, and lather up my hands and then just grab the coil of strings and get the pretty well soaped and scrubbed. I'll use a scrub brush too. The rinse and reboil to boil off any remaining soap & grit. Then unwind each string so that it is straight again and pull each one through a towel for a few times to dry them and remove more grit. Then do again but with a little 91 proof rubbing alcohol on the rag to get the remaining loose grit.
That's it. Put them back on and you have clean strings that sound almost new. Strings are usually good for one maybe two washings. What you can't get rid of is the effects of stretching and fret wear."
-KN
Return to Top