Magnetically Aligned Nickel Micro-particles for Lithium Ion Battery Anode Stress/Strain Detection
Joseph Matthew Kaule
University of Rochester, Department of Chemical Engineering, Master’s Candidate
OPT 407, Spring 2013
Introduction and experimental motivation:
In a society who’s focus is centered on alternative energy, ranging from the politically focused, to the concerned consumer, the field of high energy storage devices is a prominent subject. Current designs of Lithium Ion batteries only use a small percentage of their available utility. Theoretically speaking, regardless of the low efficiency of alternative energy production methods, the true “missing link” to transitioning society towards a sustainable-energy-future is in current battery capabilities. As logic would dictate, the sun is not’t always shining when you need it, and the wind might not be blowing. Therefore the storage of energy when it can be harvested is more important than the efficiency the energy collection method in the near-time future. Lithium has one of the highest theoretical charge capacities of any naturally occurring material, hence making it an attractive choice for energy storage in batteries. The natural cognate for the anode material be combined with lithium (when storing charge) is tin. Anodes that are composed of tin are the most ideal for high capacity lithium ion storage.
One of the main downfalls of current lithium ion batteries is their life span, which is a function of the anode’s charge cycling ability. When charging occurs, lithium ions are intercalated into or alloyed onto the anode. When discharging the battery, the lithium ions de-alloy or de-intercalate into solution and migrate towards the cathode. Completing these two steps equates to one cycle. Through multiple cycles the anode (particularly anodes with a high percentage of tin) may break apart, and loses its integrity. This cracking occurs during the volumetric change from intercalation/de-indercalation (or alloying/de-alloying) during charge cycling. Therefore since a volume change is notably causing this loss in capability, it behooves the researcher to be able to quickly detect if a new anode design results in more stress/strain being exerted on its superstructure.
My current approach is to develop a testing method to quickly determine an anode structure's efficacy is to fill the anode space with magnetic metallic nano-particles (or rods) that minimally electrochemically react with lithium. As charging is occurring and lithium is being alloyed onto the anode structure, a volume change will occur, and push the particles together to make a connection between anode superstructural components. Theoretically this will cause a short and drop increase the conductance of the anode. The change of current can be detected, and used to determine the rate of expansion during alloying. To provide some order to the alignment of the particles, two opposite pole electro magnet are placed in series (i.e.North, South, North South) with the sample sandwiched in between (see Figure 1). Under the influence of a constant magnetic field, the particles should align along the strait field lines generated between the two electromagnets. This can be used to the researcher's advantage, in that now some order has been given to the particles, the average spacing between the particles can be determined, and therefore correlated to the rate of anode structure expansion.
In order to find these distances, and observe the qualitative formation of these particles around the magnetic field lines, a scanning electron microscope (SEM) is used, as well as an elemental analysis package that enables one to visualize the dispersion of the magnetic particles in the sample.
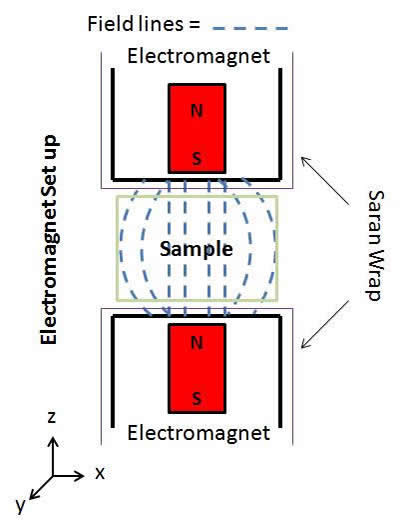
Figure 1: Experimental set up, magnetic field alignment shown as z-biased
Samples and Preparation:
Nickel micro particles were obtained from a commercial vendor, and then suspended in a [1:2:2] ratio of micro-particle to binder to dimethyformamide The nickel particles range in size from 3-7 microns. The binder was a [1:1] mixture of carboxymethyl cellulose (CMC) and styrene-butadiene rubber (SBR). Both the CMC and SBR are ionically conductive materials used as a binder in some lithium ion batteries. Though they are ionically conductive, it should be noted they are not electronically conductive. This mixture was then poured into a sample mold held between the two electromagnets (opposite pole electro magnets, OP-1212, obtained from Magnetech corporation) as represented above. Once the sample and magnets were in place, the magnets were switched on at an amperage of 0.502 Amps. The magnets are rated to produce 250 Gausses at 0.72 Amps, which is an equivalence of 0.025 Tesla. It is reported by Tokarev et al, that 0.004 Tesla is enough for the magnetic alignment of nickel micro-rods in glycerol. The magnets were kept on at this amperage for 1 hour. The samples then were allowed to cure at room temperature overnight. Once the samples were cured, they would be of a consistency of a semi-stiff rubber. To prepare them to be imaged in the SEM, one first cryo-fractured them by immersing them in liquid nitrogen, and simply breaking the hardened sample by hand. This produced two types of imaging planes, the "top view" (imaging the x-y plane), and the "side view" (imaging the z-x plane). A similar sample at the same mixture ratio was and allowed to cure overnight without the influence of the magnetic field to serve as a control. Yet another control was made by curing the same sample mixture in the gap spacing off a strong field magnet, to demonstrate what the a strong magnetic flux will do to this sample formulation.
Finally another type of control was the magnetic particles suspended in a polymer (QuickStick 135 Mounting Wax from South Bay Technology) at a ratio of [1:4], particles to polymer. This polymer is a liquid above 170 degrees Celsius, and a hard crystalline at room temperature. After the nickel particles were mixed into the polymer, the mixture was quickly poured into a similar set up as shown in Figure 1. The magnetic field was turned on at 0.72A for 30 minutes, to account for the mixtures increased viscosity and quicker drying time. This sample was also scored and fractured to produce the same imaging planes as the main test sample above.
After mounting the samples so the desired imaging plane was oriented perpendicular to the normal direction of the SEM primary beam (i.e. the z-direction), all of the respective samples, and sub-types were coated with ~70 angstroms of gold with the sputtering machine in the University of Rochester's SEM/TEM prep room. Connection at all of the edges was assured with a small dab of conductive carbon pain prior to sputtering. All of the samples were imaged in the Zeiss Auriga Crossbeam SEM System at the University of Rochester, with additional analysis being preformed by the attached EDAS Phoenix x-ray dispersive spectral (EDS) analysis package as well.
Imaging Theory:
Because both the crystalline polymer and the binder used in the main test are both electrical insulators, and have a relatively low atomic weight, while using the secondary electron detector on the SEM (SE2), the embedded nickel particles will be less visible, than when using the backscatter detector (BSD), or when using a high accelerating voltage spectral map, accounting to the atomic weight difference between the particles and the respective binder. This will enable one to then "image through" thin sections of the binder, and as evidenced, generate a BSD stereo-pair micrograph.
The different imaging modes for the samples used were as follows:
- Backscatter detector (BSD)
- Secondary electron detector (SE2)
- Mixed BSD+SE2
- Spectral mapping with EDAX at 15kV and 30kV
- Energy dispersive x-ray spectrometry (EDS), with ZAF quantitative analysis.
- *Stereo-pair imaging: Mix SE2+BSD and BSD alone
Additional analysis was completed with ImageJ to show that the BSD is able to detect more nickel micro-particles than the SE2 detector. Colorized images with Photoshop are shown to highlight the results of the spectral mapping.
Imaging Results:
Field magnet aligned micro-particles:
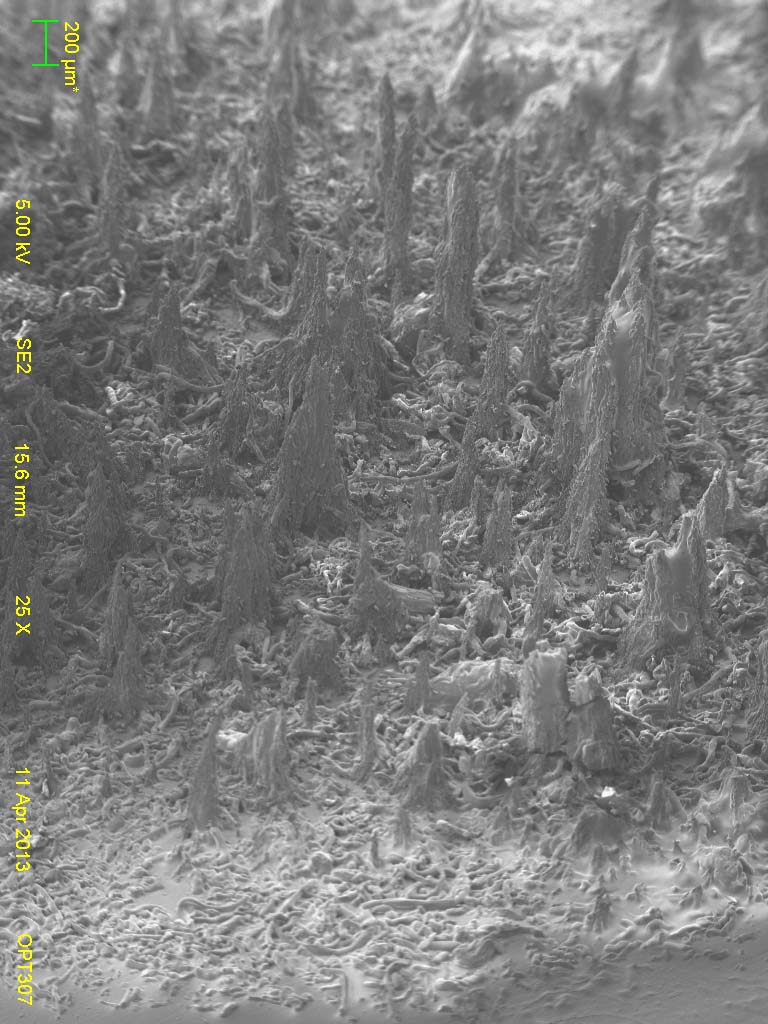
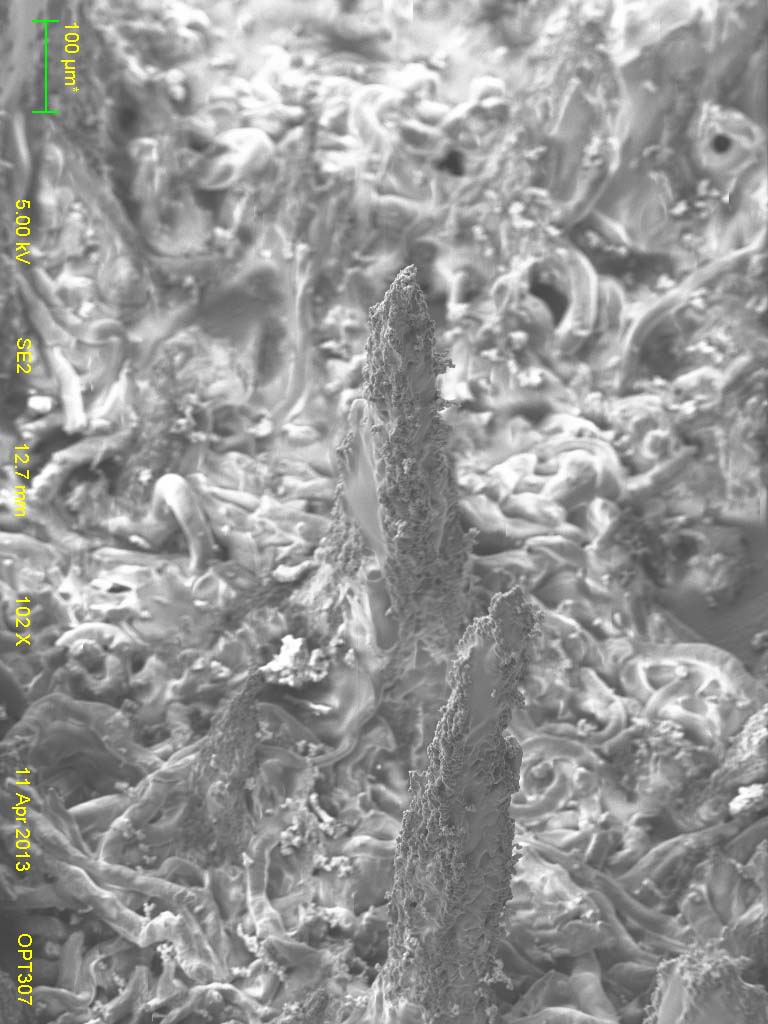
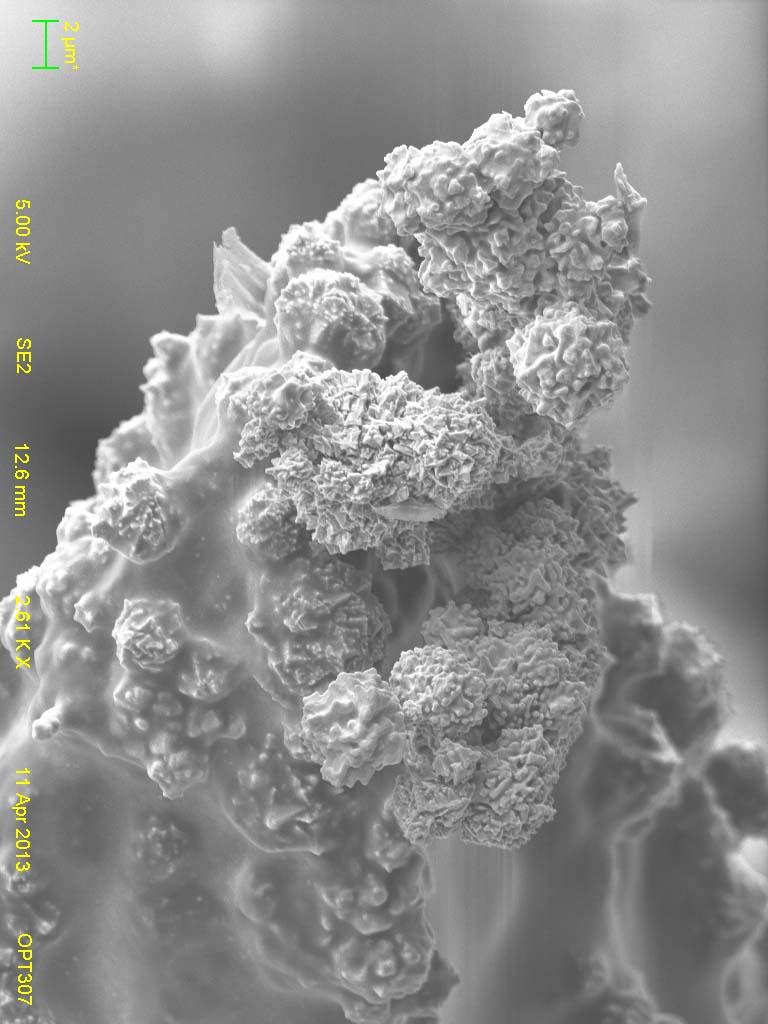
Figure 2: Images taken with the SE2 lens at 5kV accelerating voltage, with magnification (mag.) of 30, 100, & 210X. It is evident that the strong magnetic field influences the particle formation. The nickel micro-particles are the small "spike" balls embedded in the "smooth" binder.
Control sample; top (x-y plane):
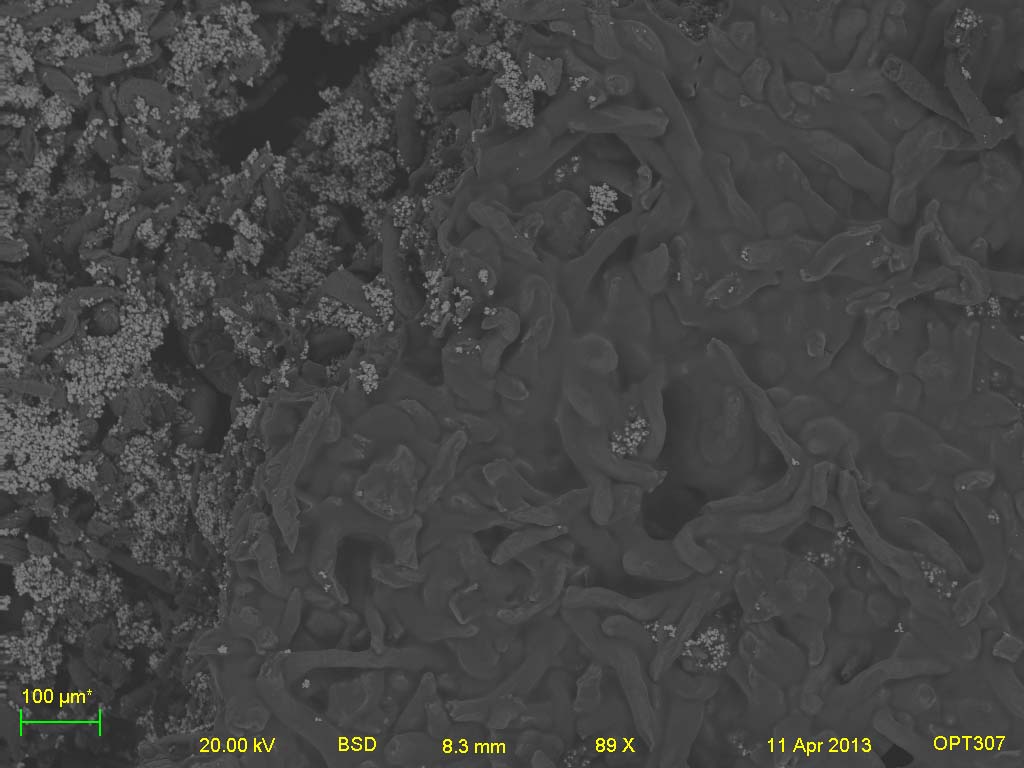
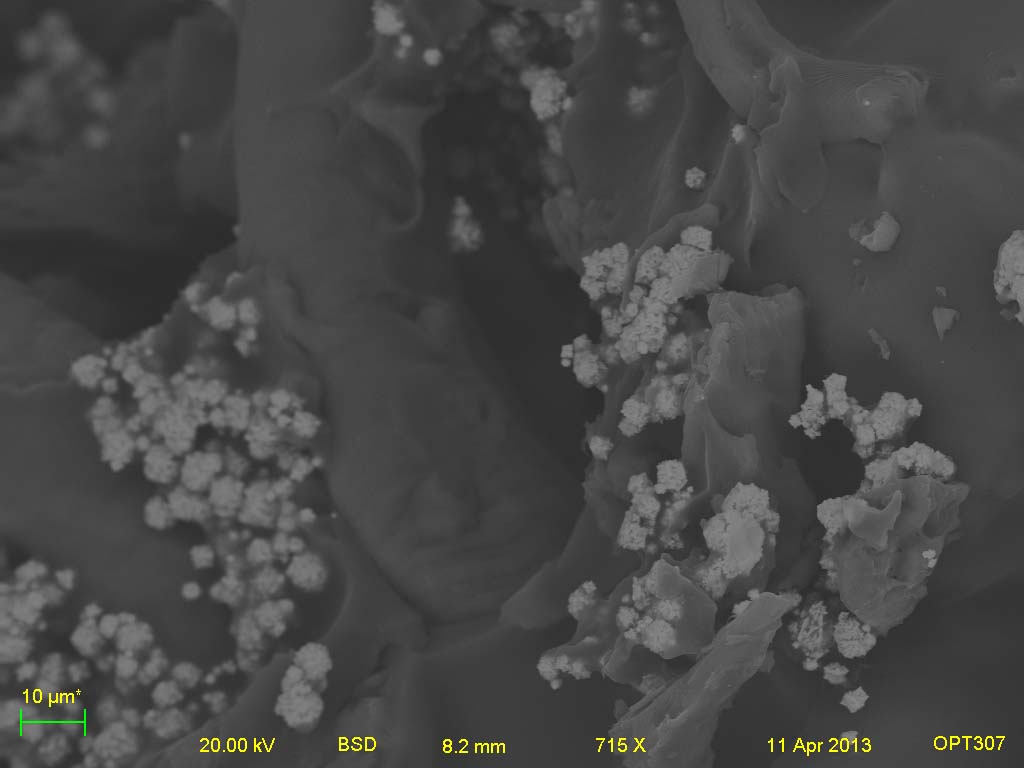
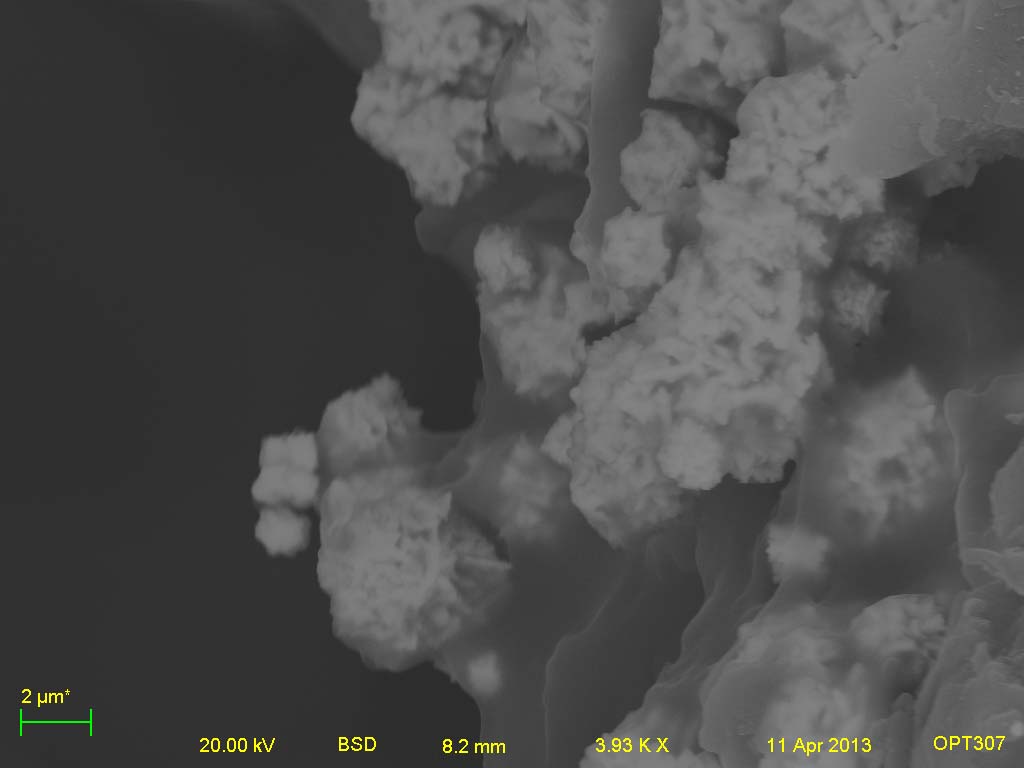
Figure 3: Images taken with BSD at 20kV, with magnifications of 90, 700, & 3.93kX. It should be noted that the there appears to be no order to the nickel particles (lighter-grey regions). It is evident that the BSD is detecting the micro-particles with more distinction as they are embedded in the binder background. The right most image highlights the varying particle sizes.
Electro magnet aligned sample; top (x-y plane):
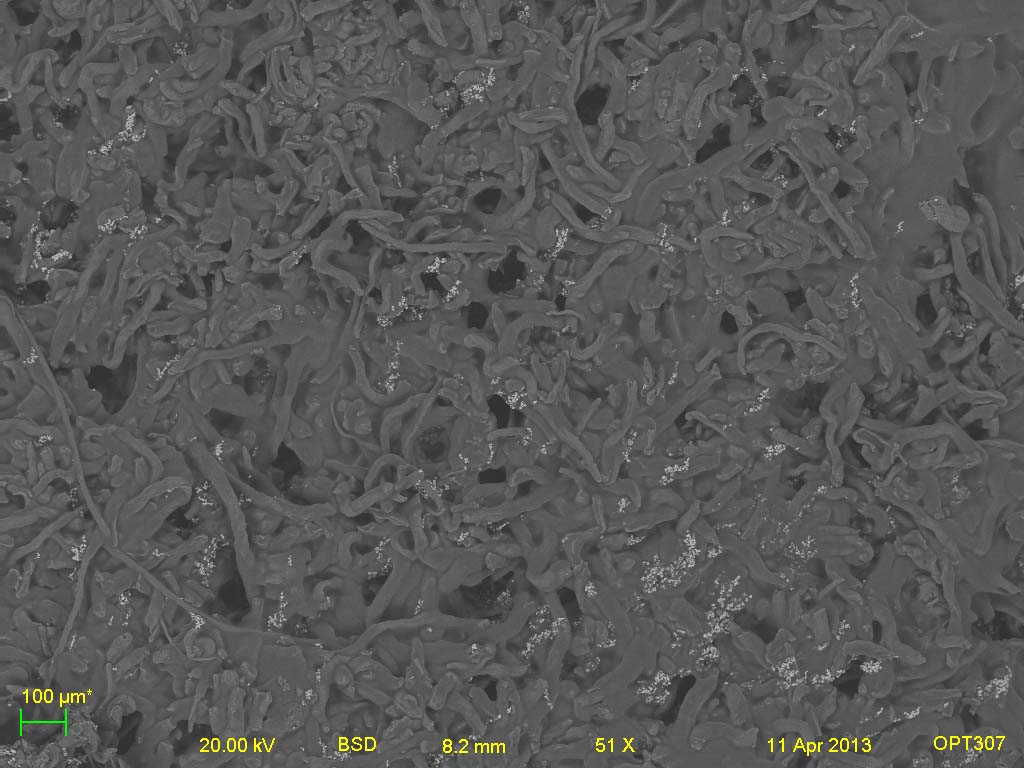
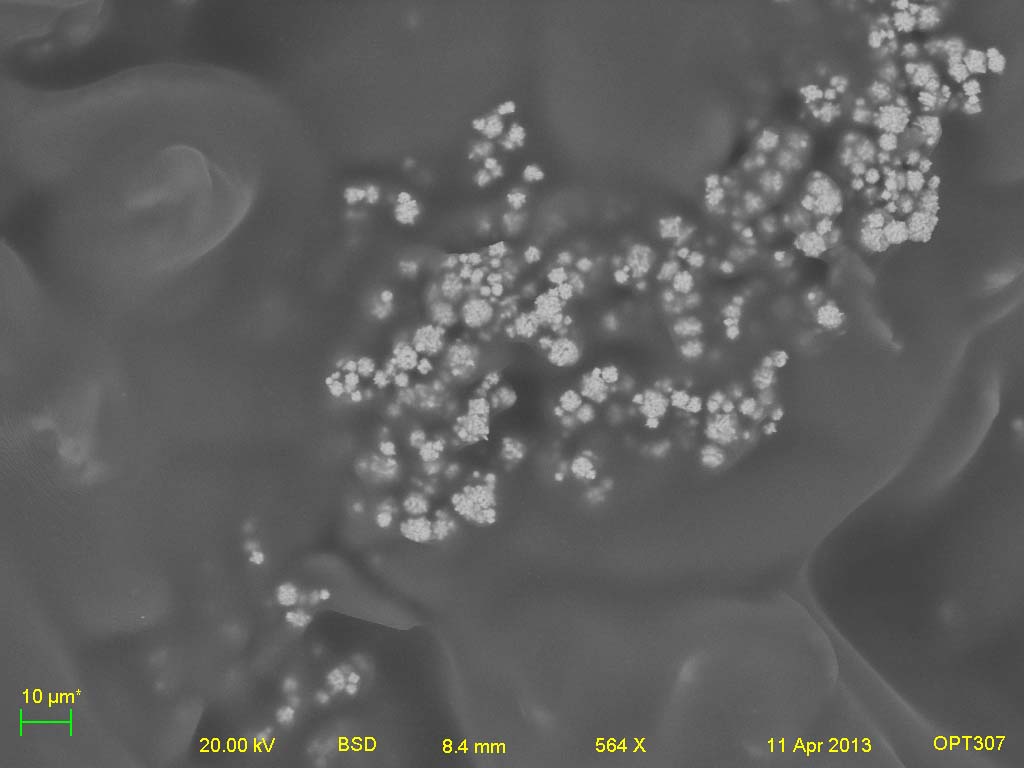
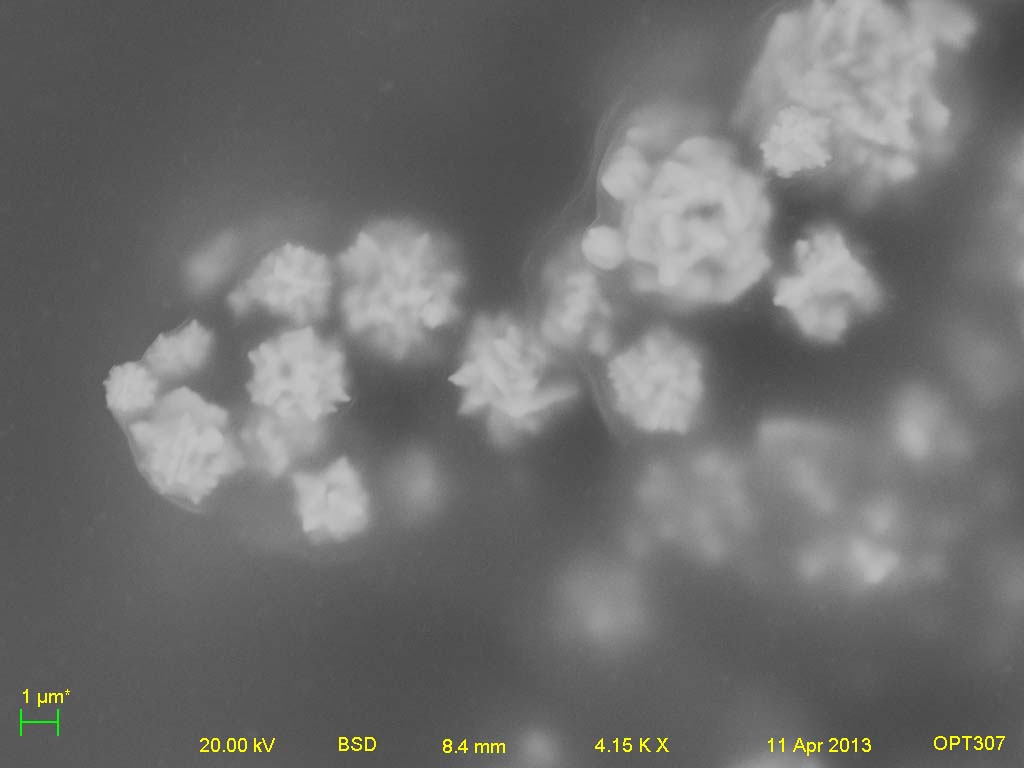
Figure 4: Images taken with BSD at 20kV, magnifications of 50X, 500X, and 4kX. It is cleanly evidenced by the left-most image that there is some bias being imparted to the nickel particle alignment. The image on the far left is a result of the nickel particles forming around the magnetic field lines, if the field lines were leaving the screen and coming at the reader. The far right image shows a preliminary example of the micro particles being seen embedded in the binder, a line of which is seen extending into the screen.
Crystalline sample; top (x-y plane)
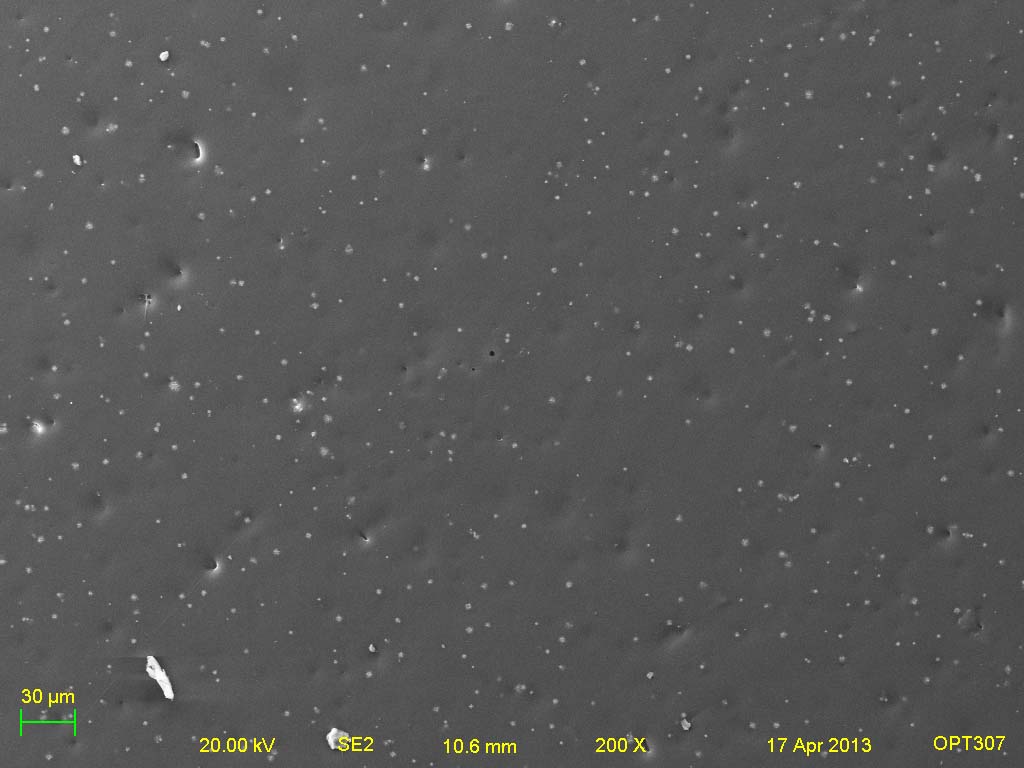
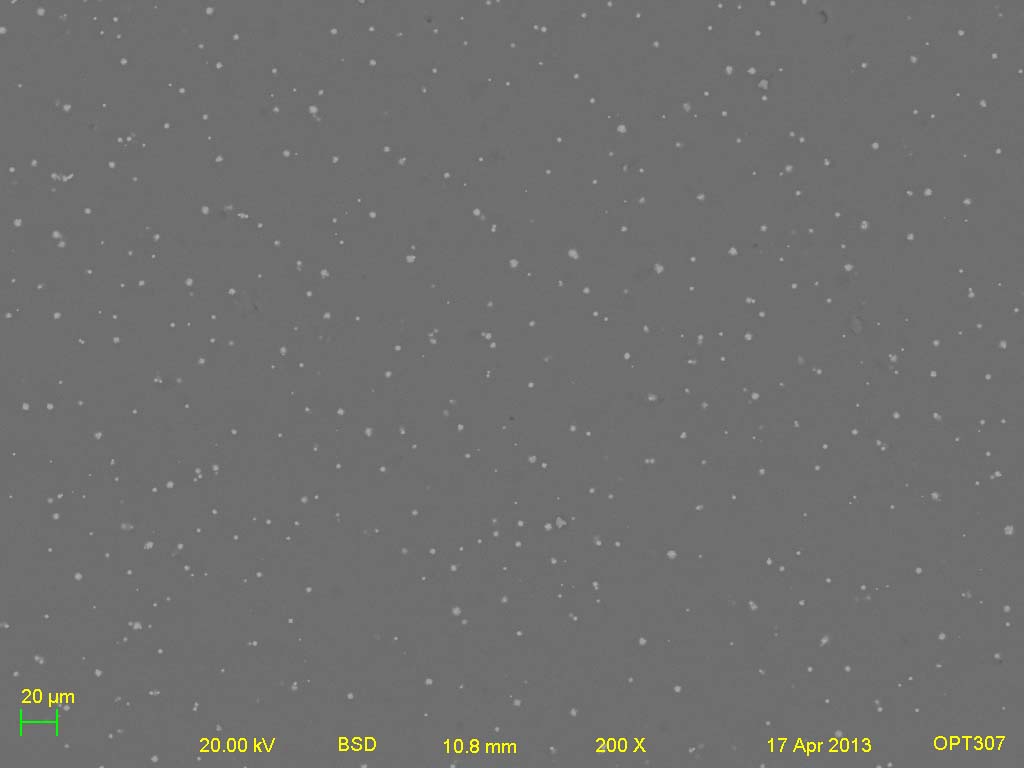
Figure 5: Images taken with SE2 and BSD, left to right respectively, at 20kV accelerating voltage, 200X magnification. These images clearly show how the BSD is able to detect more particles in the respective binder. By ImageJ analysis, the BSD image (right) has 535 recognizable particles with an average size of 8.11 micrometers and a standard deviation of 5.79 (closely matching the specified particle distribution range). The SE2 (left) only has 488 particles with an average size of 4.037 micrometers and a standard deviation of 2.91. This discrepancy in particle count, and in the average size is a result of the BSD imaging "deeper" into the binder material (i.e. detecting more incident electrons from the heavier nickel particles). The SE2 lens was only analyzing the surface of the sample, therefore it is possible that only small portions of the micro-particles were protruding, thereby decreasing the average size, and because of the depth of penetration not highlighting as many particles in totality. Again in this image, the field lines of the electro magnet would be protruding from the screen.
Crystalline sample; side (z-x plane)
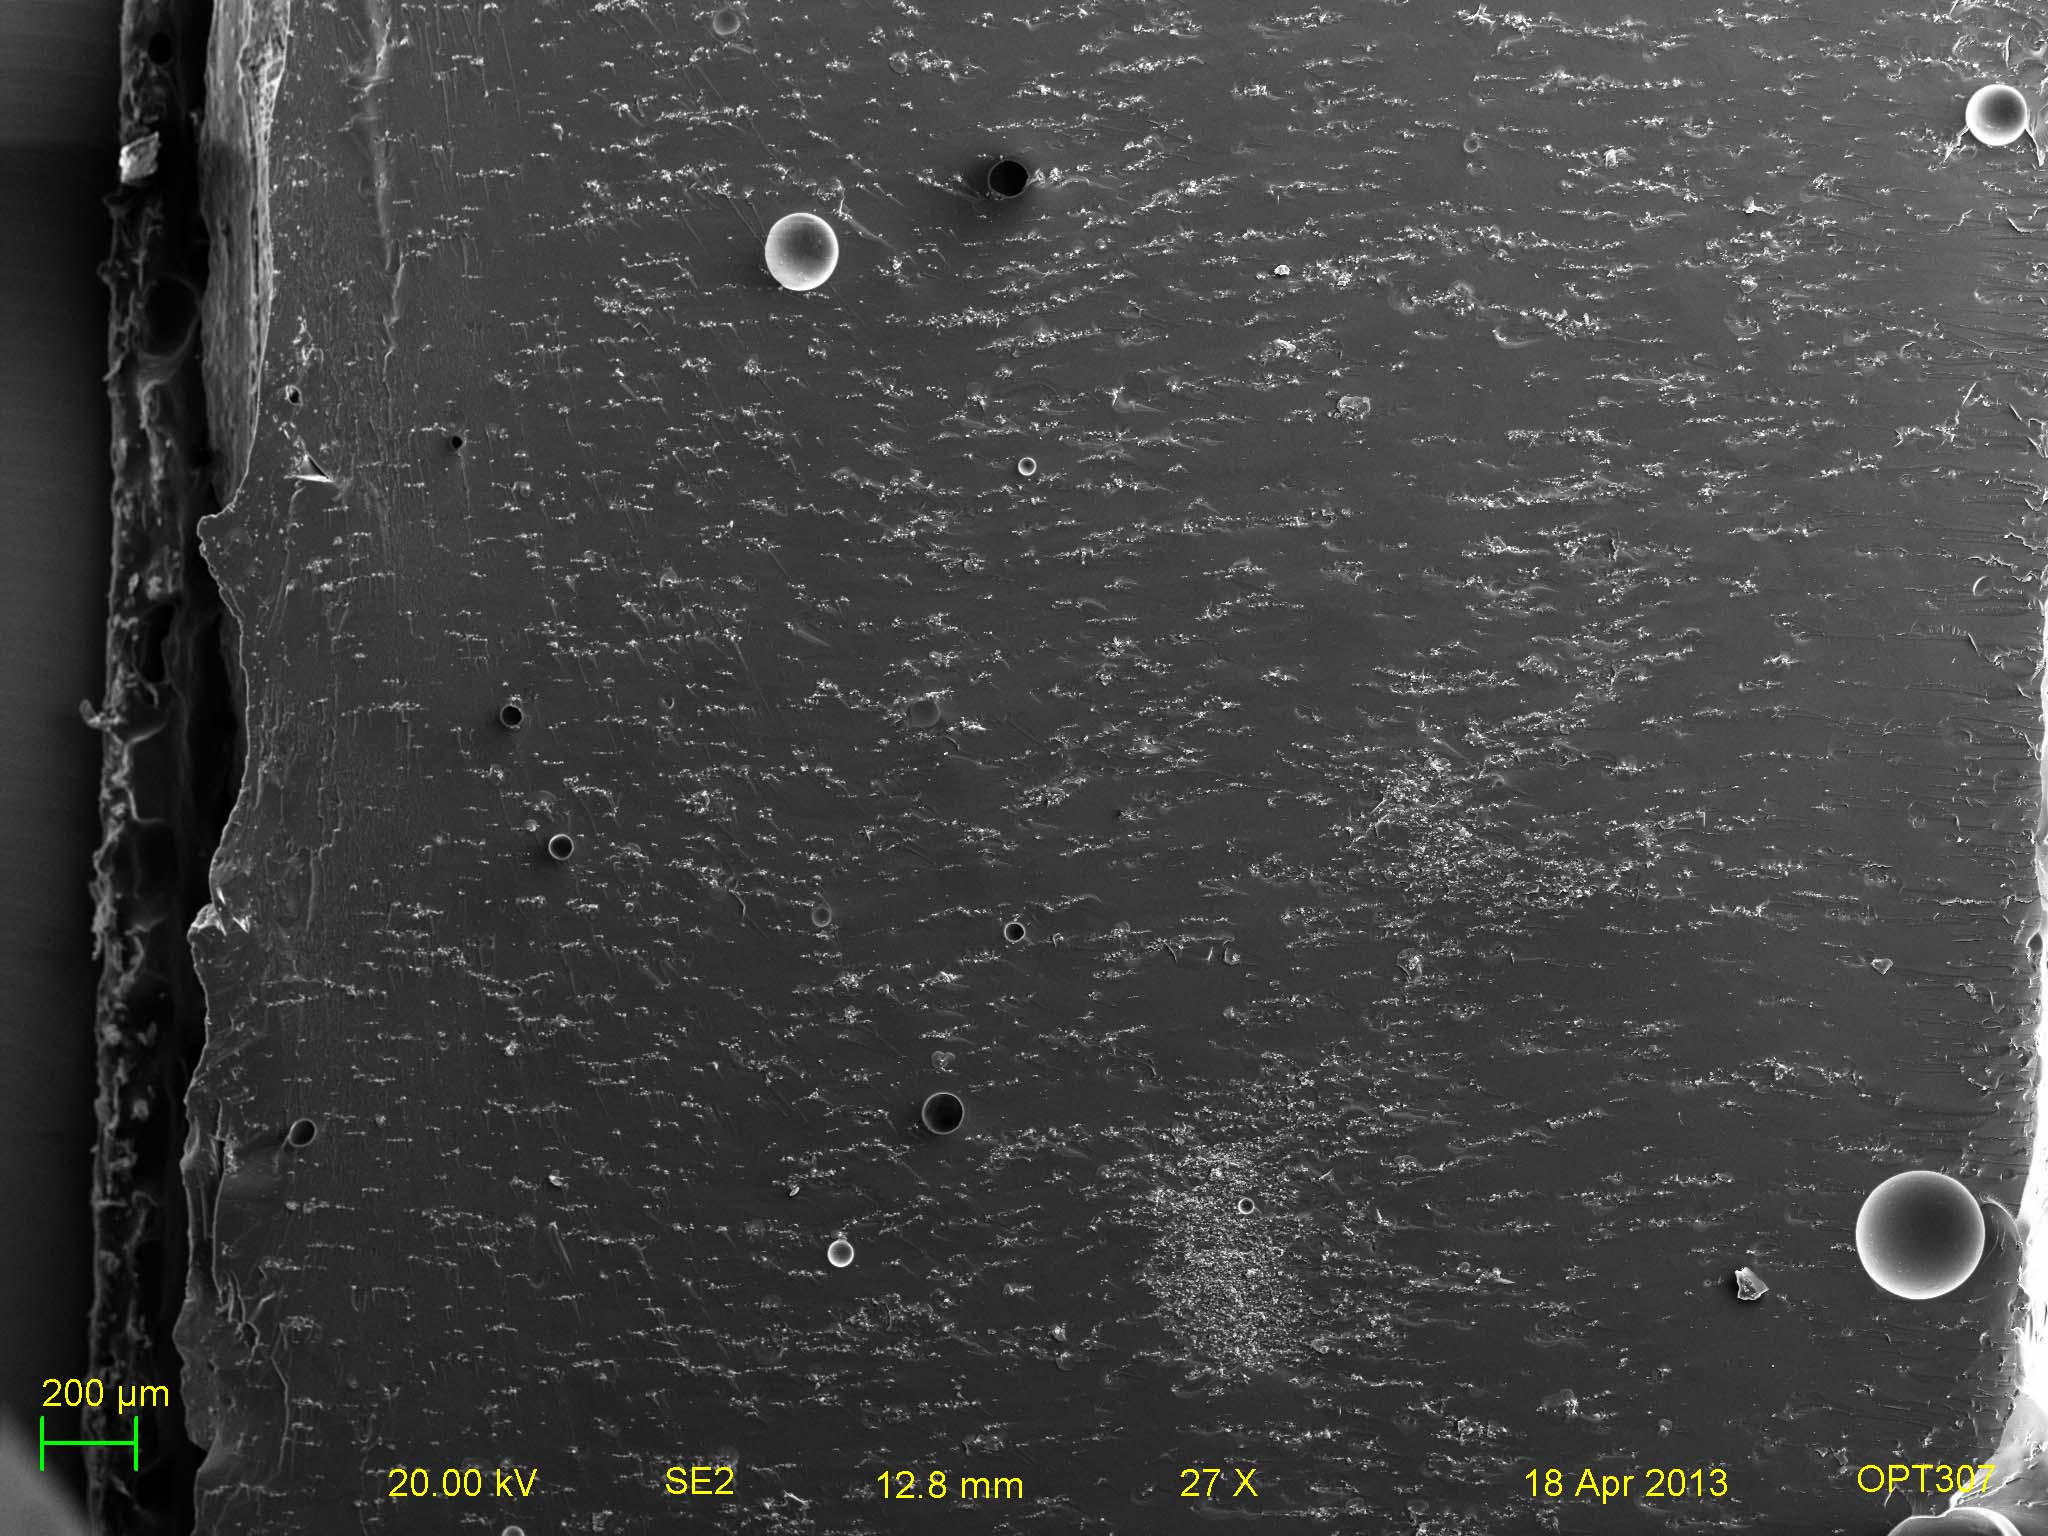
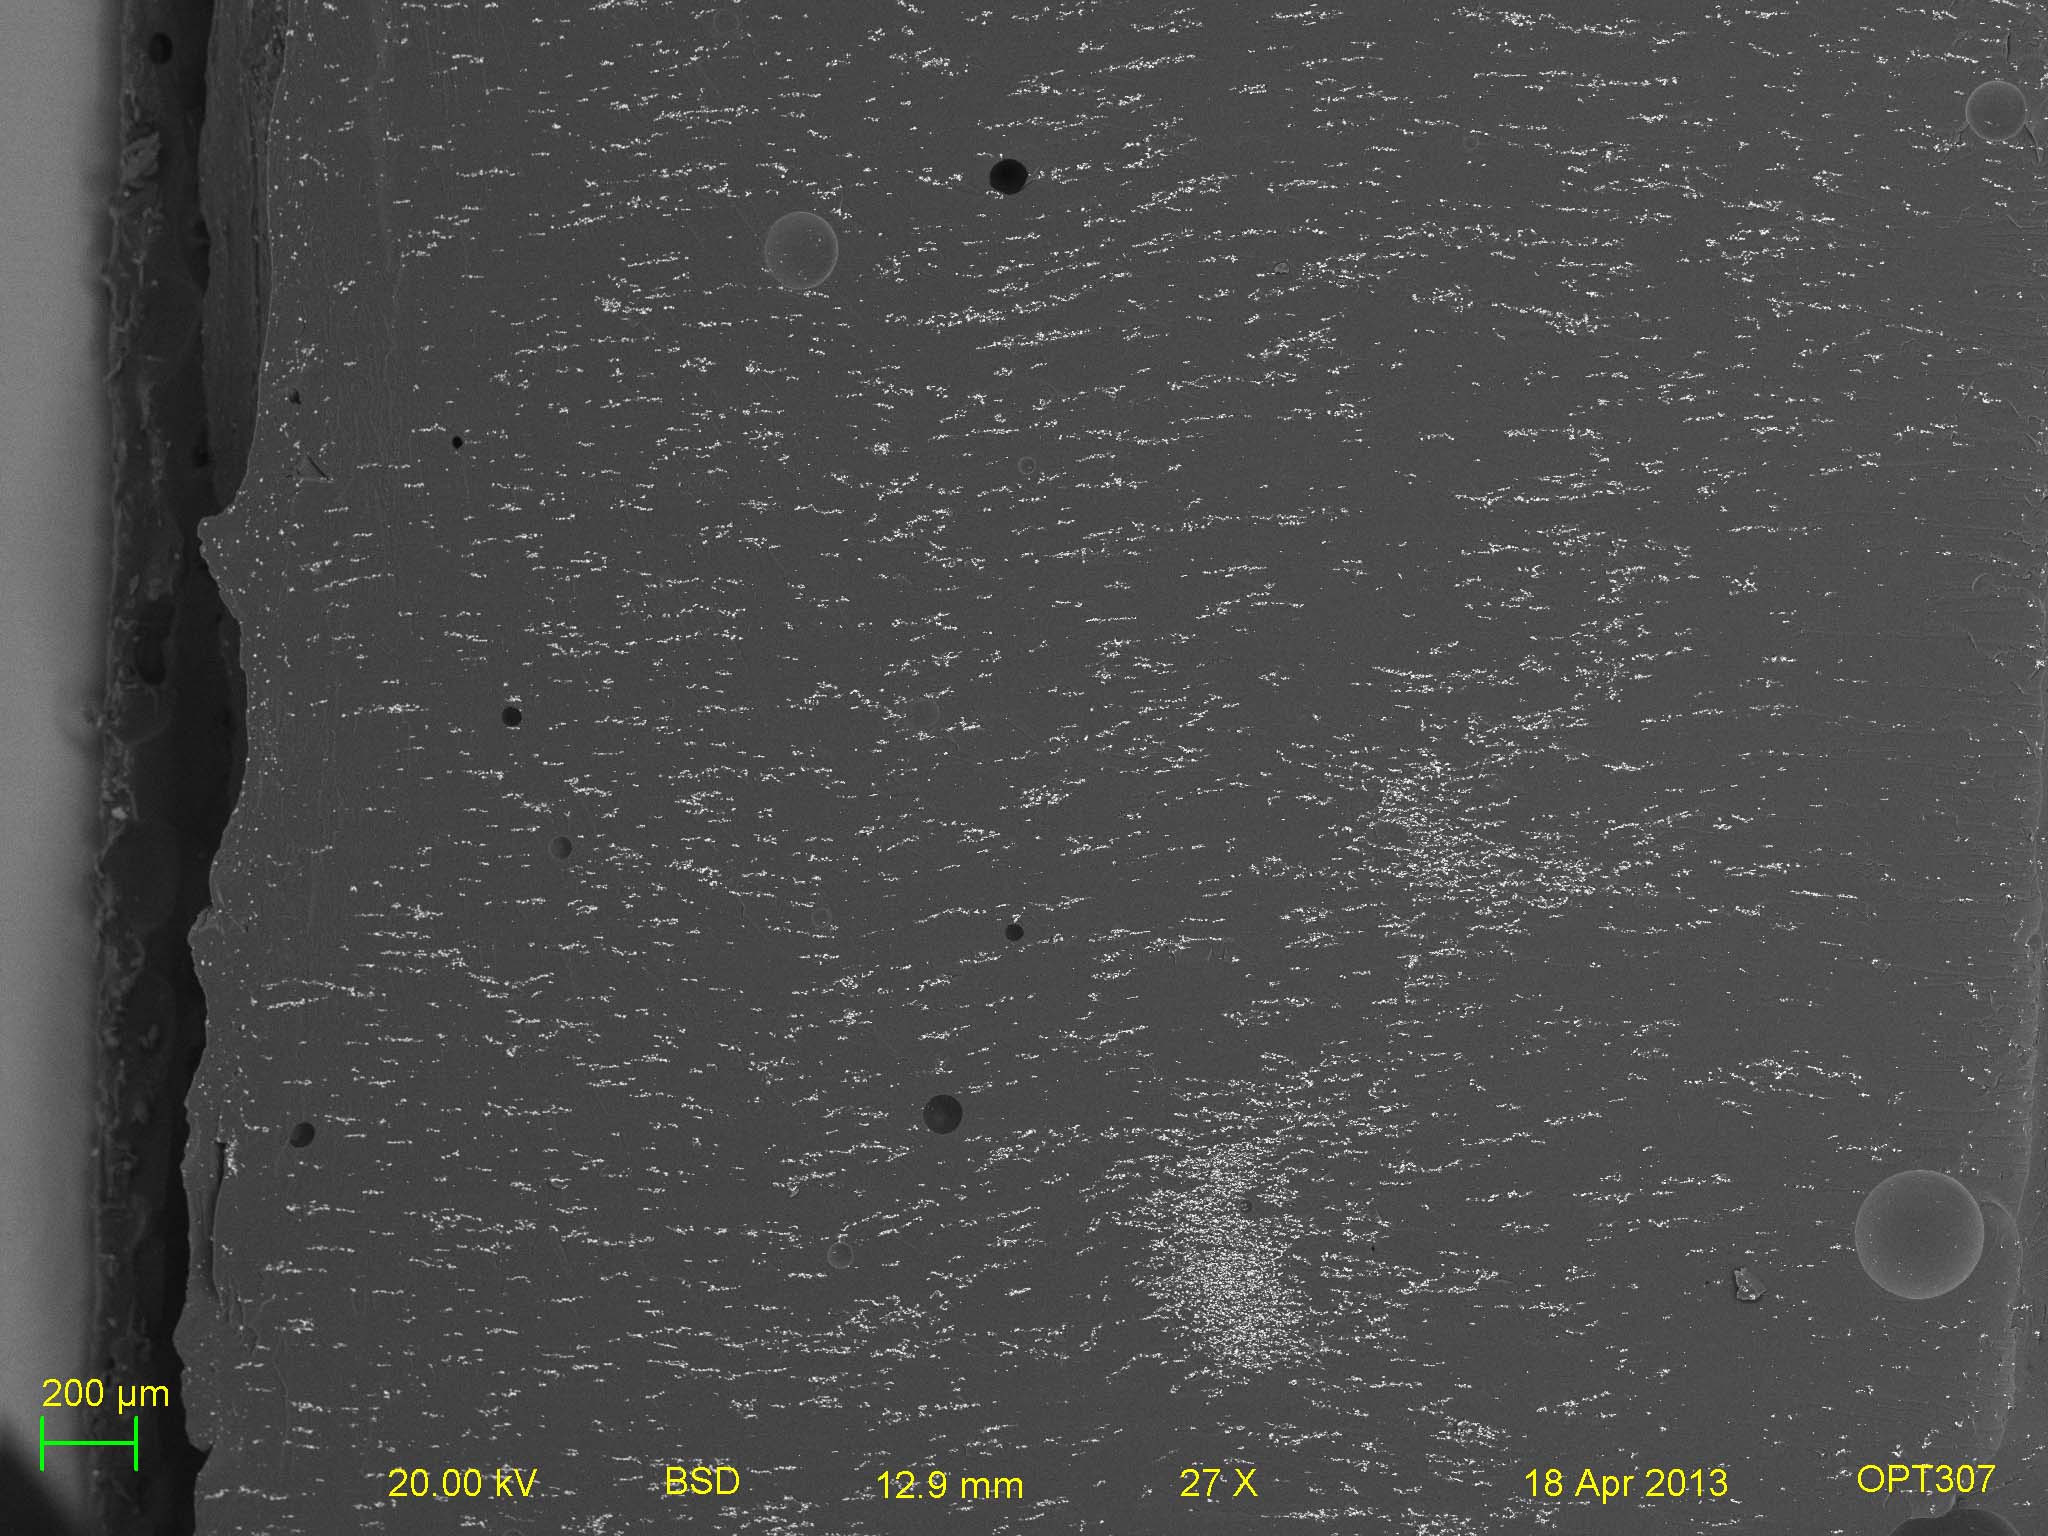
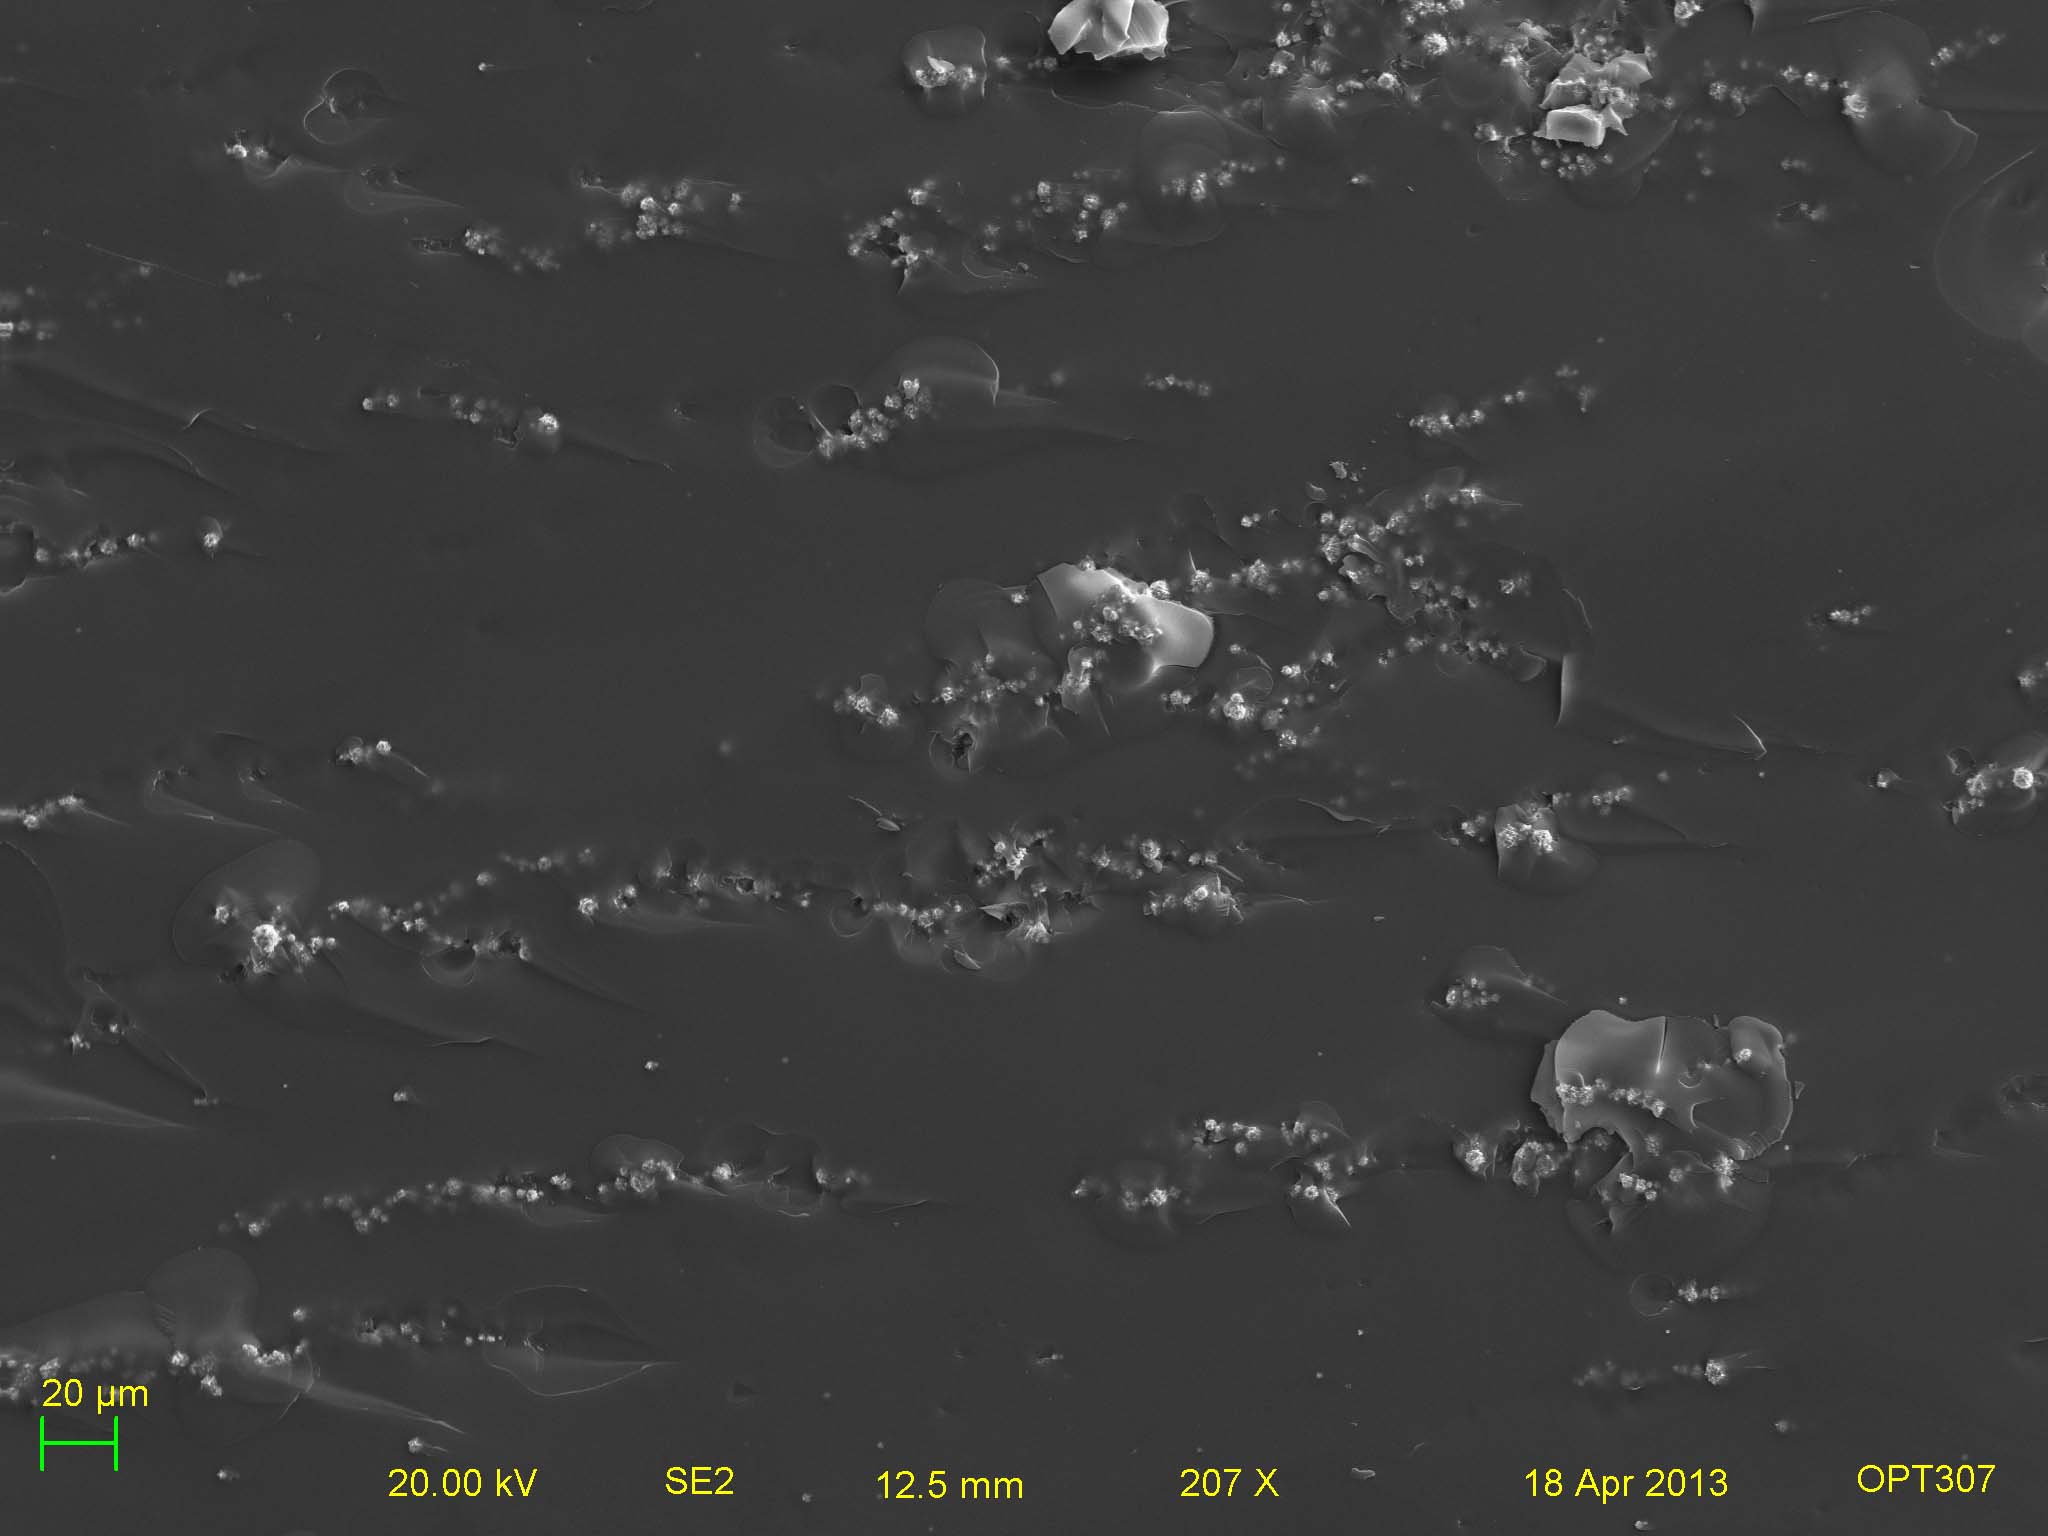
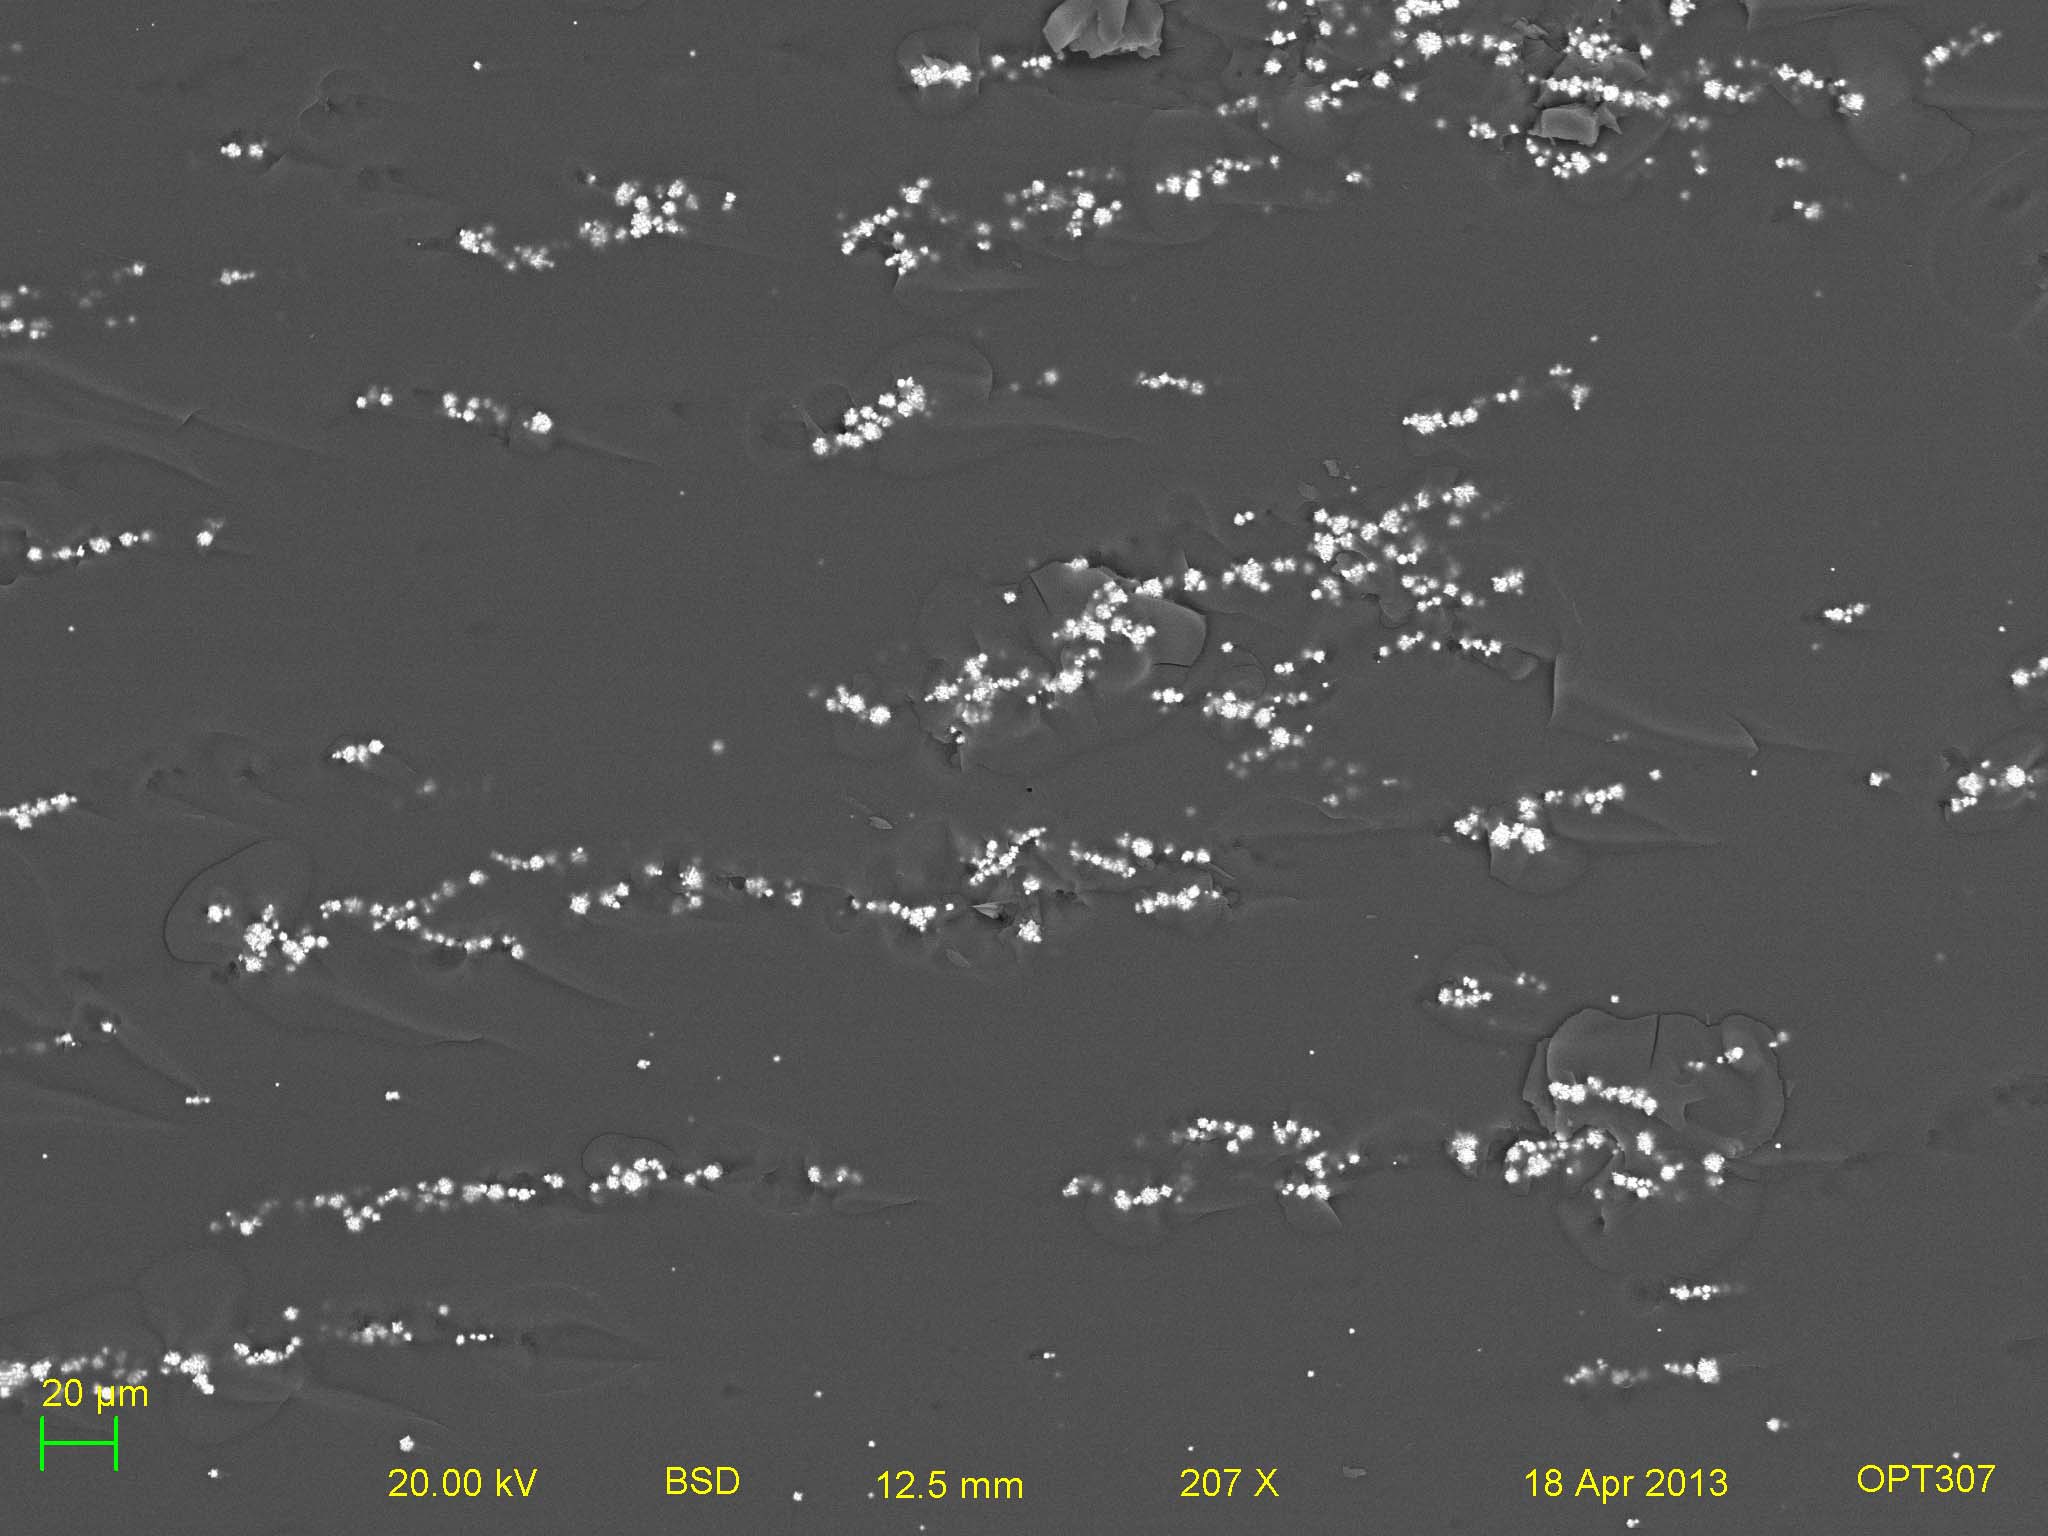
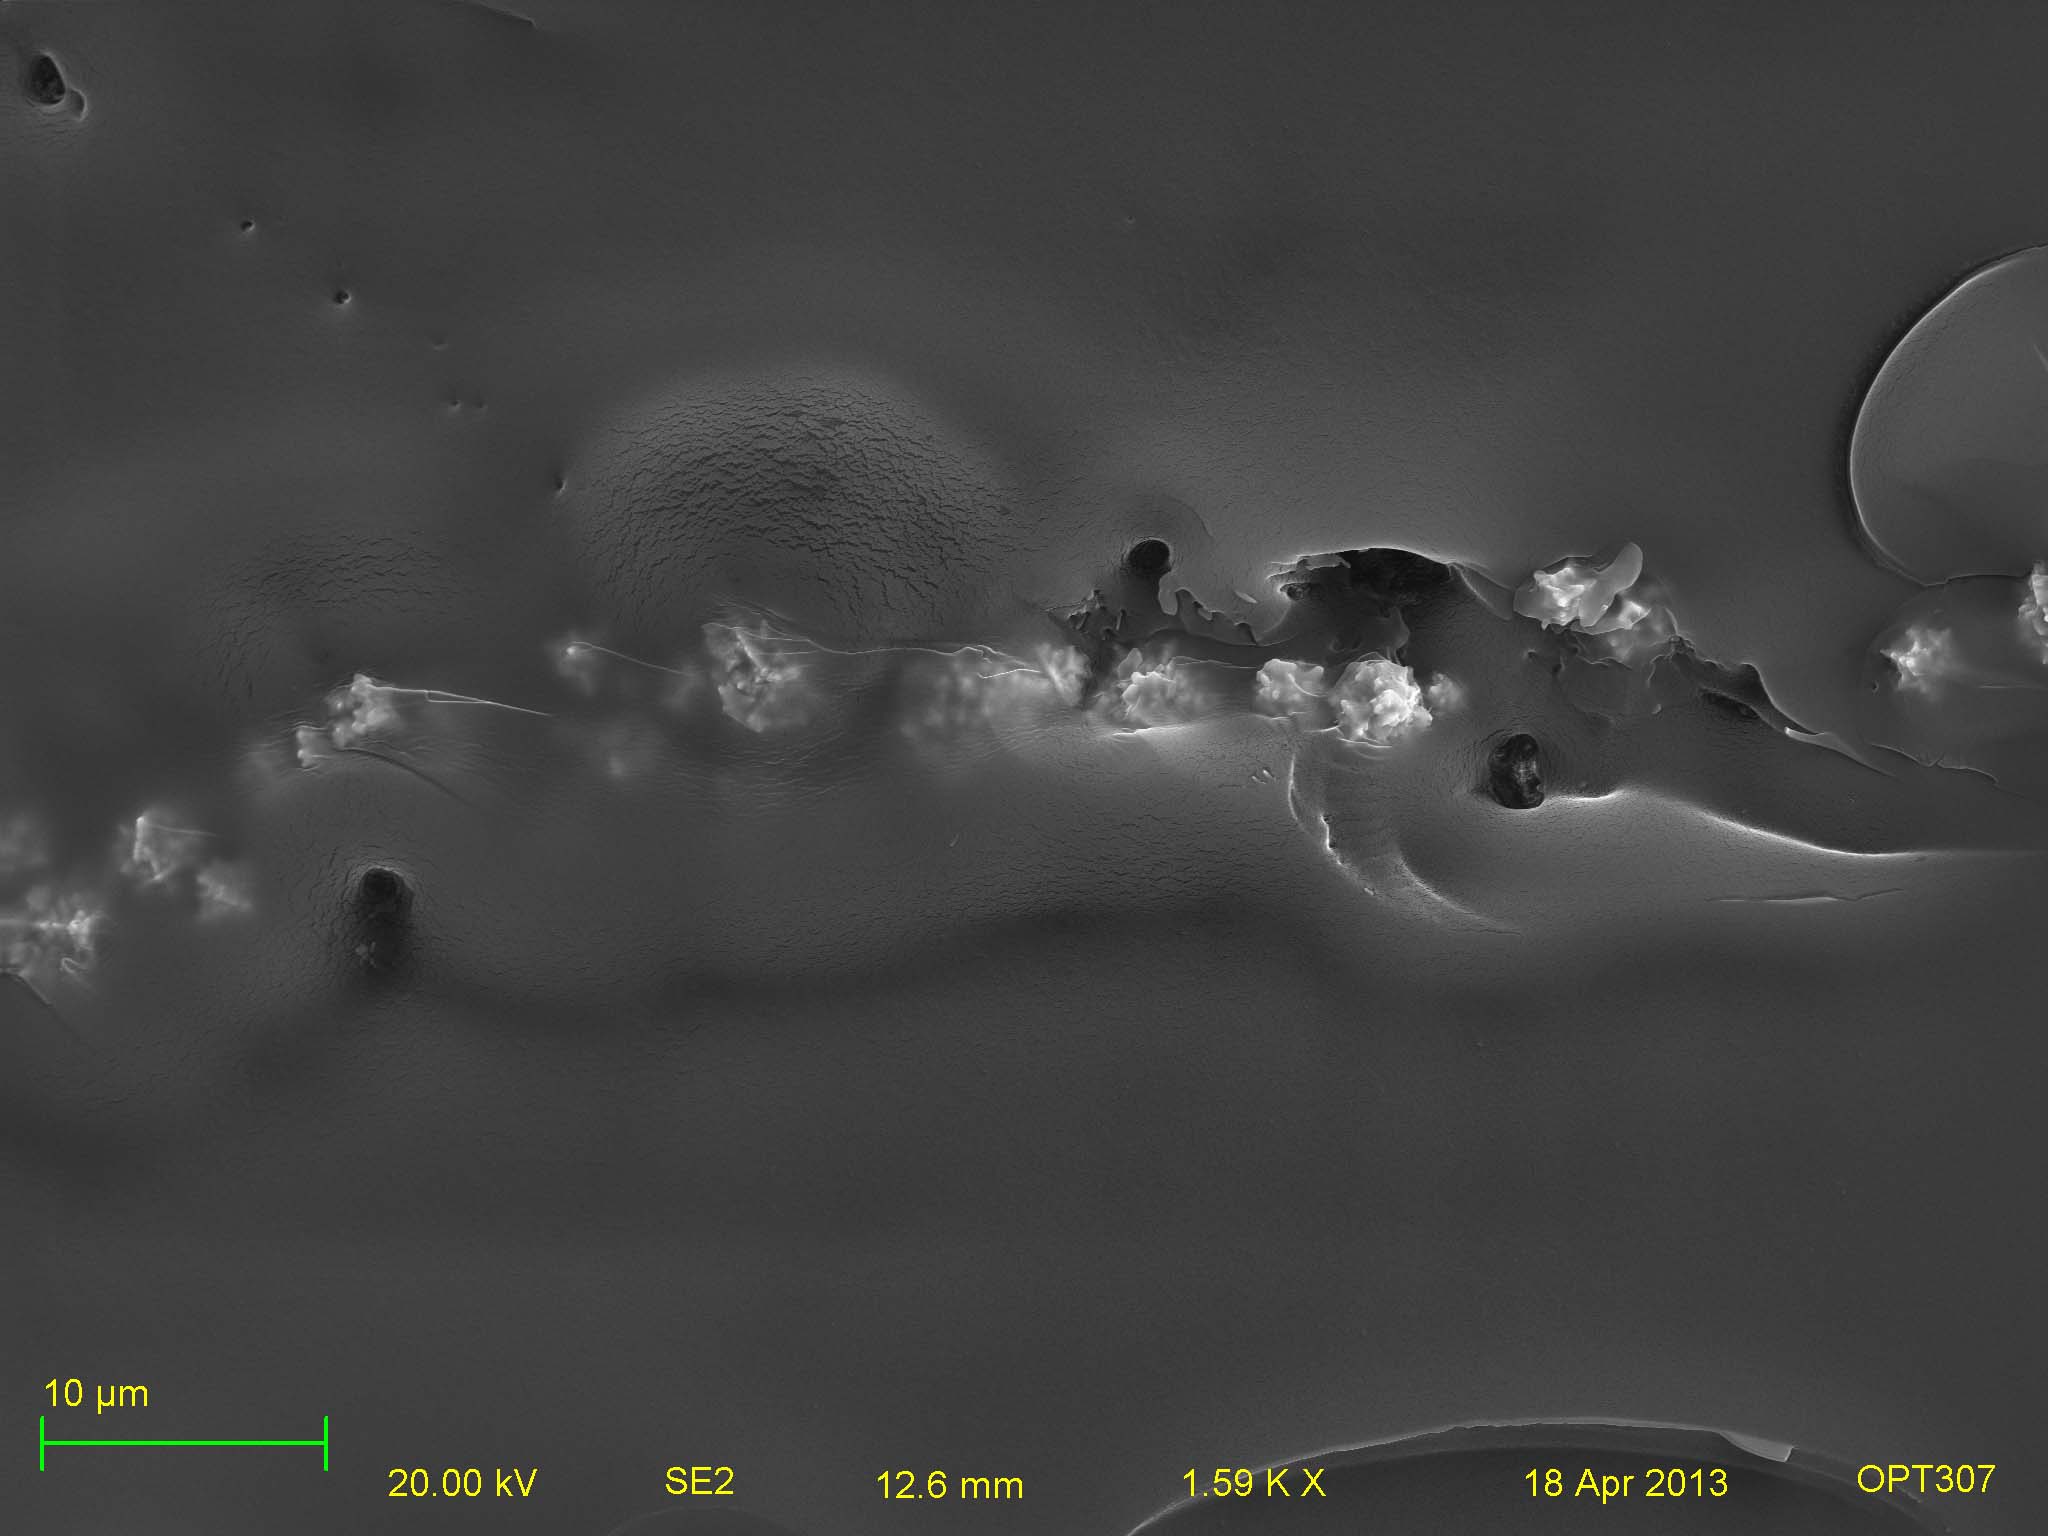
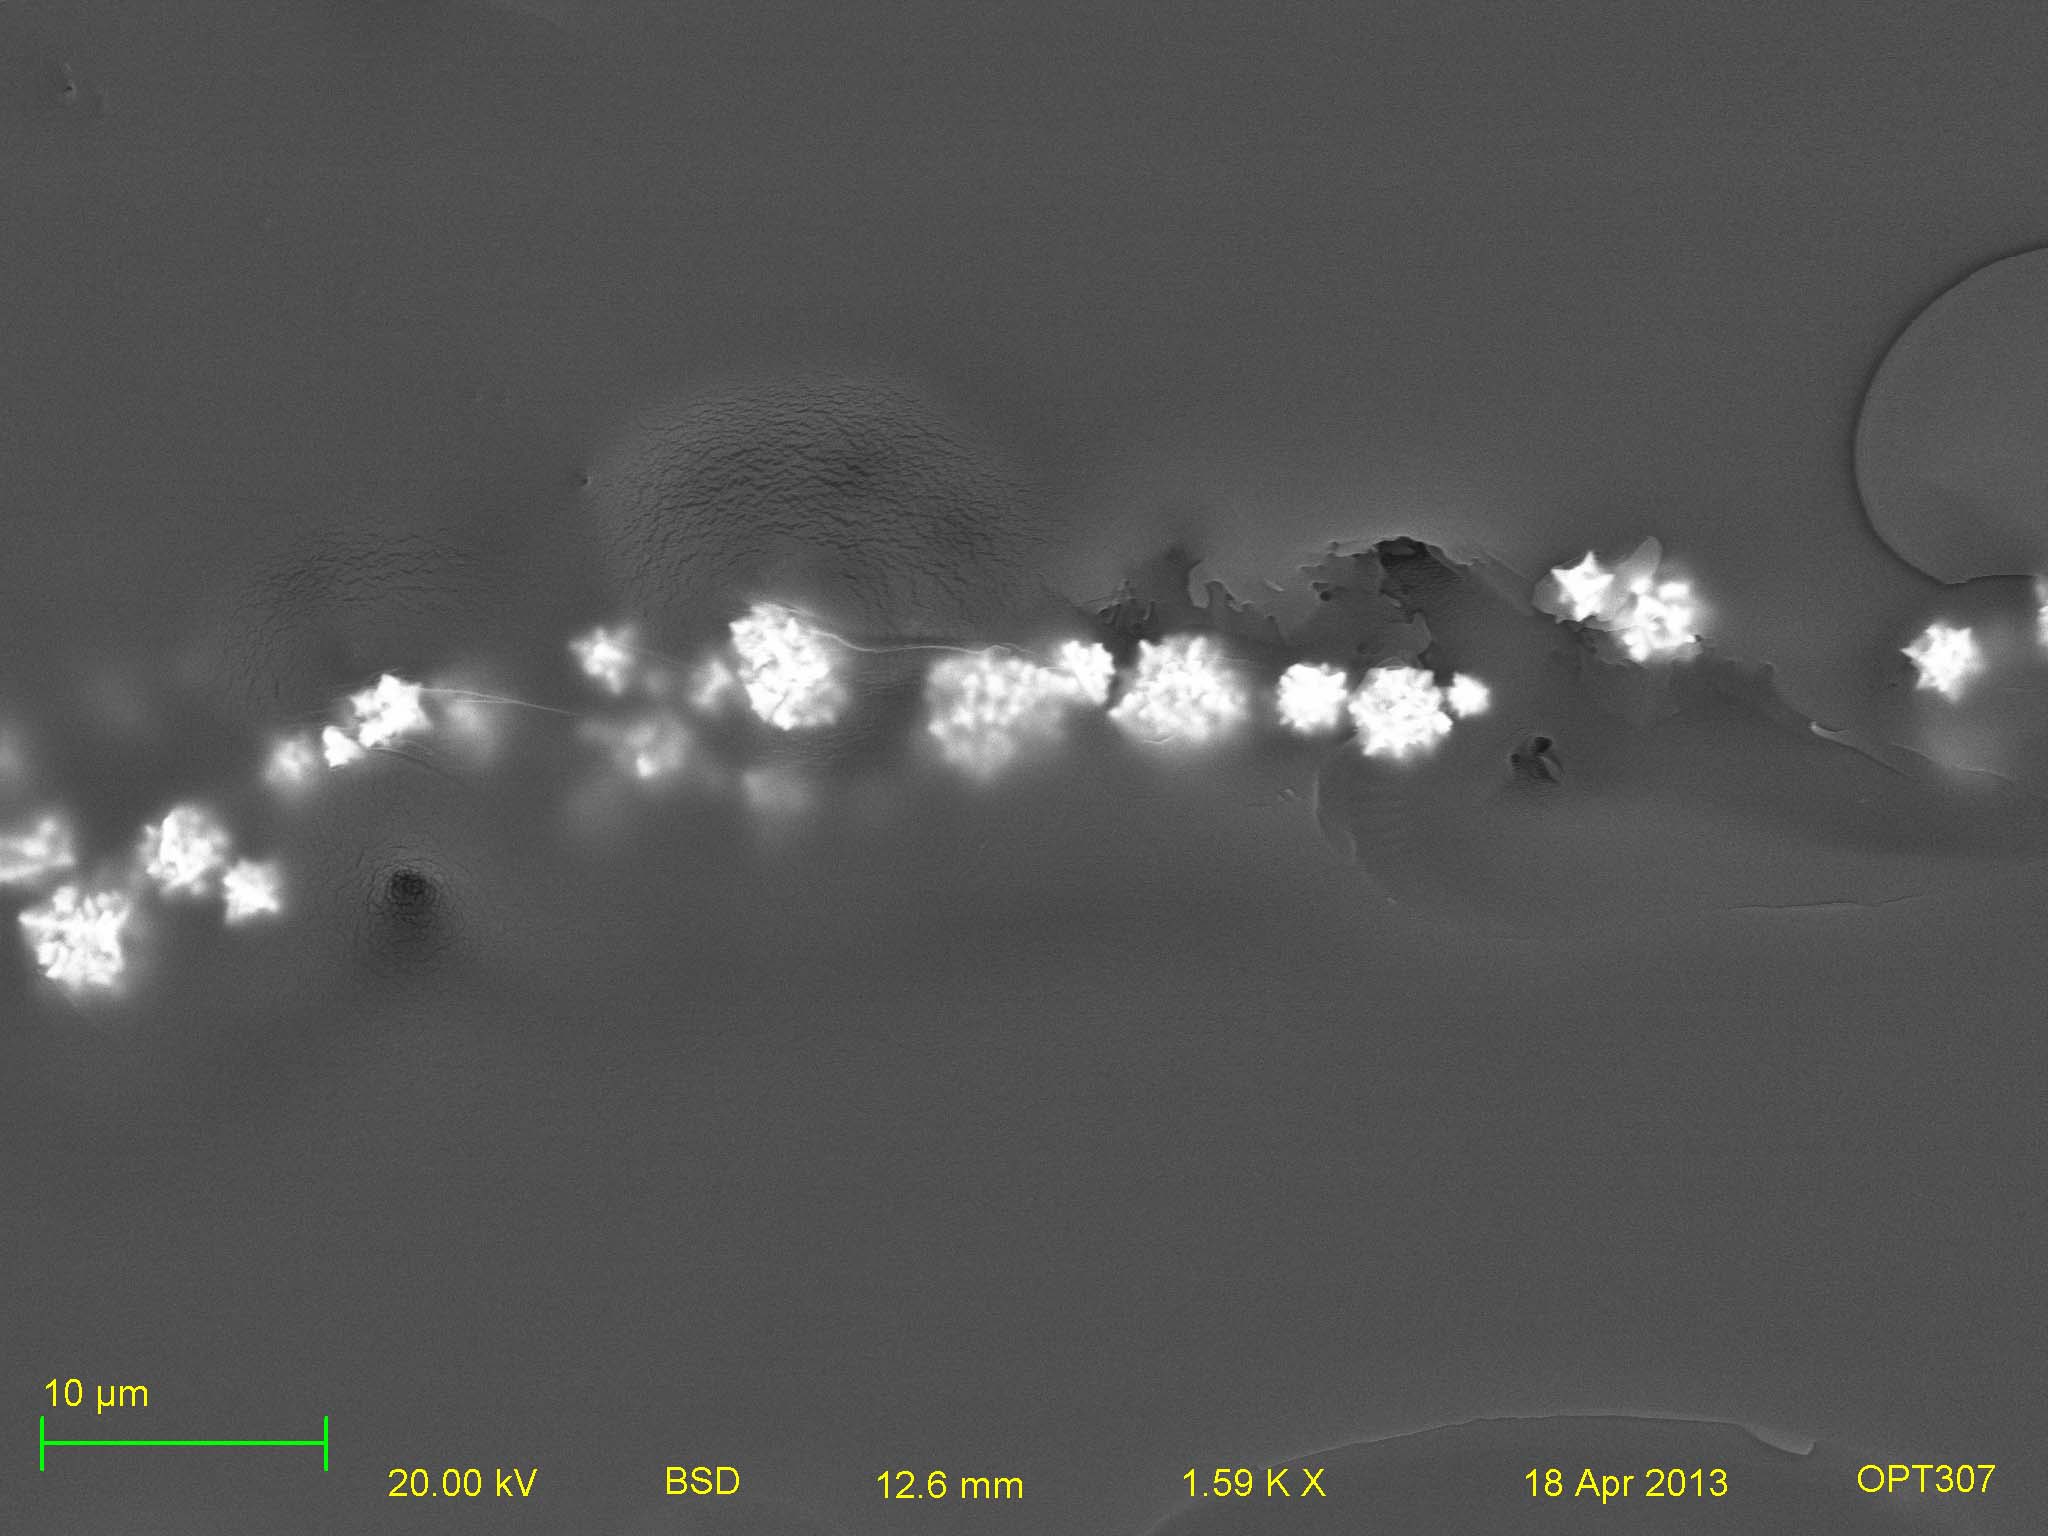
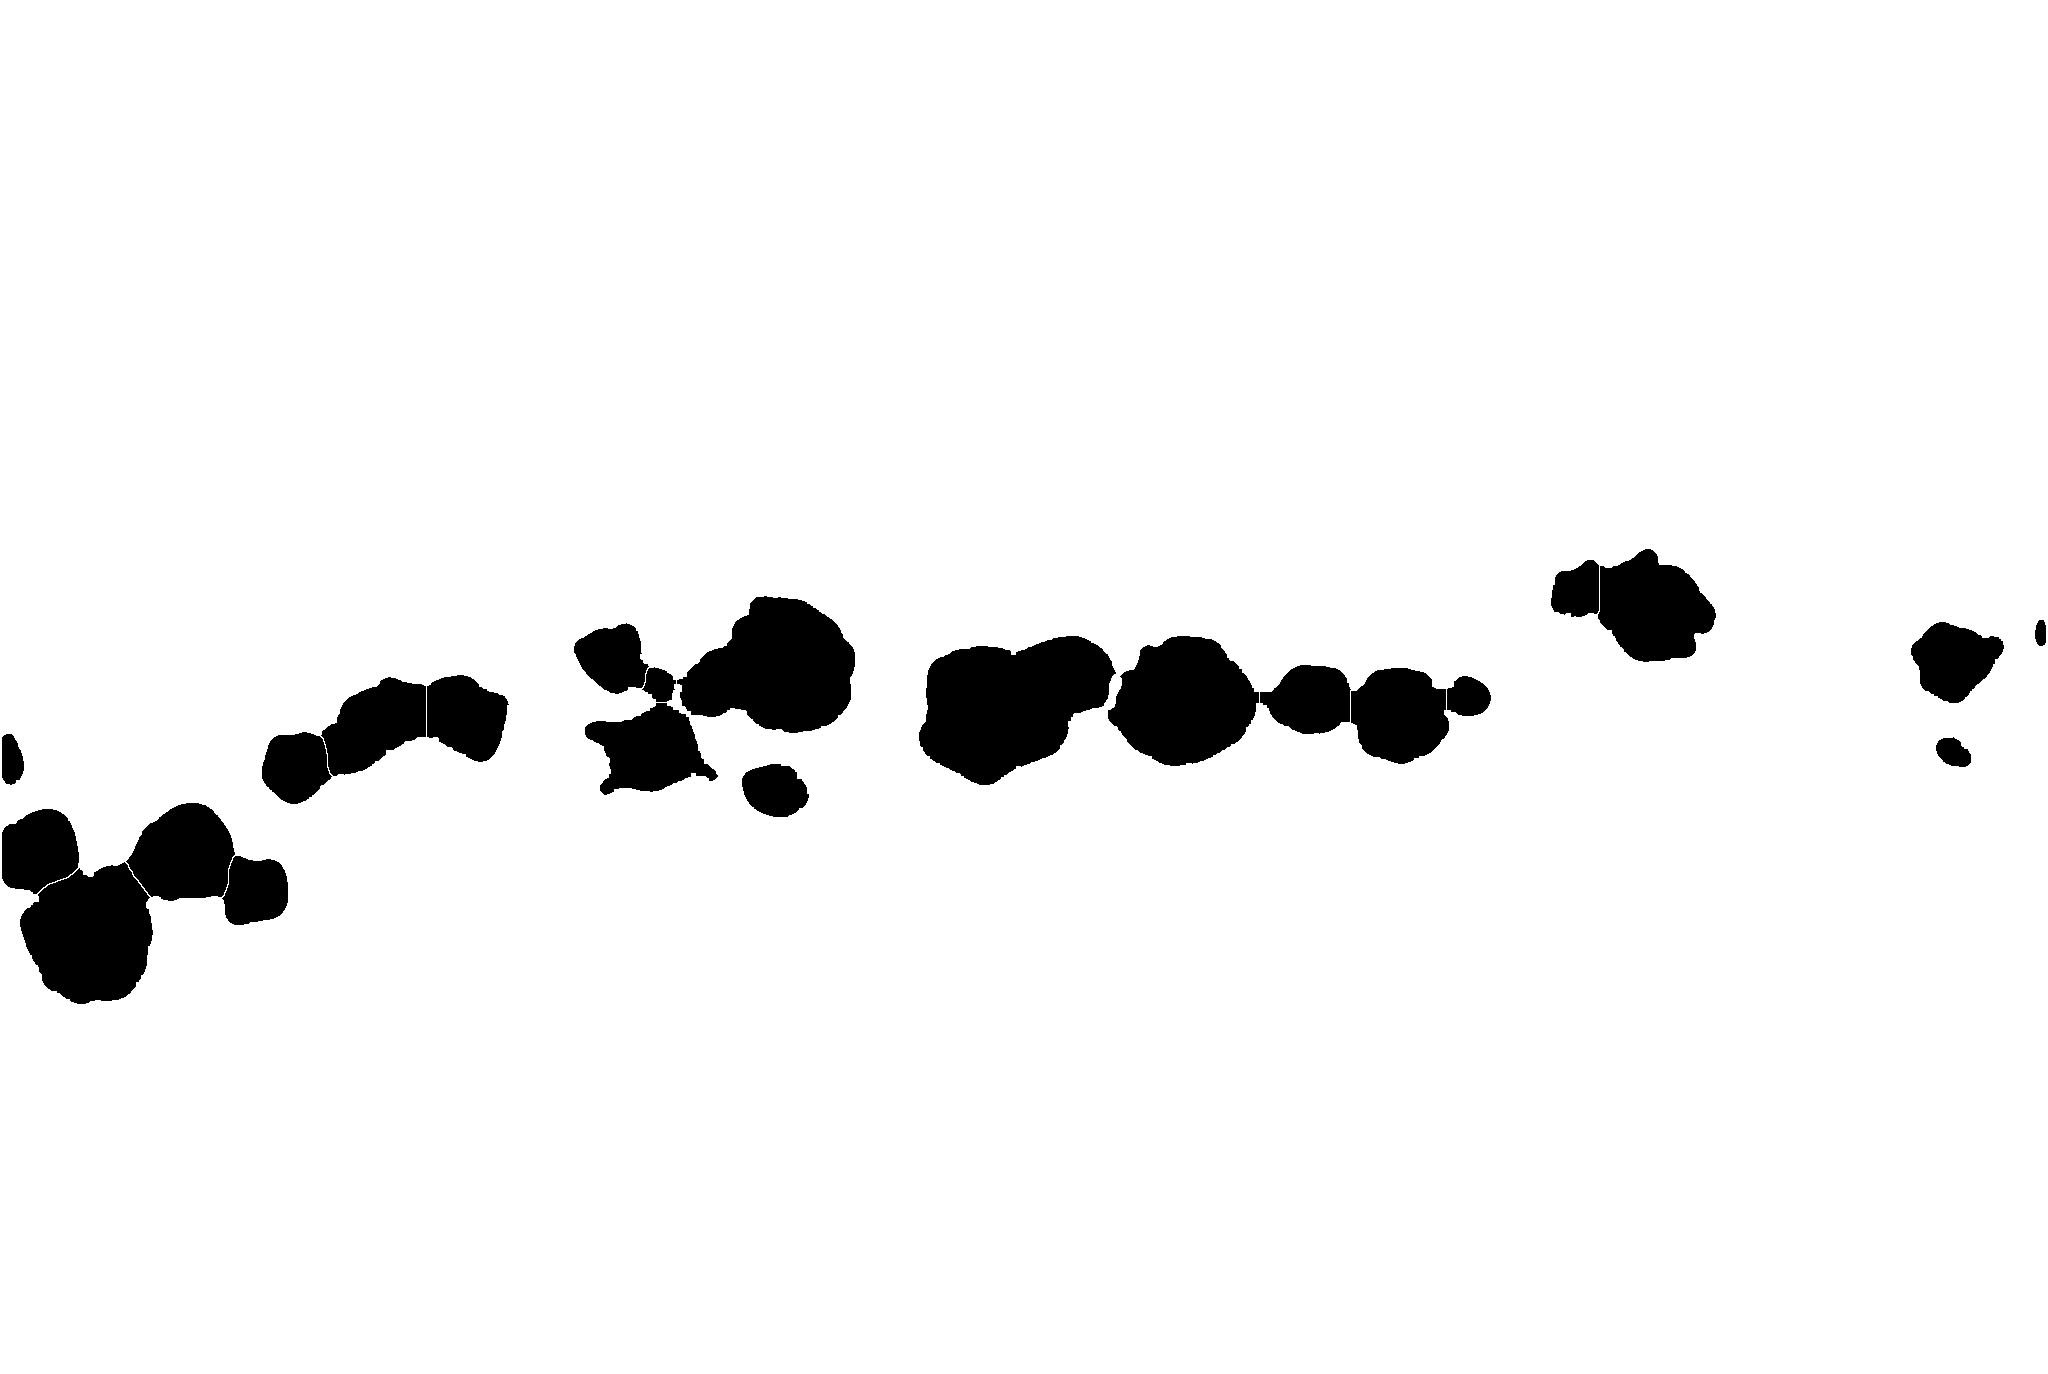
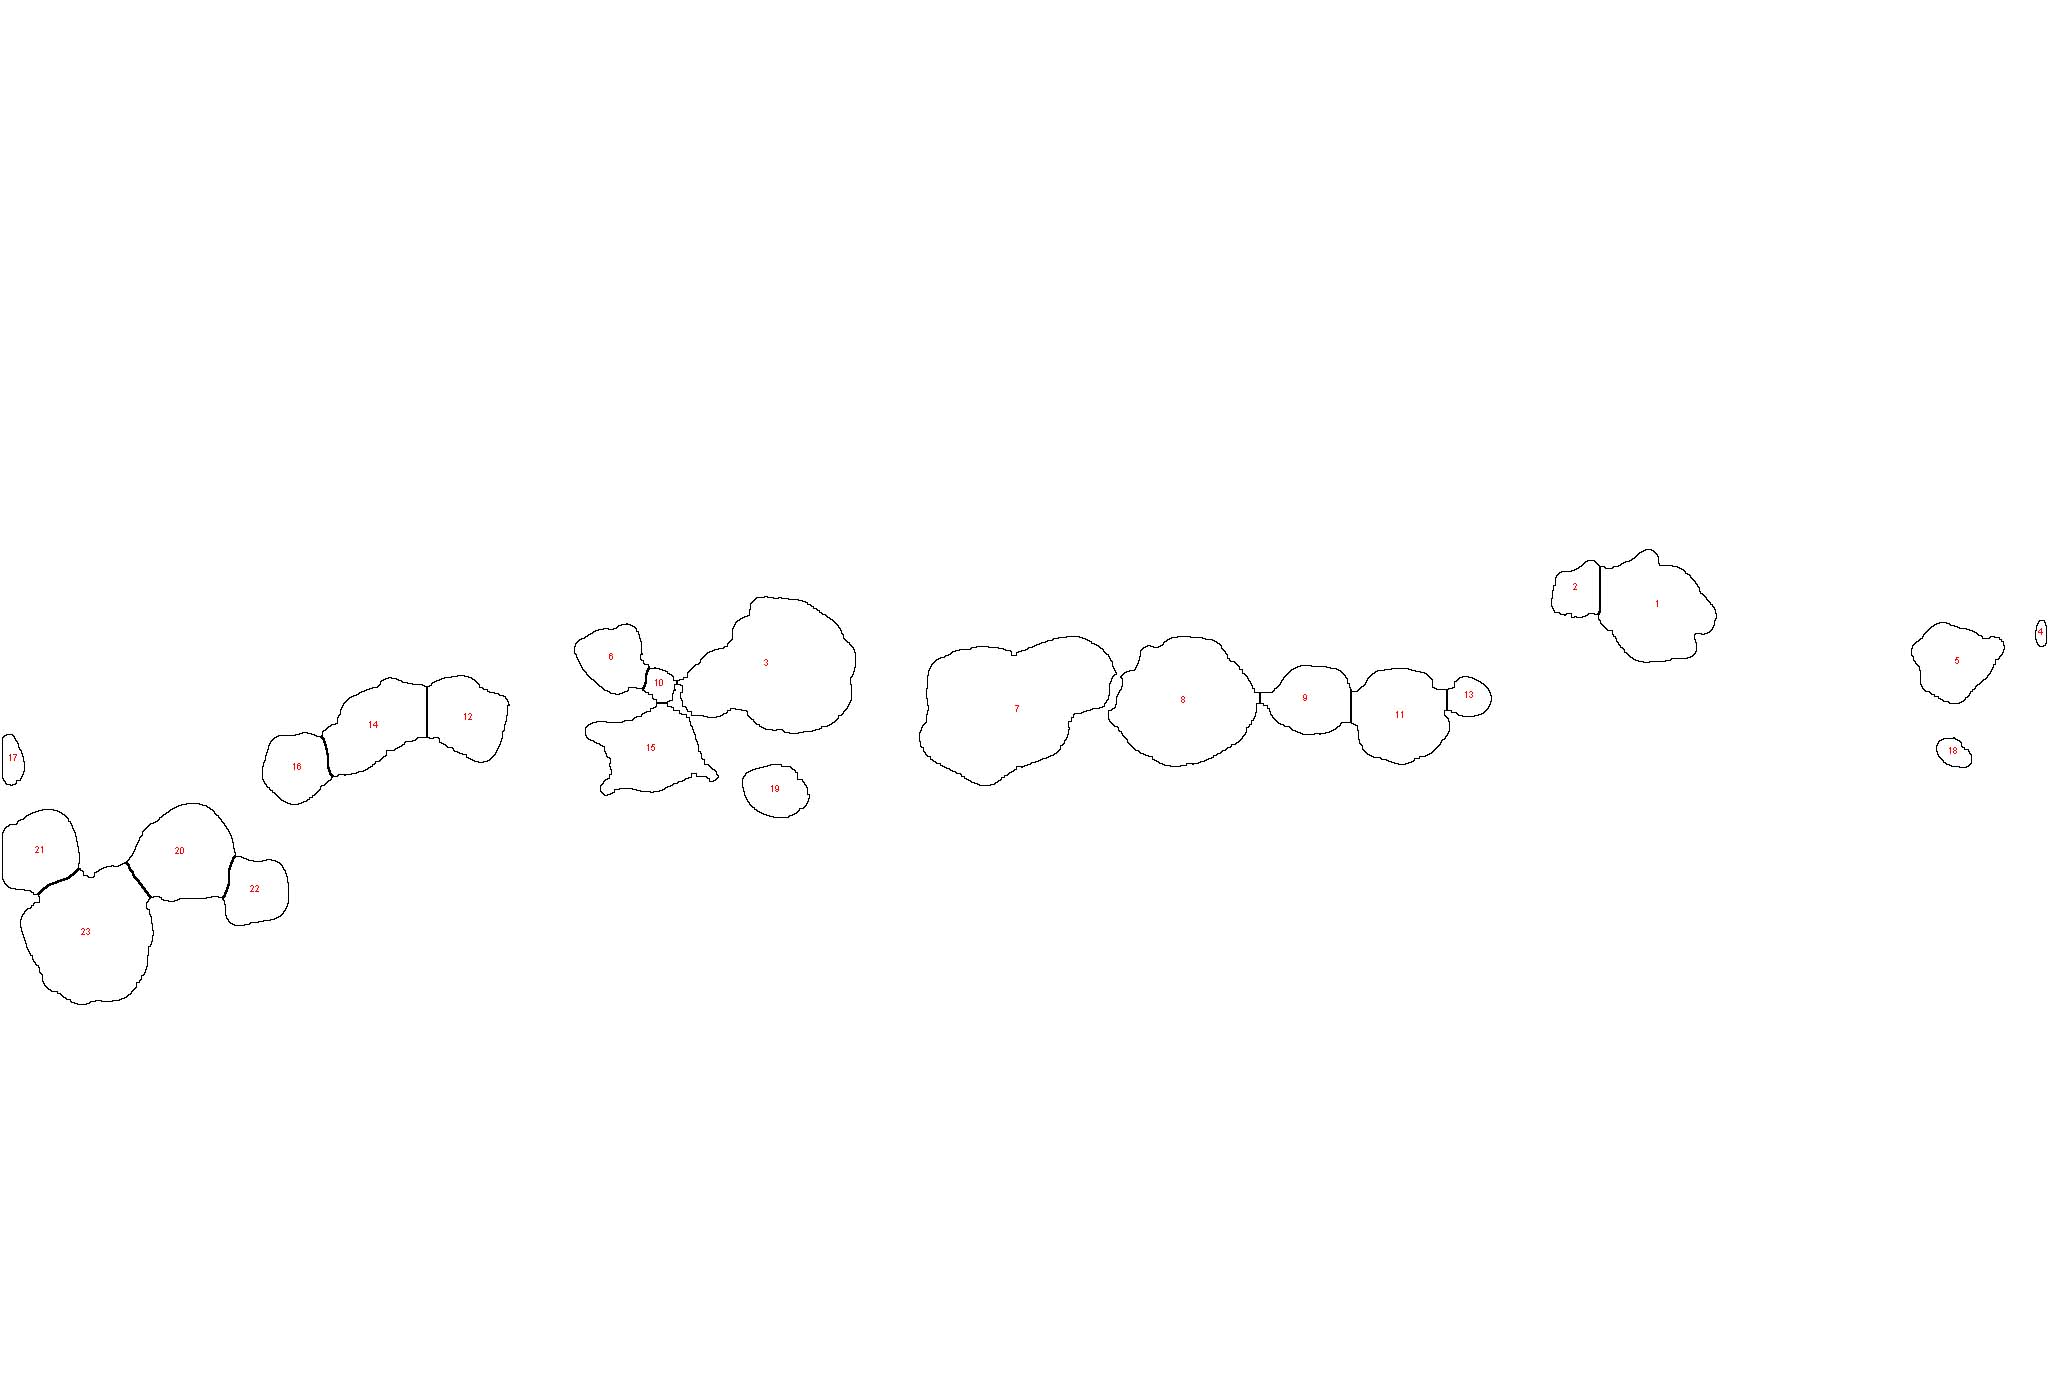
Figure 6: The images in the left hand column were taken with the SE2 lens, while the images in the right hand column were taken with the BSD, at 20kV, with magnifications of 30X, 100X, and 1.6kX respectively per row. The top-most row clearly shows the magnetic alignment in the sample, with the magnetic field lines stretching across the image from left to right. At higher magnifications this image set again highlights the ability to see underlying particles with the BSD that are otherwise lost with the SE2. ImageJ analysis of the bottom right image shows a particle count of 22 particles with an average size of 8.00 micrometers and a standard deviation of 6.57. The SE2 image on the bottom results in a count of 19 particles with an average size of 5.71 and a standard deviation of 5.31. As expected the BSD image produced results consistent with the manufacturer's proposed particle distribution range. The discrepancies between the two counts are resultant of the same issues discussed in Figure 5. A combination of techniques, such as erode, de-speckle, remove outliers (bright/dark), and watershed produced rough outlines matching the particles in the BSD and SE2 image, an example is shown bellow. Particles counted that were bellow 0.9 micrometers, and above 20 micrometers were manually excluded from the dataset. The average particle spacing for the image on the right was found to be 2.51 micrometers with a standard deviation of 2.19 by ImageJ analysis. The plane of this analysis was the most "forward" to the viewer.
Control Sample; side (z-x plane)
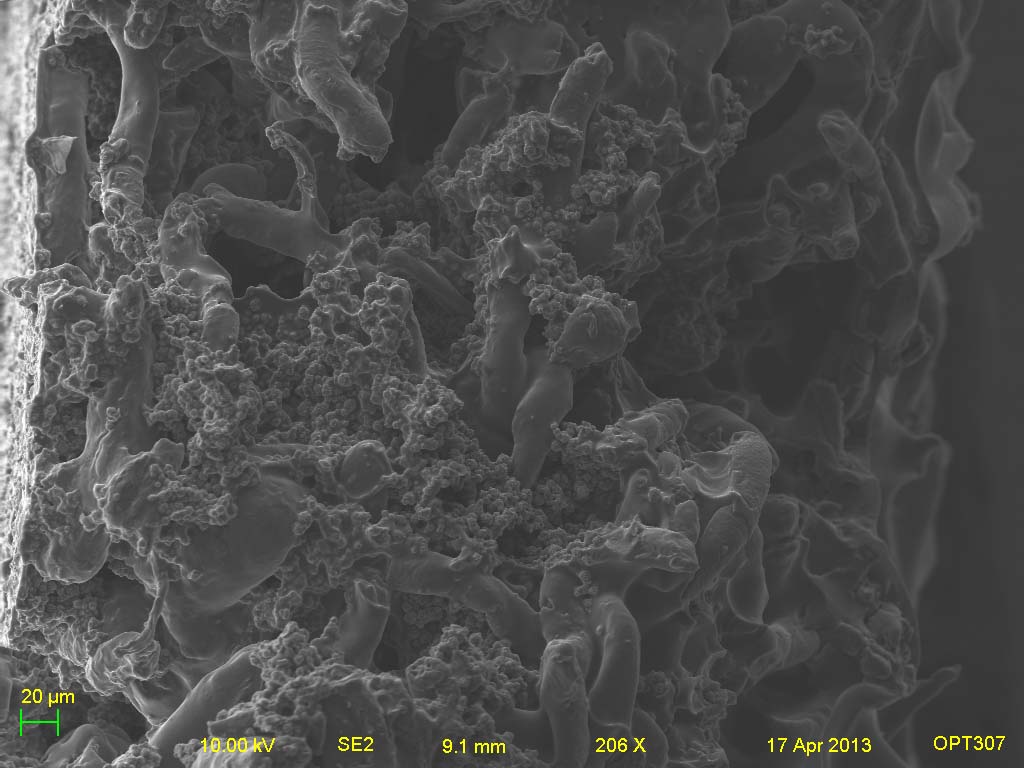
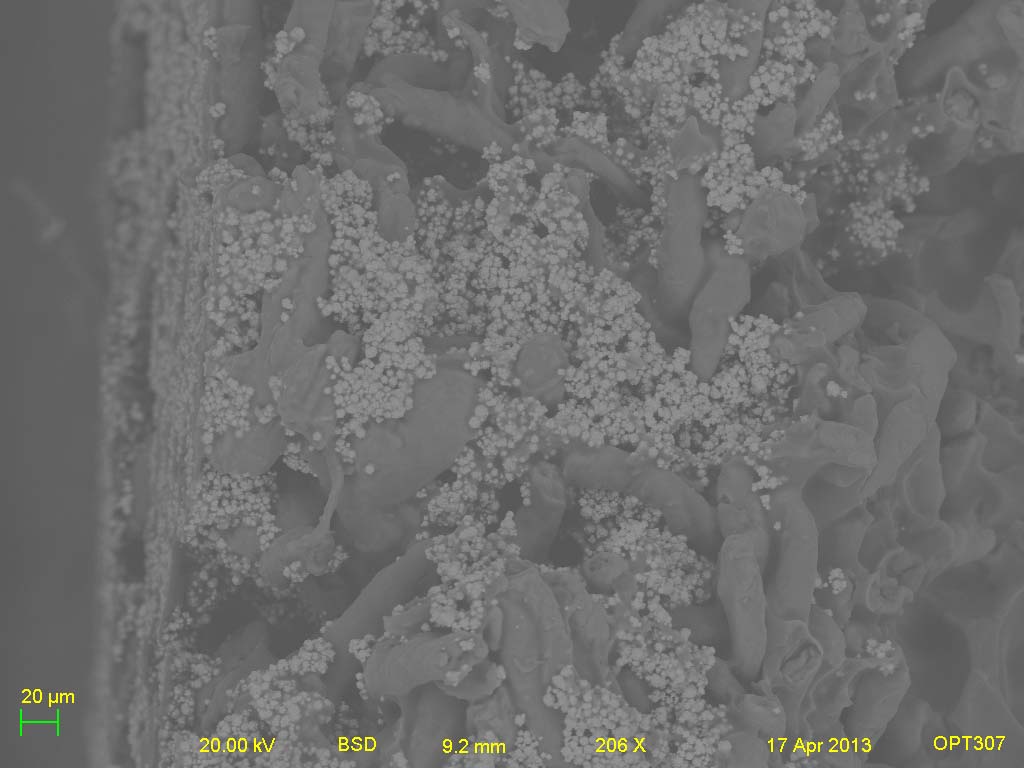
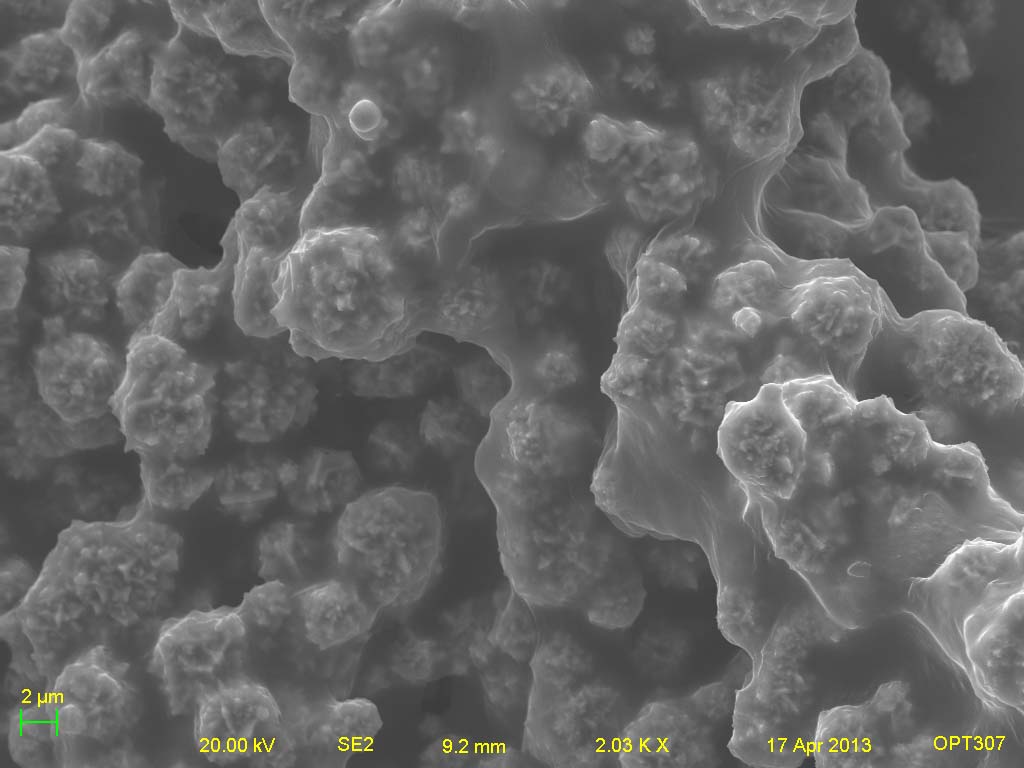
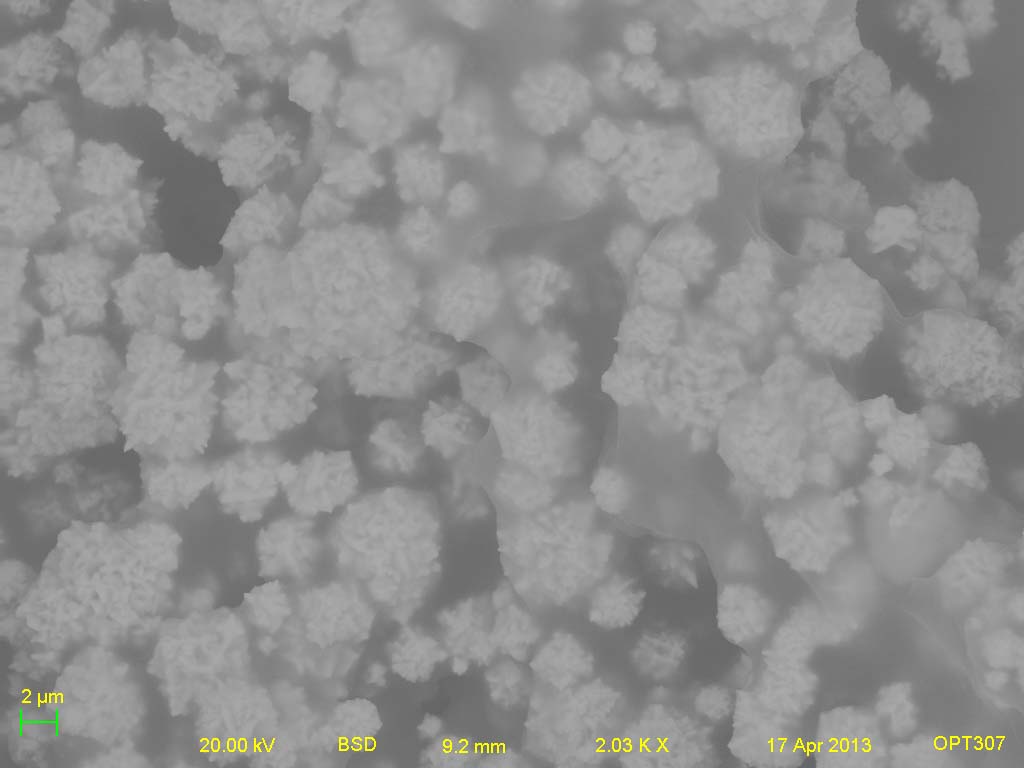
Figure 7: SE2 images left, BSD images right, mags. of 200X, and 2kX, at 20kV. As with Figure 3 these images show that these is no apparent ordering to the micro-particles for the control. It also highlight again the increased delineation of the particles with the BSD.
Electro magnet aligned sample; side (z-x plane)
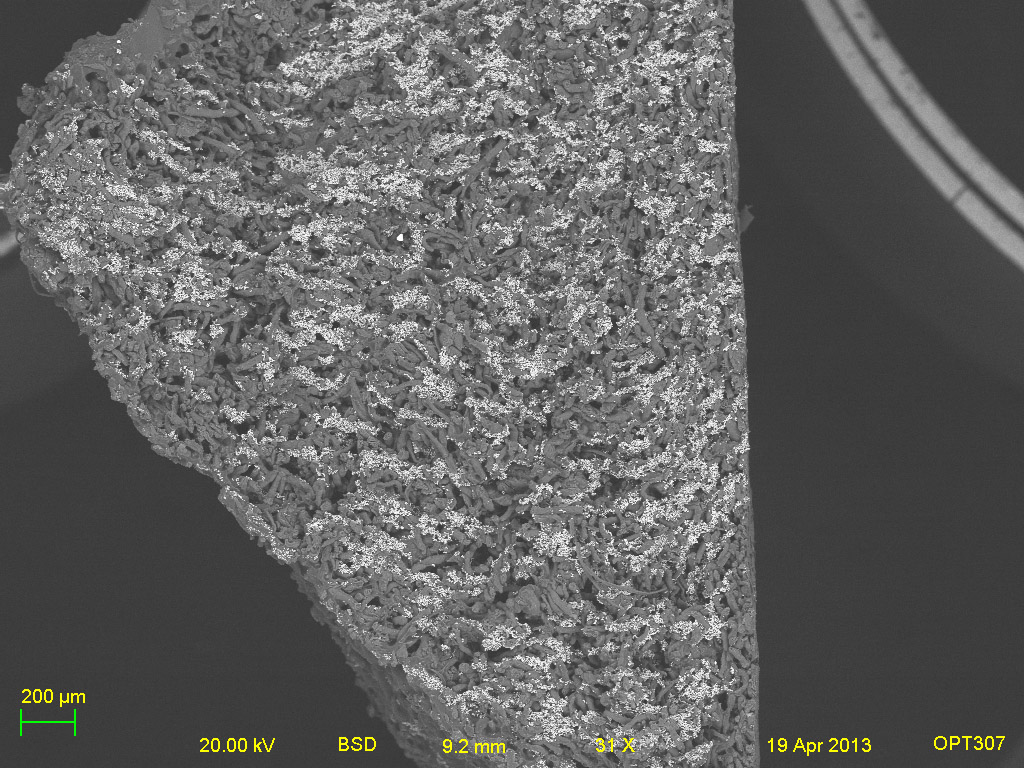

Figure 8: These two images are of the same sample in two different location taken with the BSD at 20kV, mag. 30x. These images clearly show alignment of the nickel particles in the field. It should be noted that the left hand image sample section was closest to the electromagnet pole piece. The field lines in this image roughly span from left to right.
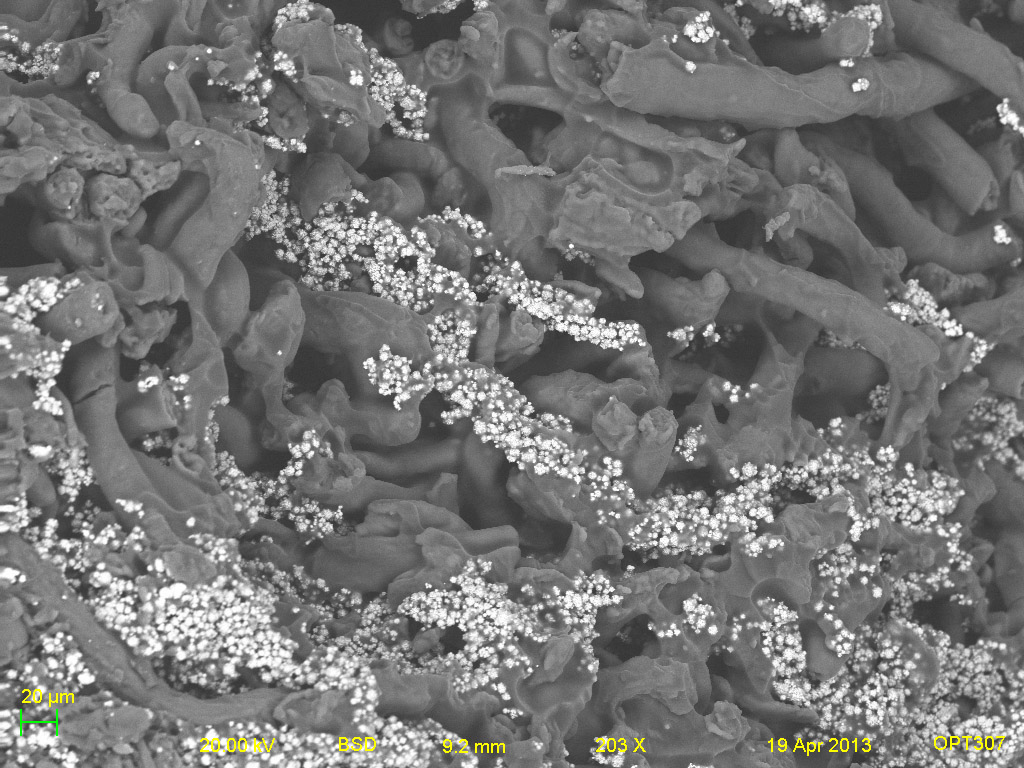
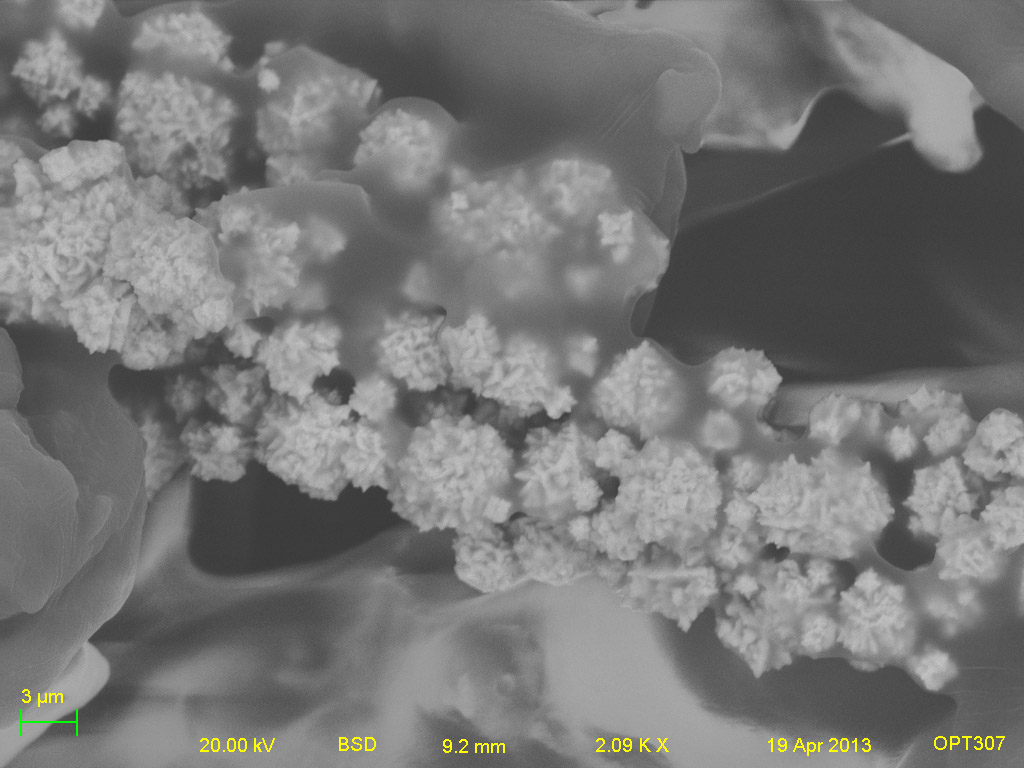
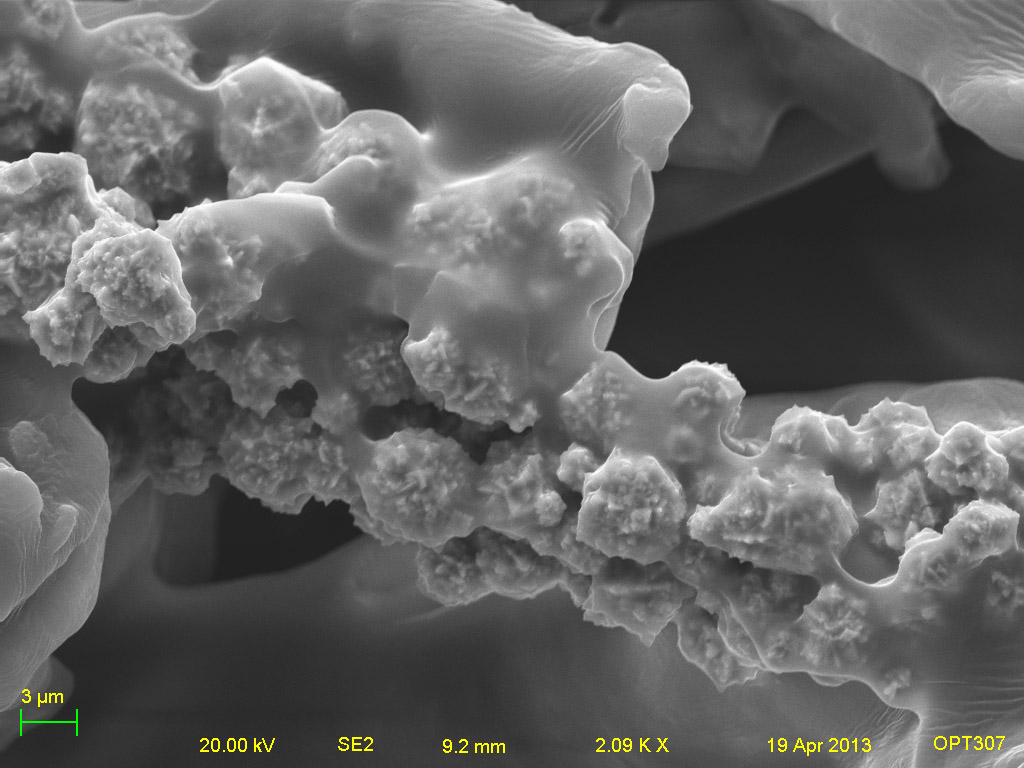
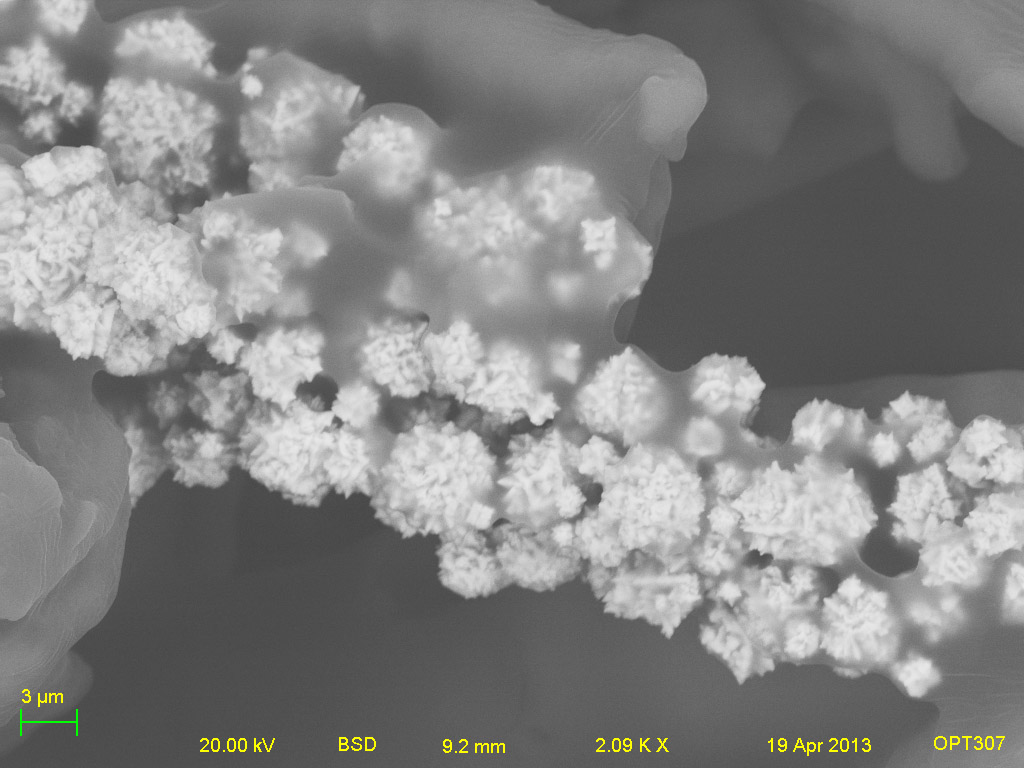
Figure 9: The top and bottom right images were taken with the BSD, while the bottom left was with the SE2. The upper right image is the a mix between the SE2 and BSD. These images clearly show the "columnar" formation of the nickel micro particles in the binder. It is thought that the large tubular protrusions surrounding the nickel particle columns are complexes between the CMC and SBR. Again the two 2kX mag. images highlight the utility of the BSD in this application over the SE2.
EDS analysis and ZAF correction results:
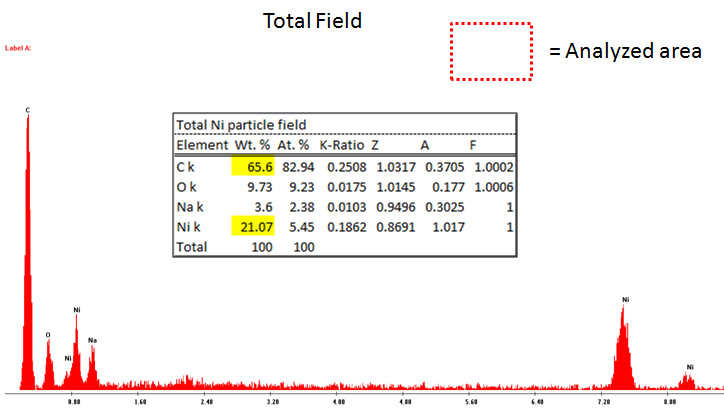
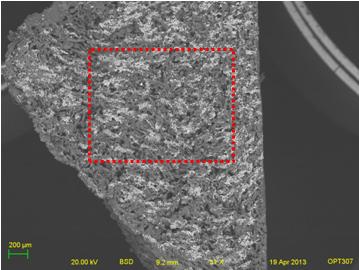
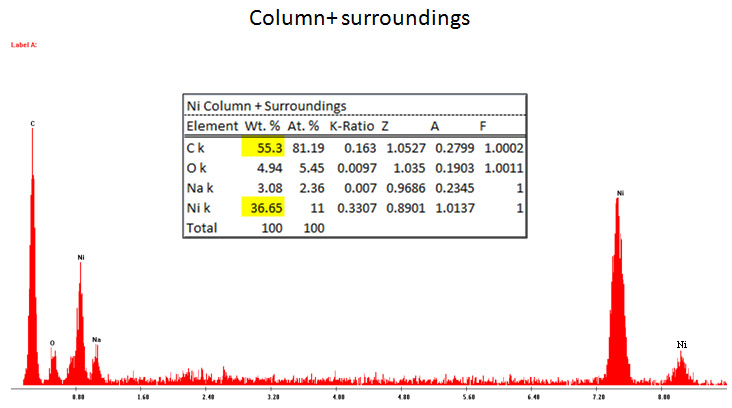
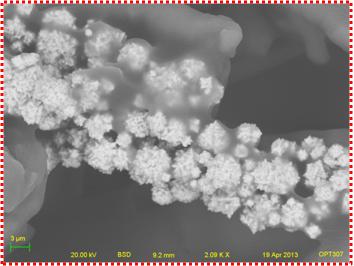
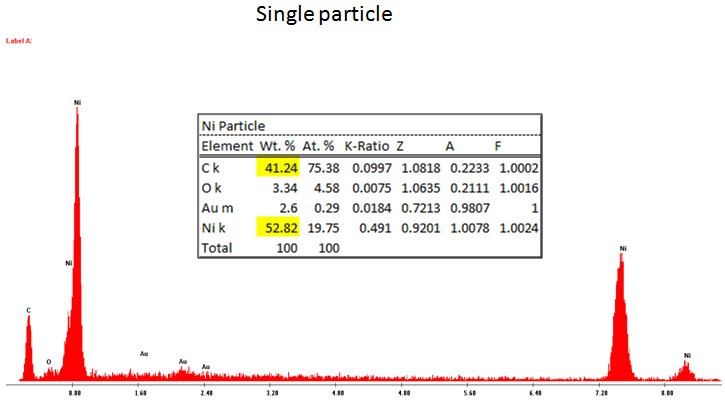
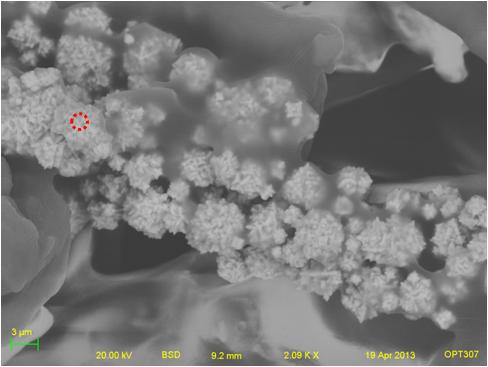
Figure 10: The spectral analysis results were from EDS data collected using a 20kV accelerating voltage. The "total field" image shows a ratio of ~1:3 of nickel to carbon, that is dissimilar form the 1:2 formulation of particle to binder described in the sample prep section above. This discrepancy is likely due to a "clustering" effect of the nickel particles along field lines, where the interaction volume might not be deep enough to generate a more accurate picture of the true weight percent ratio. It should be noted that as the magnification increased and region of spectral mapping that a signal was generated from decreased (see the sections outlined in dotted red), more of the nickel particle spectrum overwhelms the spectral output. It should also be noted that the gold peaks that appear in the spectrum are from the gold sputtering done in sample prep.
Spectral mapping results:
Electromagnet aligned sample; 30 kV accelerating voltage
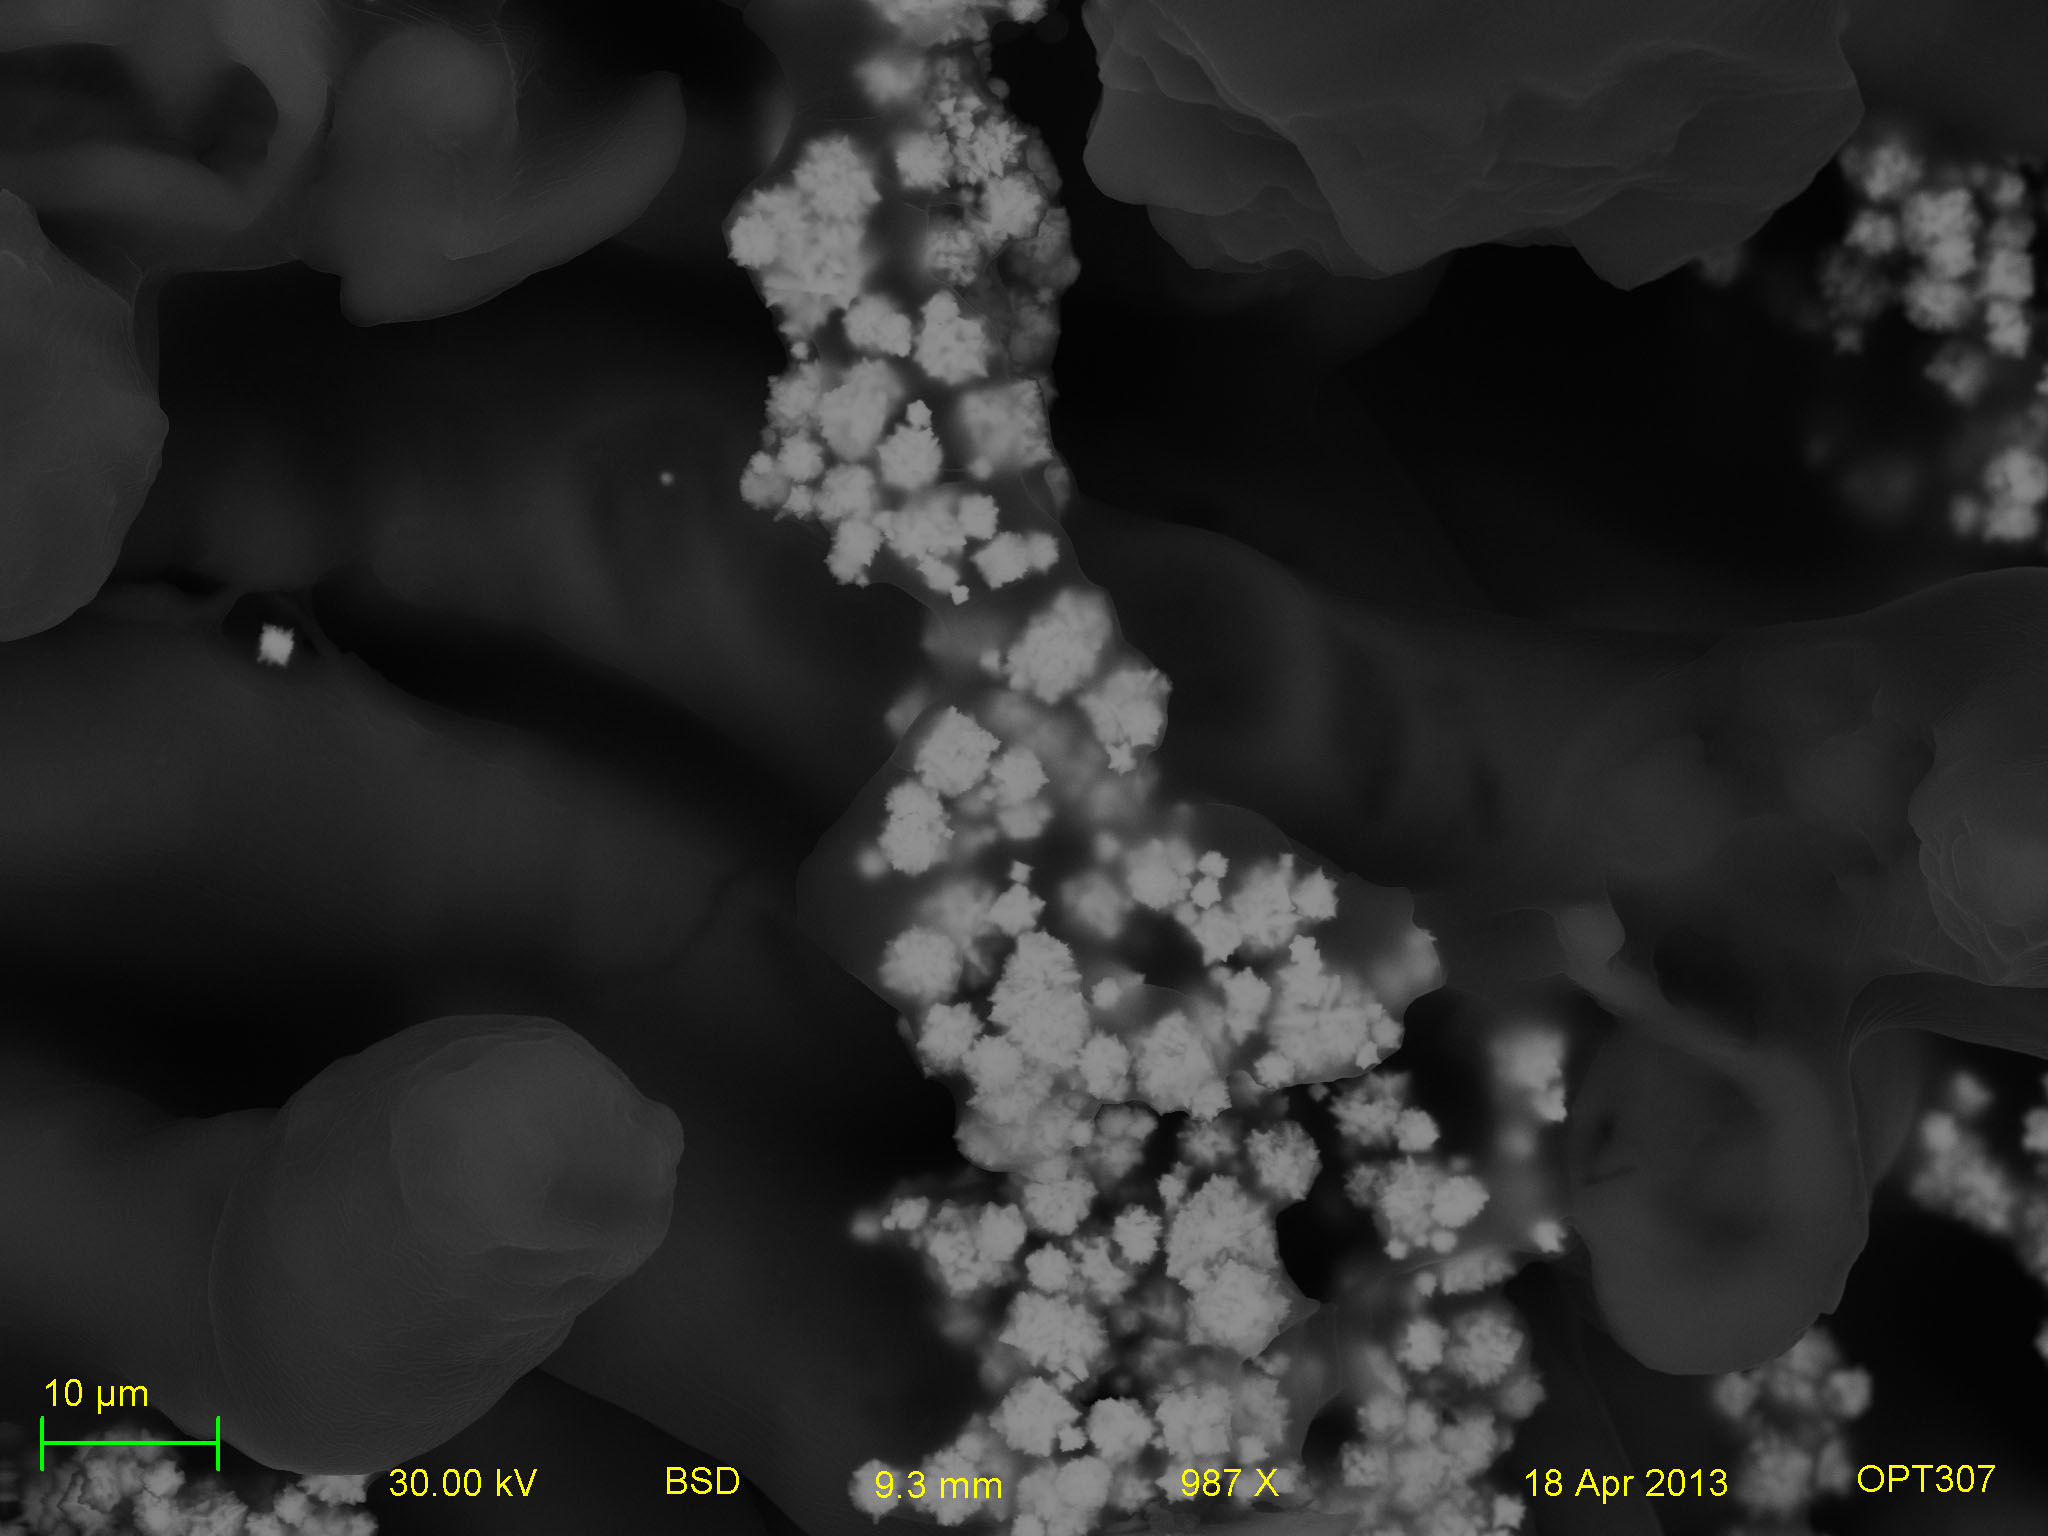
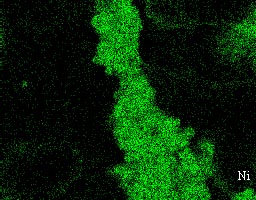
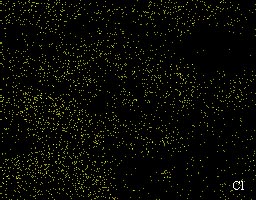
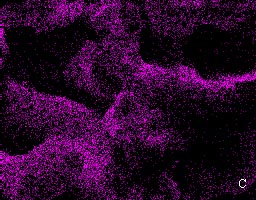
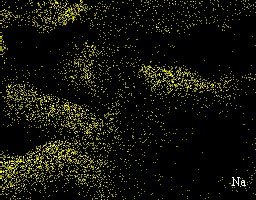
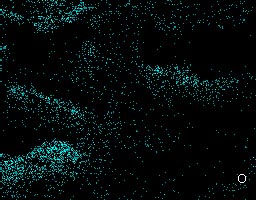
Figure 11: The spectral map of the example image (upper right) at 20kV demonstrates the depth of penetration that this high accelerating voltage has on the profiling of the embedded nickel particles, clearly showing the columnar formation of the particles from magnetization. These images show that the binder is mostly composed of carbon, with trace amounts of salts.
Electromagnet aligned sample; 15 kV accelerating voltage
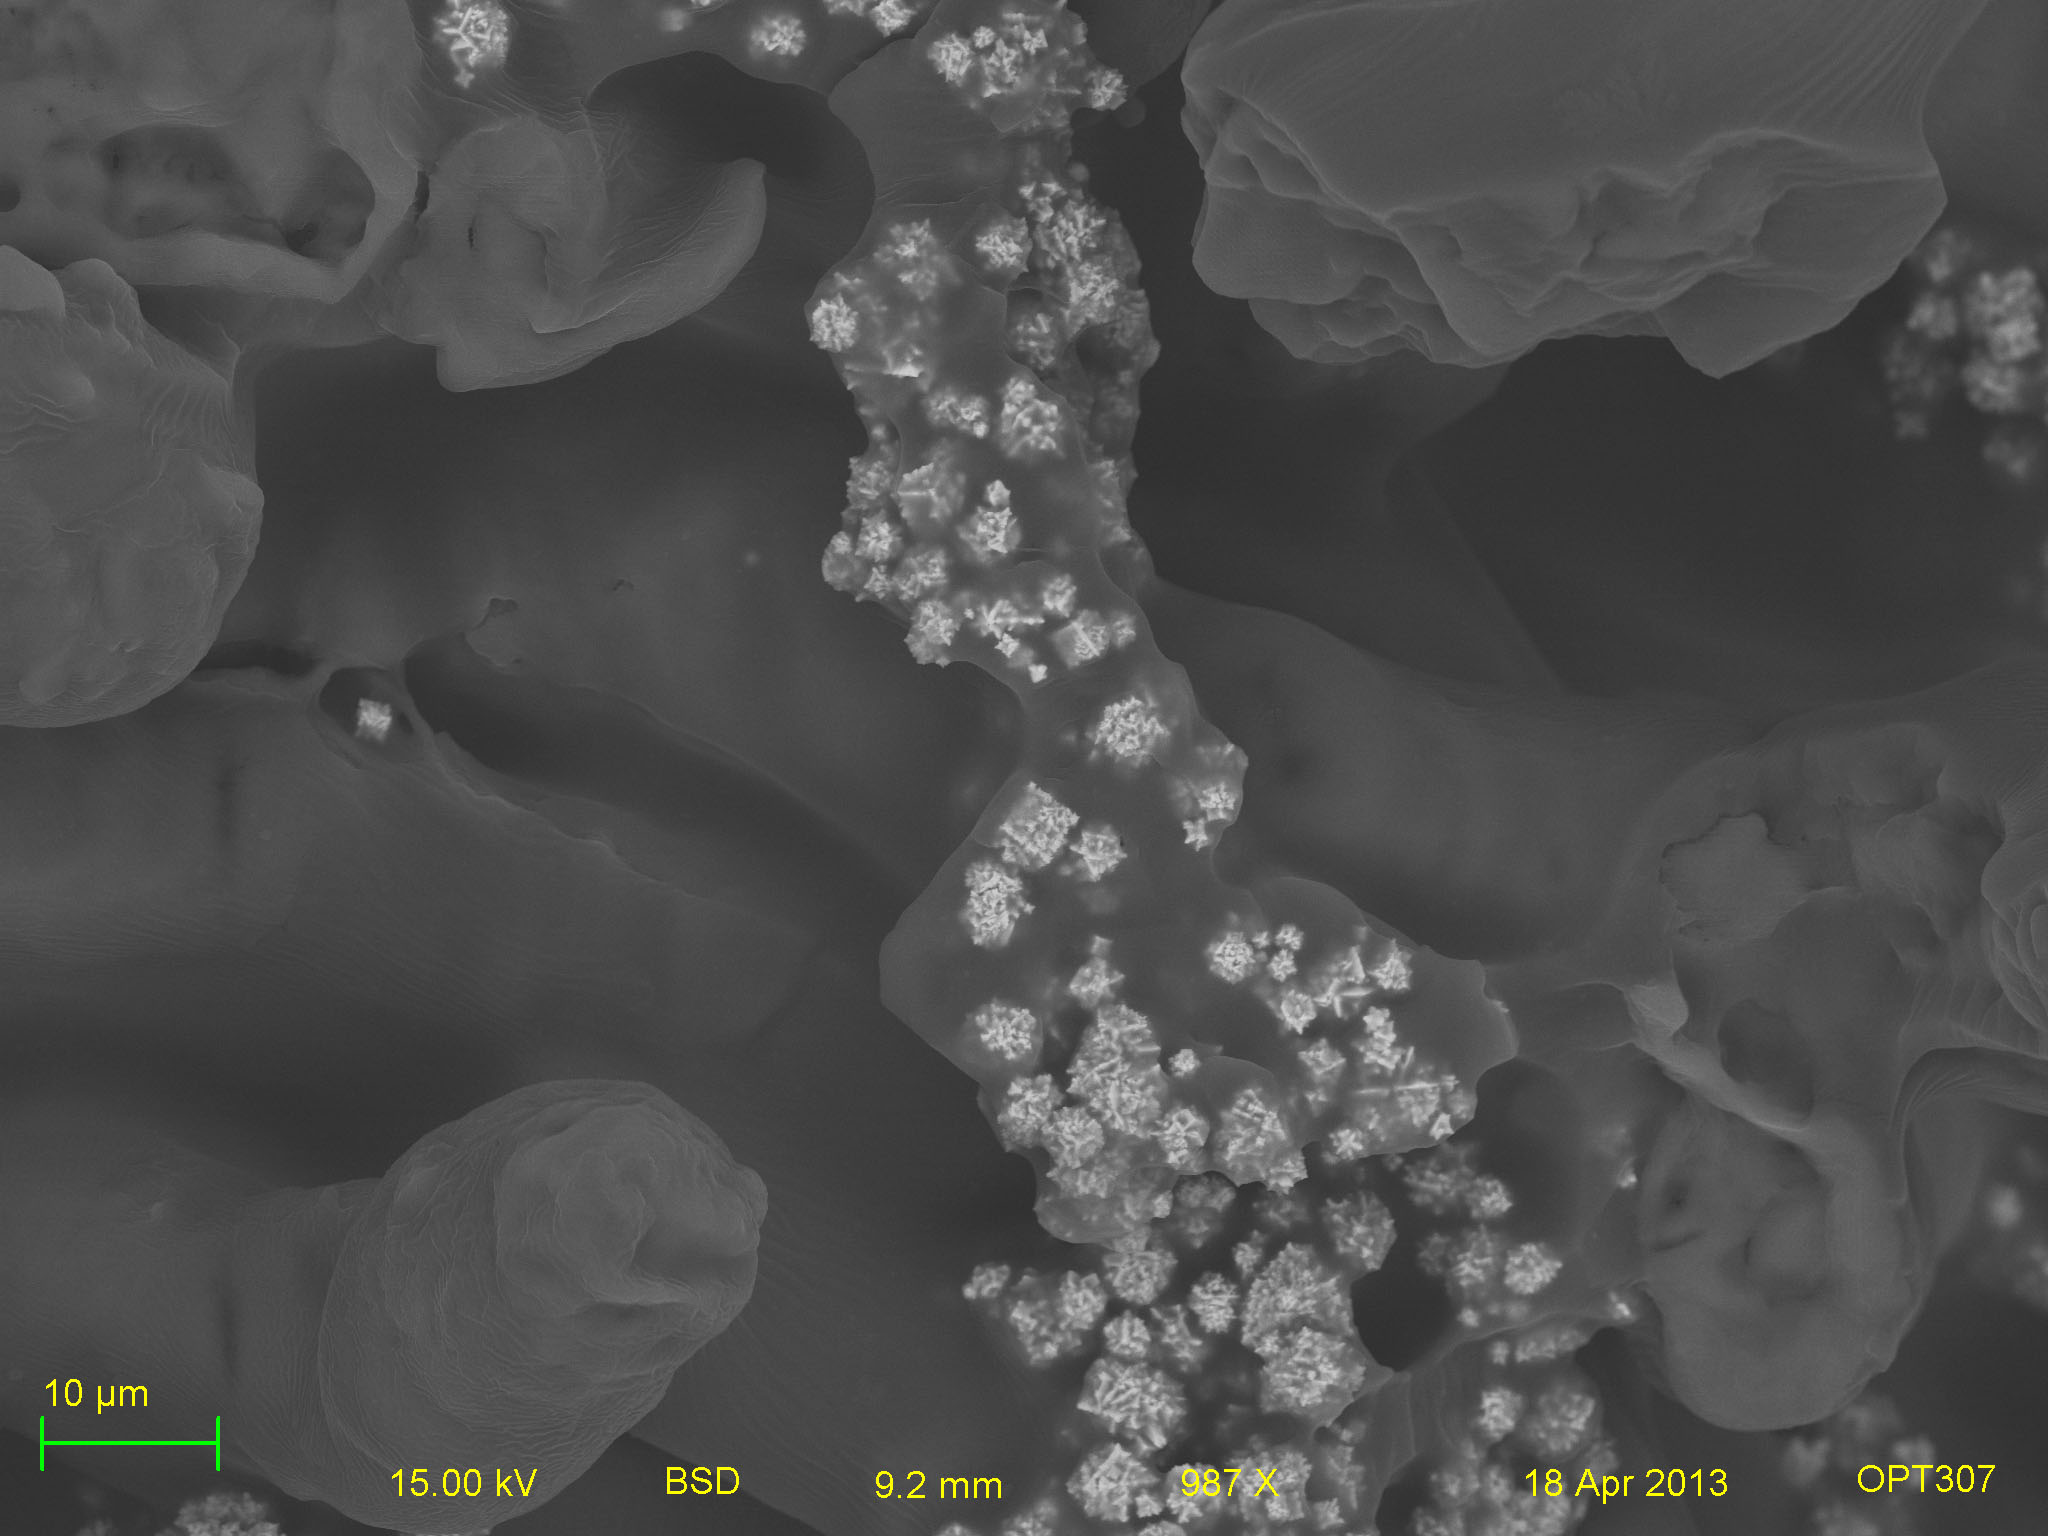
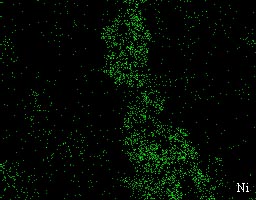
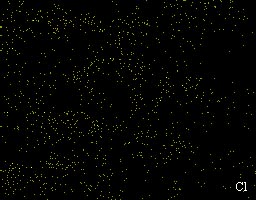
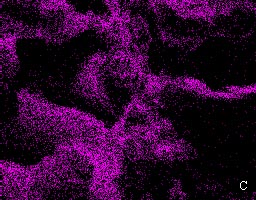
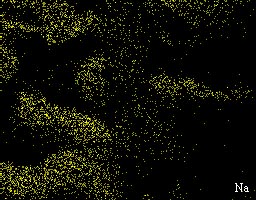
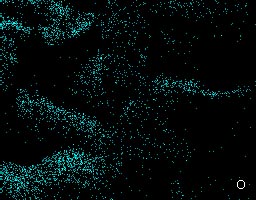
Figure 12: The spectral mapping results for 15 kV detect much less of the embedded nickel micro-particles due to the decreased interaction volume. Again these images show that the binder is primarily composed of carbon with some residual salts, where-as the nickel is well segregated. Interestingly, one is able to gain a more delineated picture of the individual nickel particles being mapped, again due to the reduced interaction volume exciting less atoms, and therefore the particle do not blur together as much. Noting the relative intensity difference between the carbon components and that of the sodium, it is possible that the "core" of the tubes illustrated above has a primary salt component, surrounded by a carbon sheath.
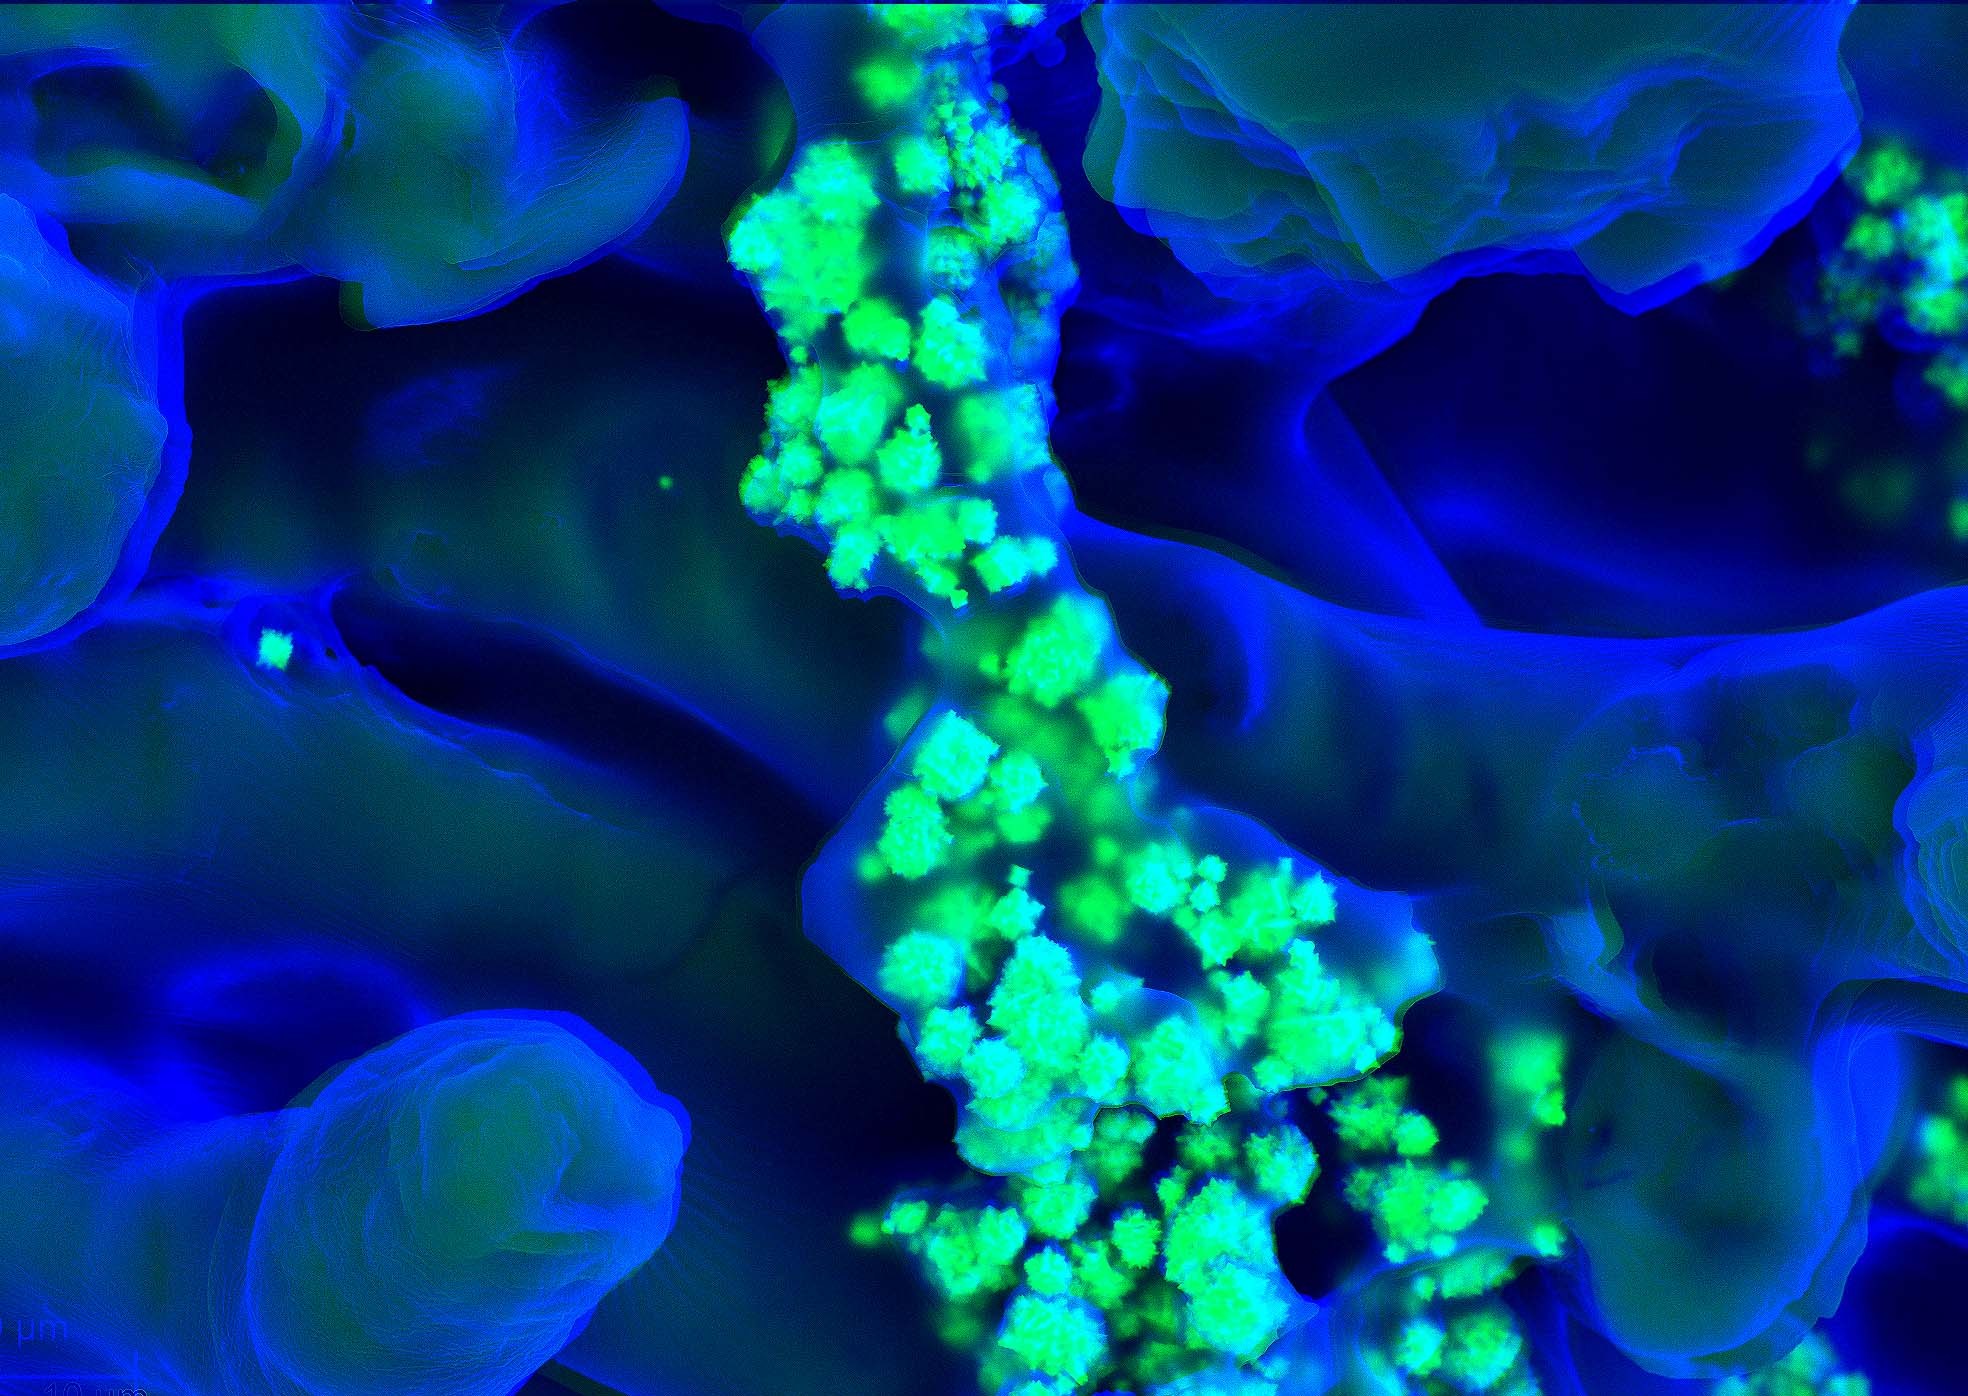
Figure 13: This combined and colorized image further alludes to interaction volume dependency of the spectral mapping. Overlaying the SE2 and BSD images of a matching area show the depth of the nickel particles, where the higher accelerating voltage excites these deeper particles, and the general over-excitation of the nickel generates a blurred, highly intense nickel spectral map.
Stereo-pair Imaging results:
*Note: The following images must be viewed with 3D goggles, the red filter on the left eye, green/blue on the right*
SE2 + BSD mixed stereo pair; Accelerating Voltage 20kV, Mag. 300X
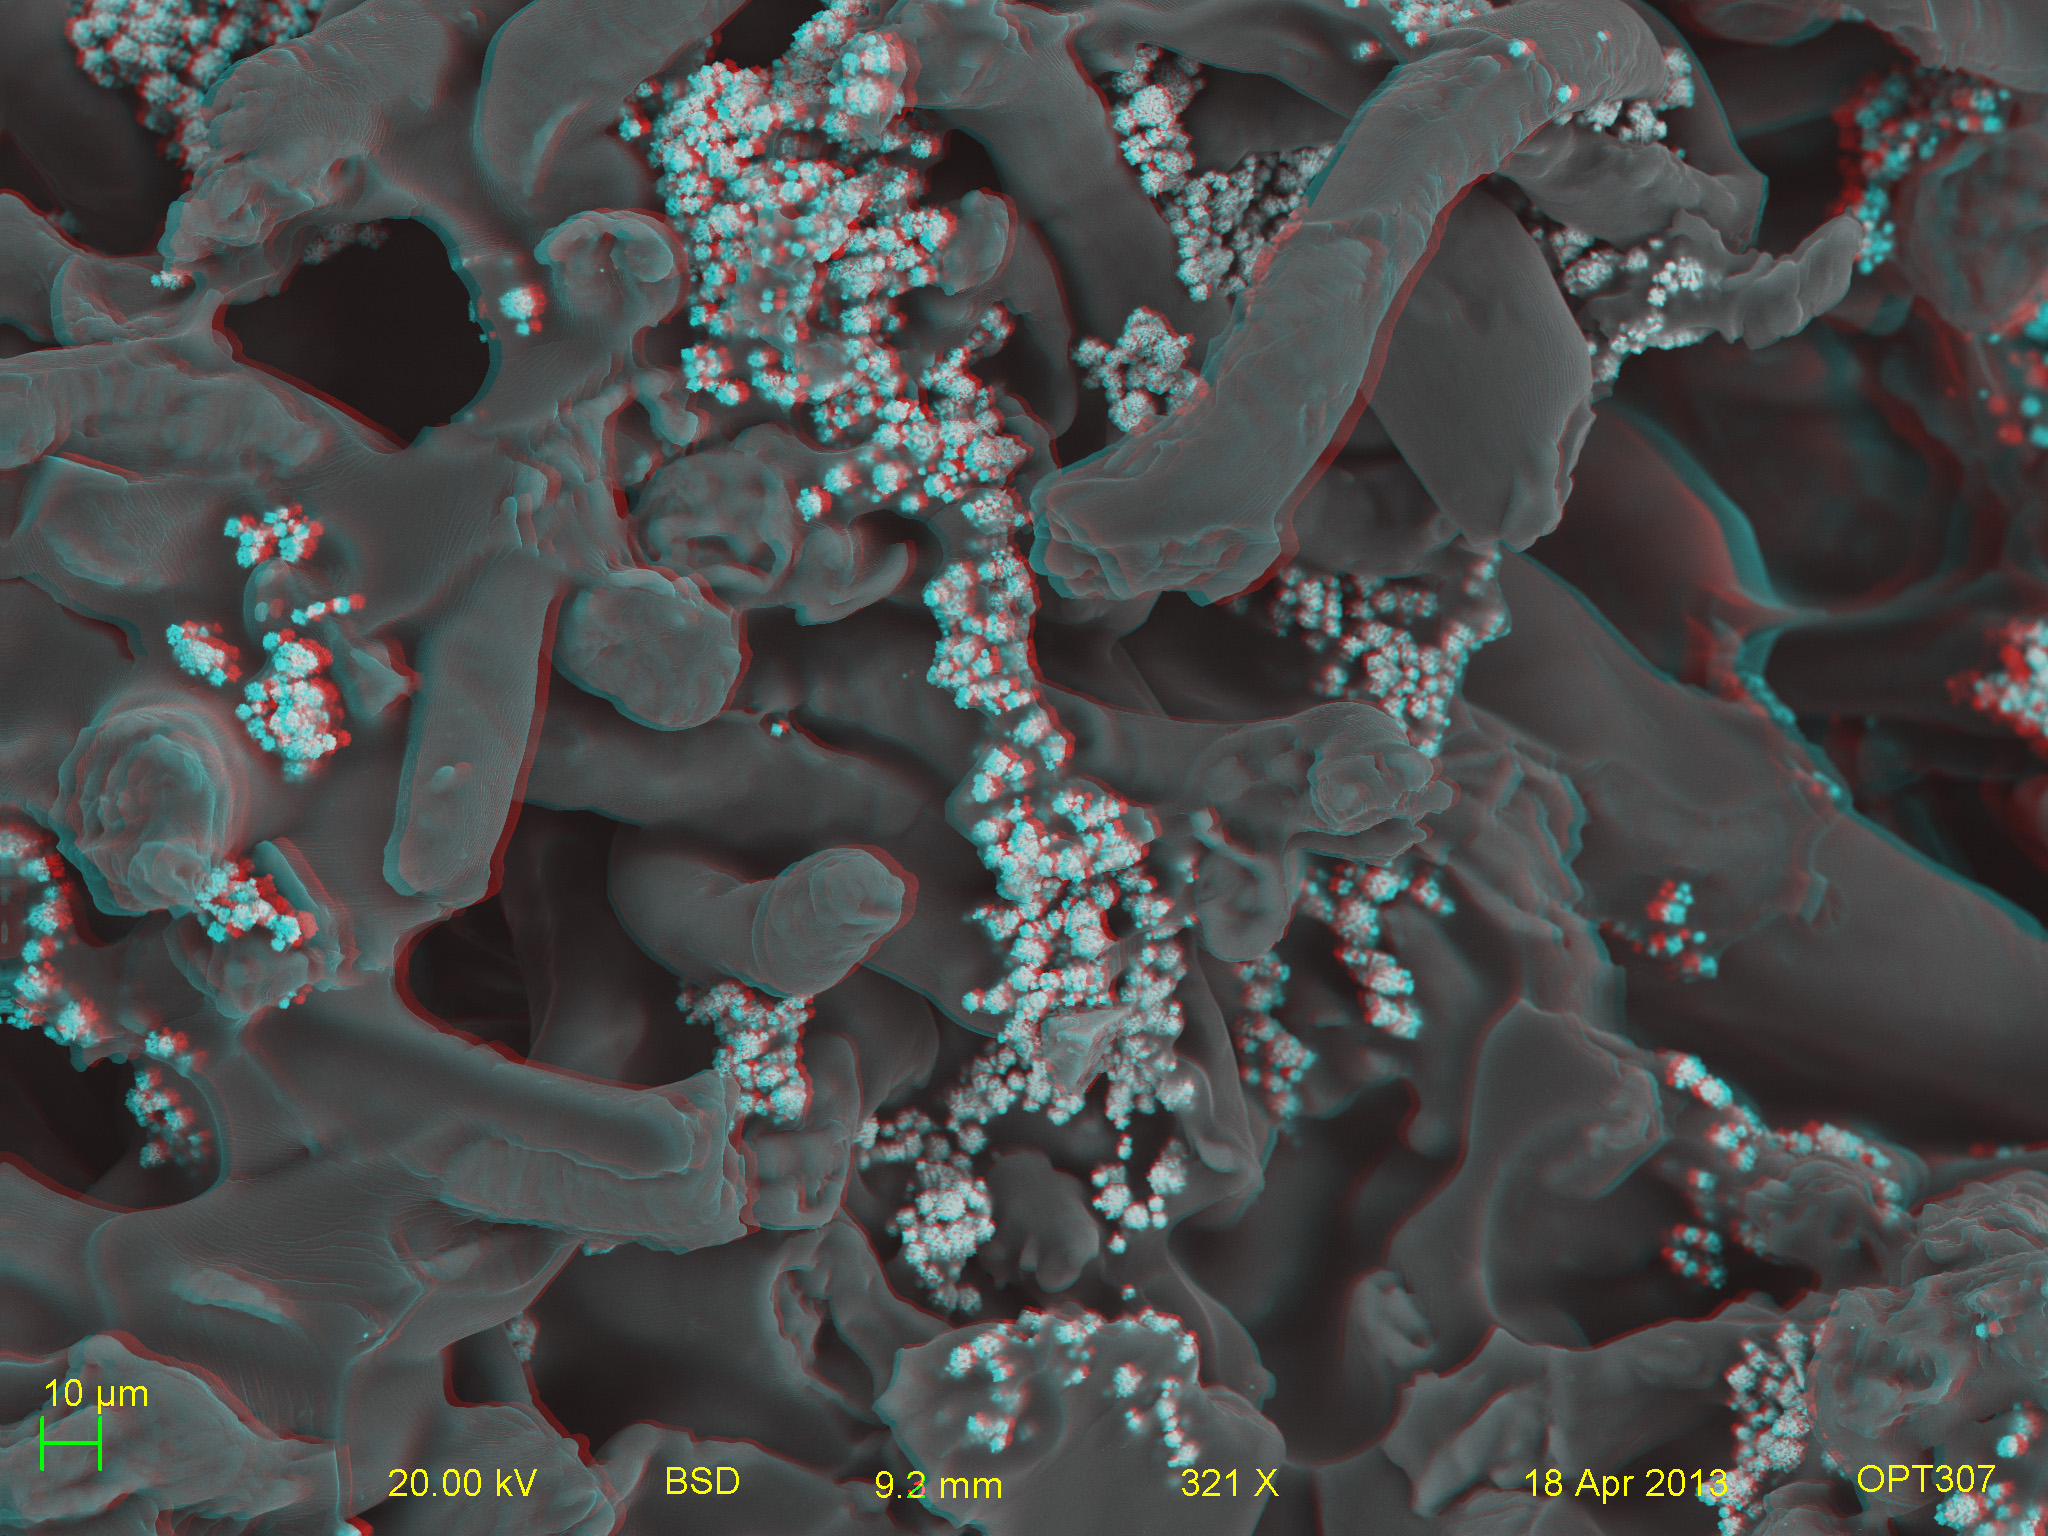
Figure 14: This image was a stereo-pair image taken by mixing the SE2 lens (for depth) and BSD. It illustrates the nature of the formation of these nickel micro-particle columns, in that clearly while they are aligning in the magnetic field, the polymer matrix (tubules) are being formed around them. It is possible that these "sponge-like" structures may inhibit true formation of the particles along a strait line as evidenced in Figure 6.
BSD only; Accelerating voltage 30kV, Mag. 1kX
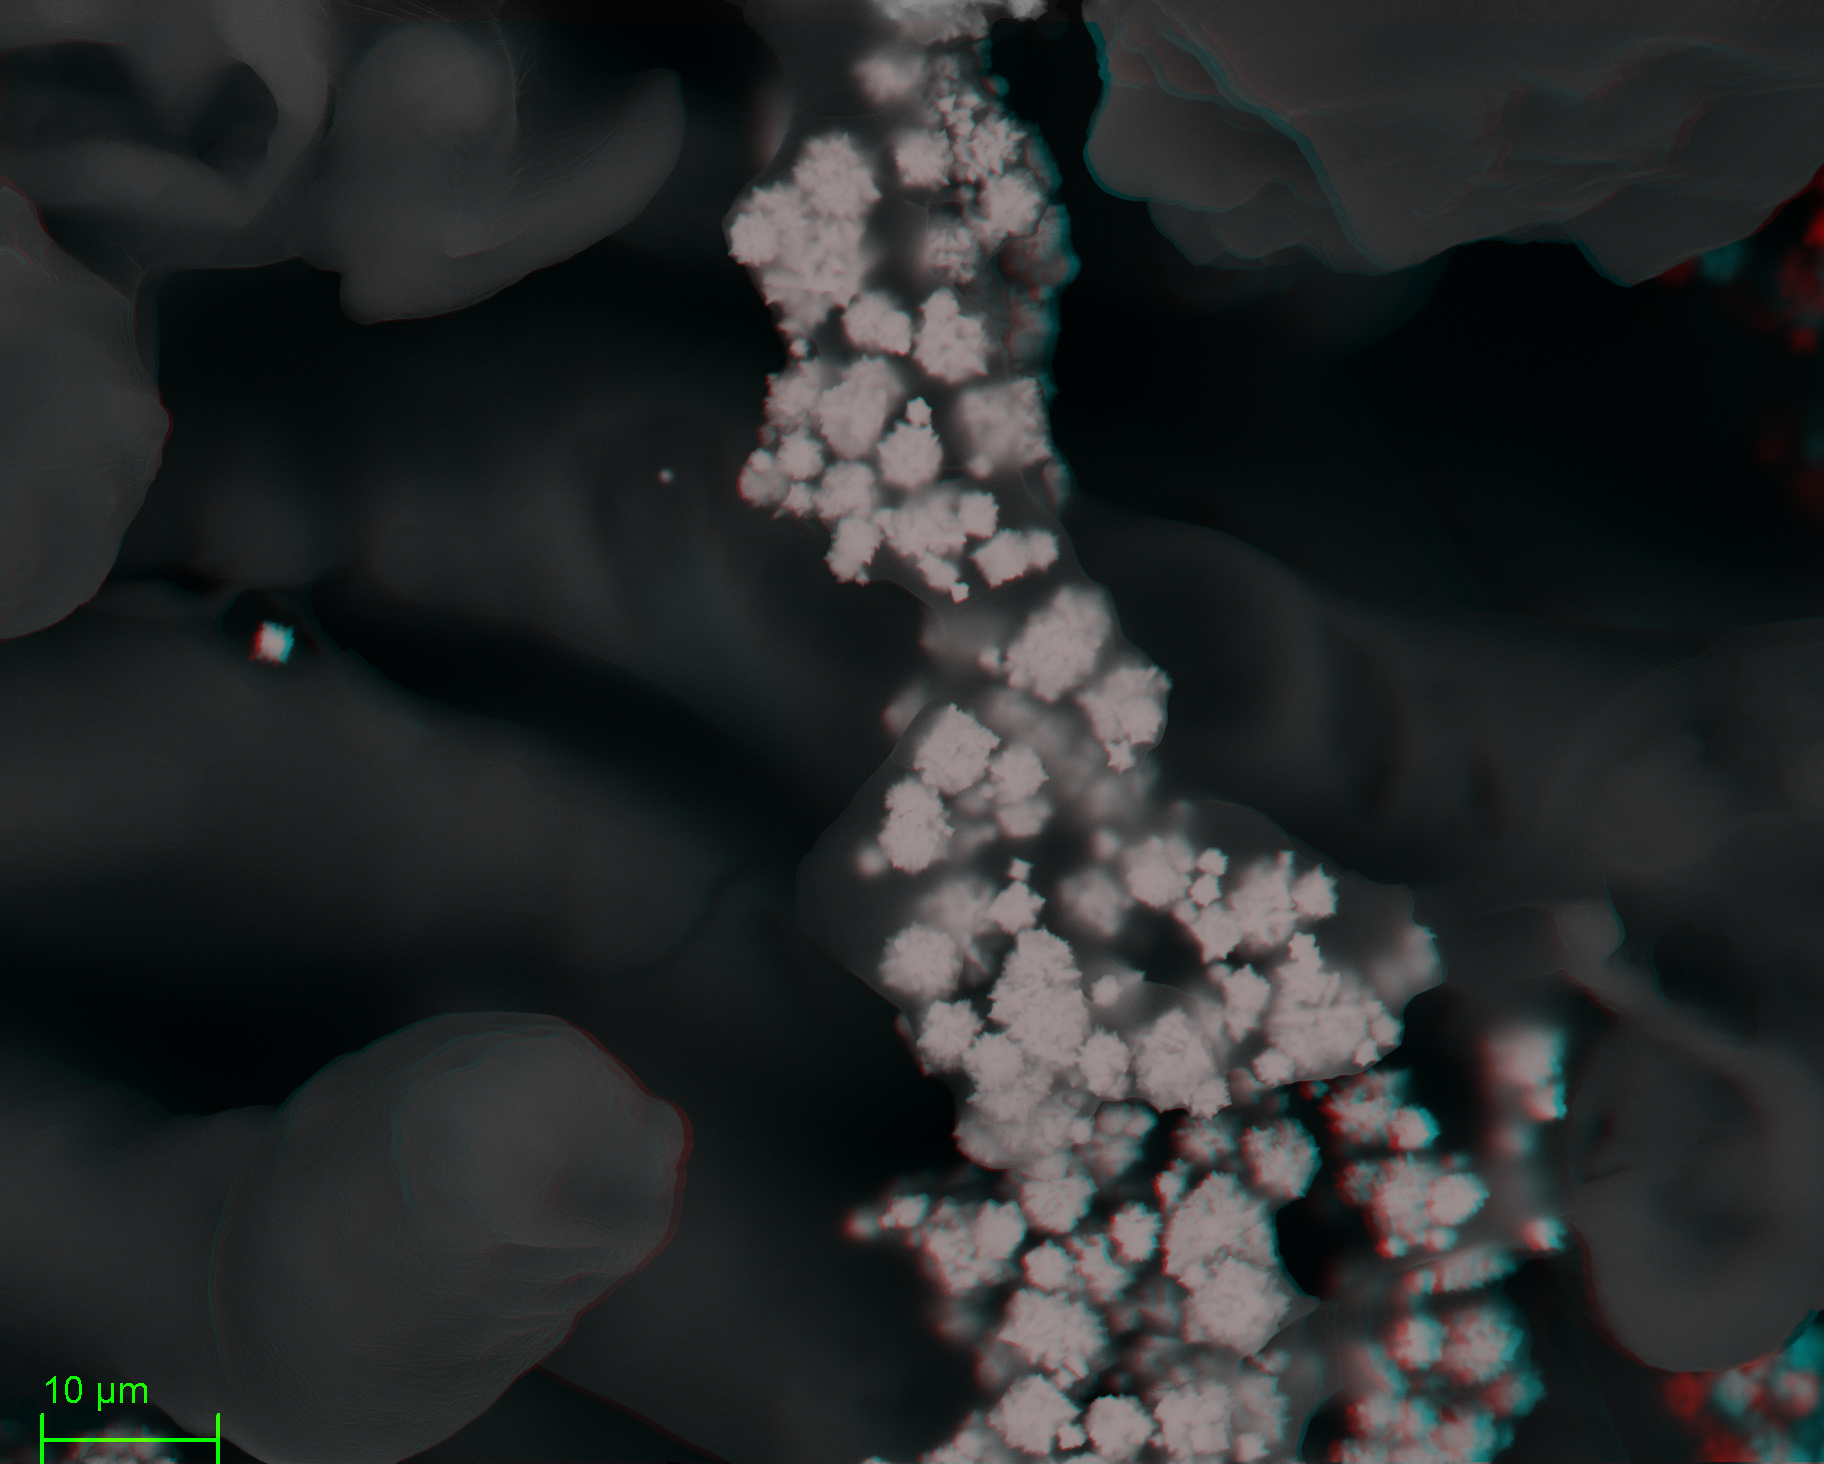
Figure 15: This image was a stereo-pair attained only using backscatter electrons (i.e. just with the BSD). The unique case of a heavy particle inside a low atomic weight media allows for these such an image to be generated, as the high accelerating voltage in this image allows one to view deeply into the the structure of the micro-particle column itself. This gives one an idea of the three dimensional spacing of the particles as they are loosely aligned along a field line.
Conclusions:
Based on the above generated images, one can safely conclude that the micro-particles are indeed aligning themselves along the magnetic field lines generated by the opposite pole electromagnets. Variations in the alignment for any of the test samples appears to be due to the nature of the binder material, perturbing the movement of the particles as they align, as clearly shown by the stereo-pair image taken with backscatter signal alone. Image J analysis shows an average particle size consistent with the manufacturer's size distribution, and an average spacing between particles of 2.51 microns. The EDS and ZAF results demonstrate a good correlation to the initial weight percent sample mixture ratio, where the spectral mapping shows the nickel particles are well-segregated from the surrounding binder.
The results of this imaging study highlight the possibility of the controlled alignment of these nickel micro-particles, a system construct that can be extrapolated to smaller particle size, and directly implemented in a lithium ion battery for preliminary testing as a stress/strain indicator for charge cycling.
Acknowledgments:
References and Further Reading:
Magnetic Nanorods for Optofluidic Applications, Tokarev, Rubin, Bedford and G. Kornev; School of Materials Science and Engineering, Clemson University, SC USA; 8th International Conference on the Scientific and Clinical Applications of Magnetic Carriers, 2010