Wood is classified into hardwood and softwood based different classifications of trees on a biological level. Angiosperm trees are usually deciduous and have large pores, called vessels, which run with the grain of the wood and are used to transfer water and nutrients to different parts of the tree. This complex cellular structure creates a dense wood and has lead to angiosperms being known as hardwoods. Gymnosperm trees are conifers and mostly evergreen. Their cellular structure is less complex, resulting in softer wood.
Scanning Electron Microscopy (SEM) is able to provide high resolution, high magnification images, allowing for the imaging of features on the sub-micron scale. The scanning electron microscope exploits the interaction of an electron beam focused on a sample, providing elastic and inelastic scattering events, to create an image. Secondary electrons result from inelastic interactions of the beam with the sample. These interactions provide valuable information about the surface features of a sample. SEM images can be used to compare surface features of different samples, making it a powerful tool for comparing the microstructure of hard- and softwoods. SEM also has the ability of detecting X-rays excited from the sample through an EDAX attachment, which will be used to determine the elemental composition of the sample. In this study it will be used to determine if the samples have been treated with chemical coatings.
In this project images of hardwood and softwood at a high magnification were examined for differences between the two types of wood on the microscale. The findings were compared to known characteristics of each type of wood. Secondary electron imaging was used to image the surface features of four wood samples, two hardwood and two softwood. The samples were prepared by microtomy and sputter coated with gold to reduce charging. After imaging, some images were colorized for added effect and 3D anaglyphs were created to show depth of features. Post collection processing was done in Adobe Photoshop CS6.
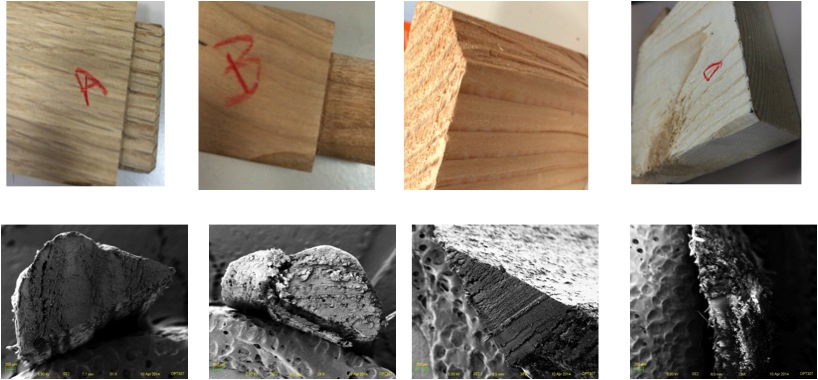
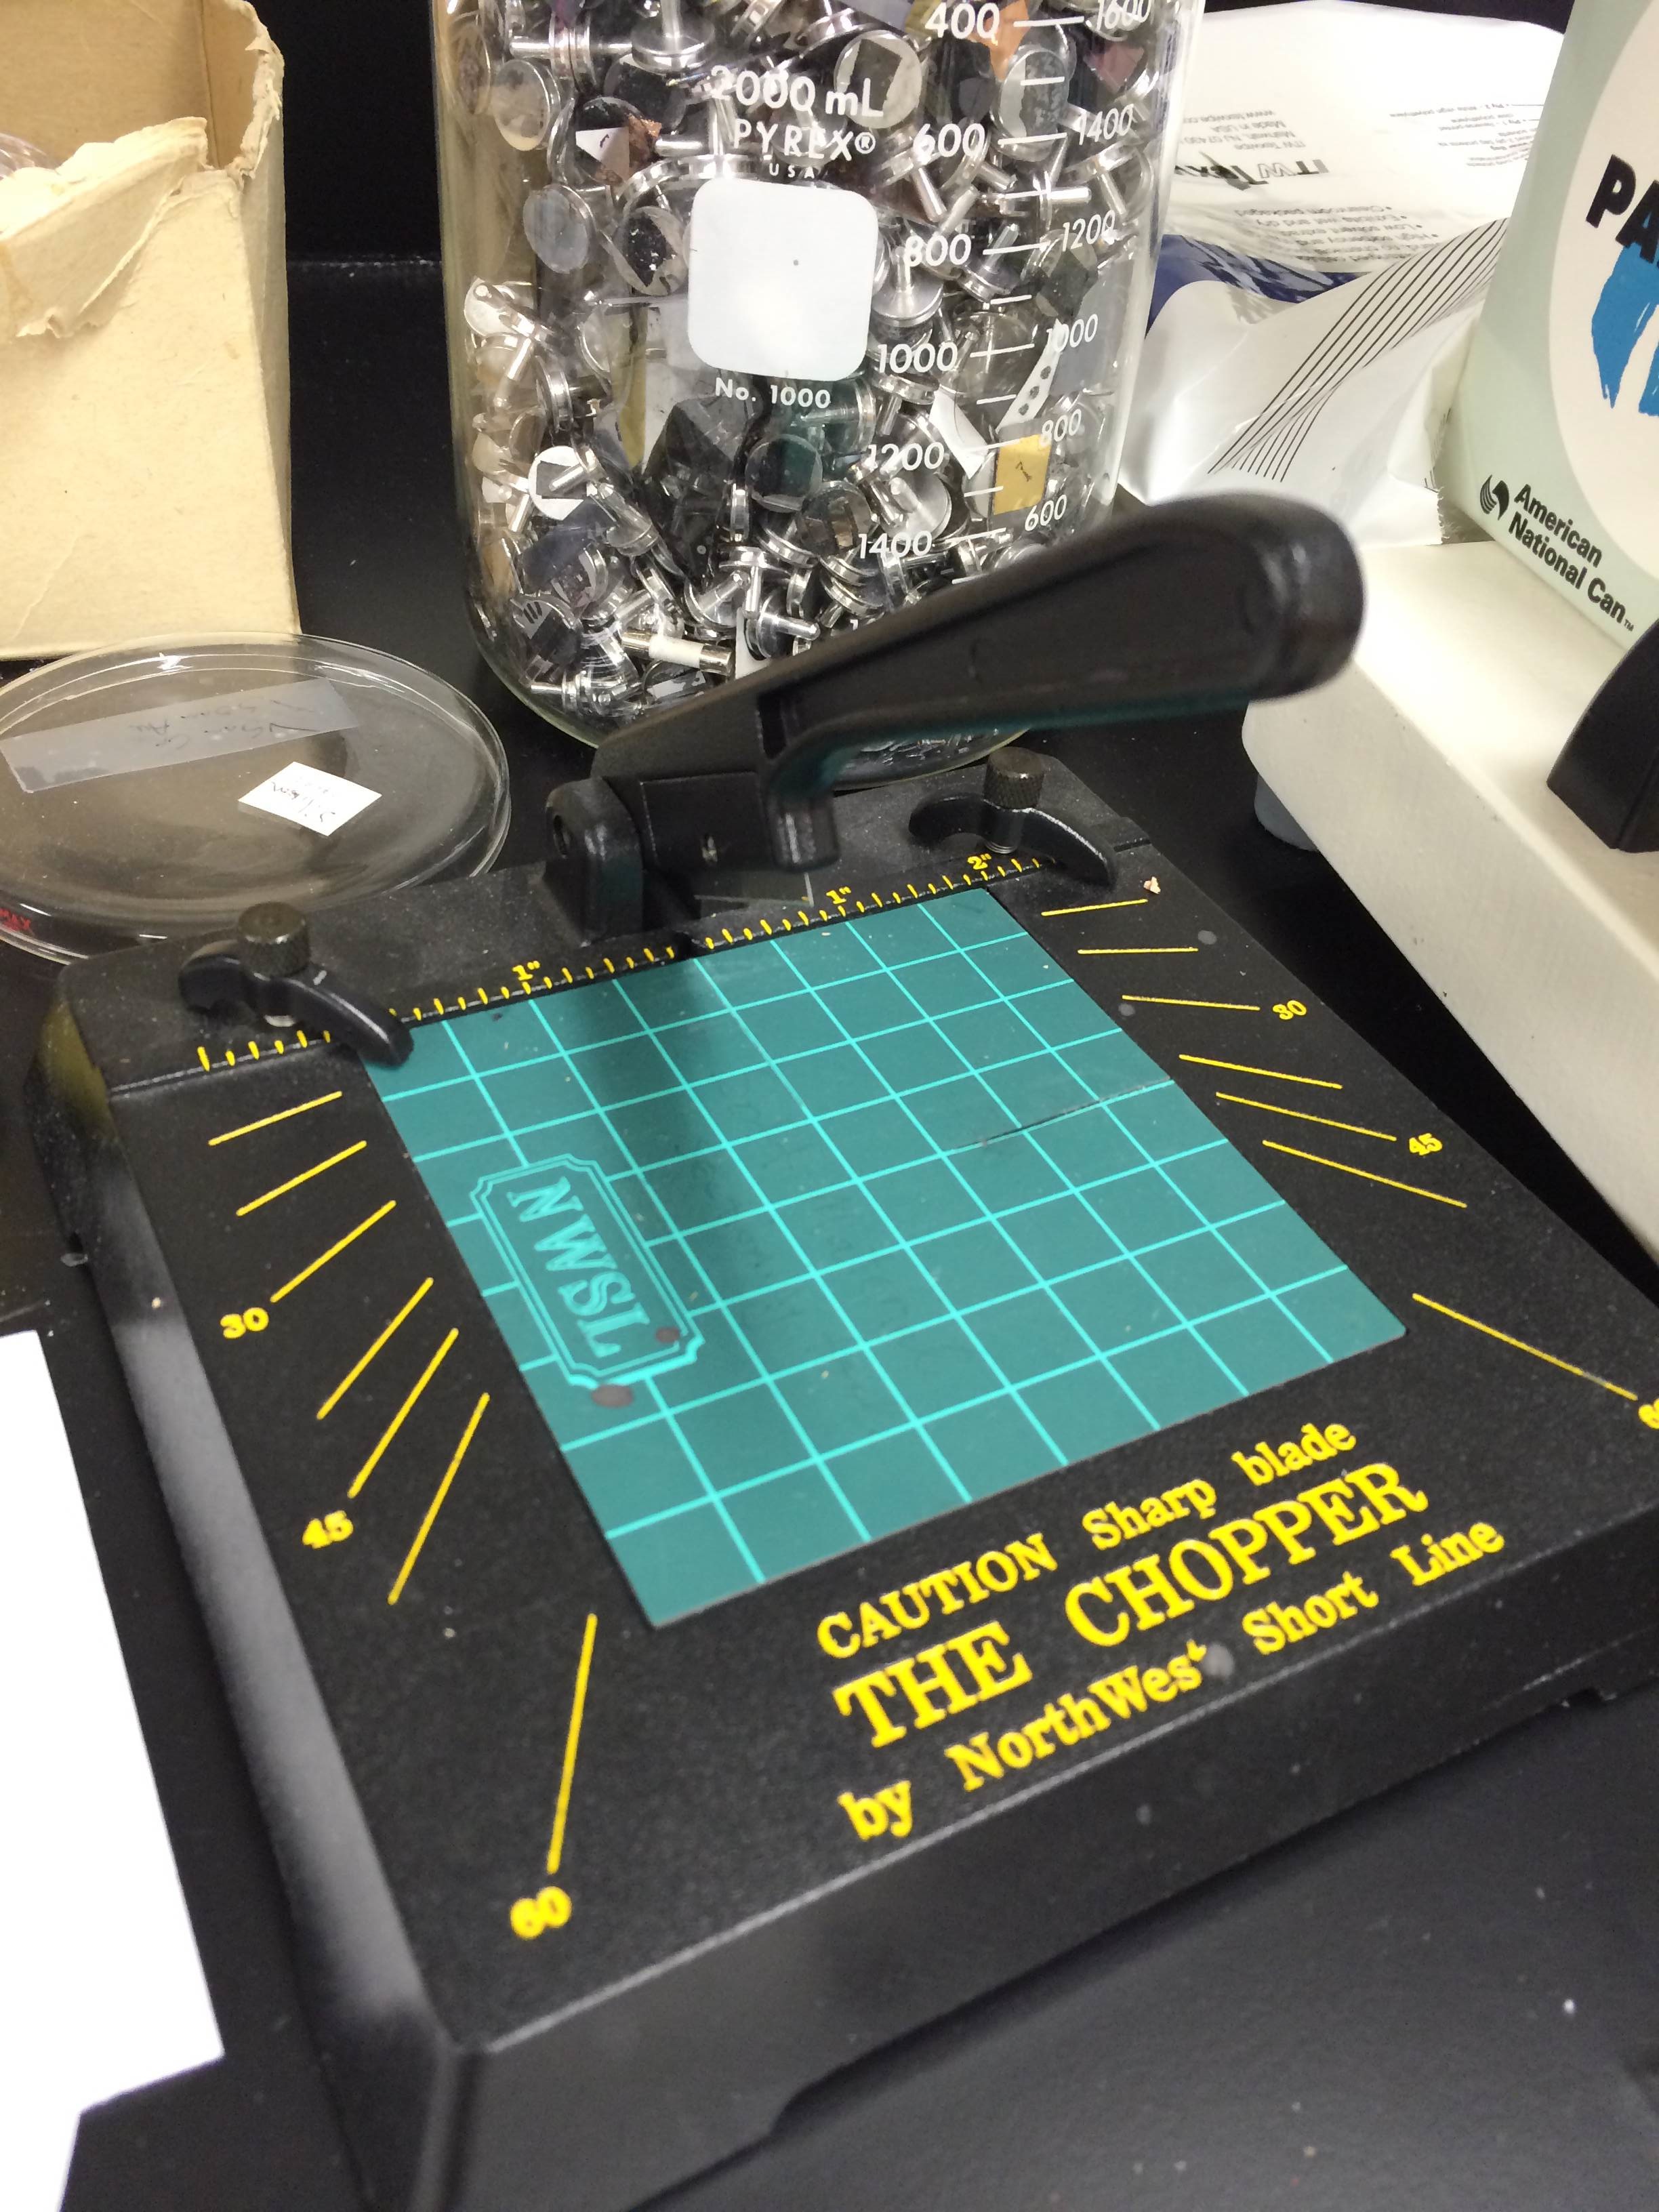
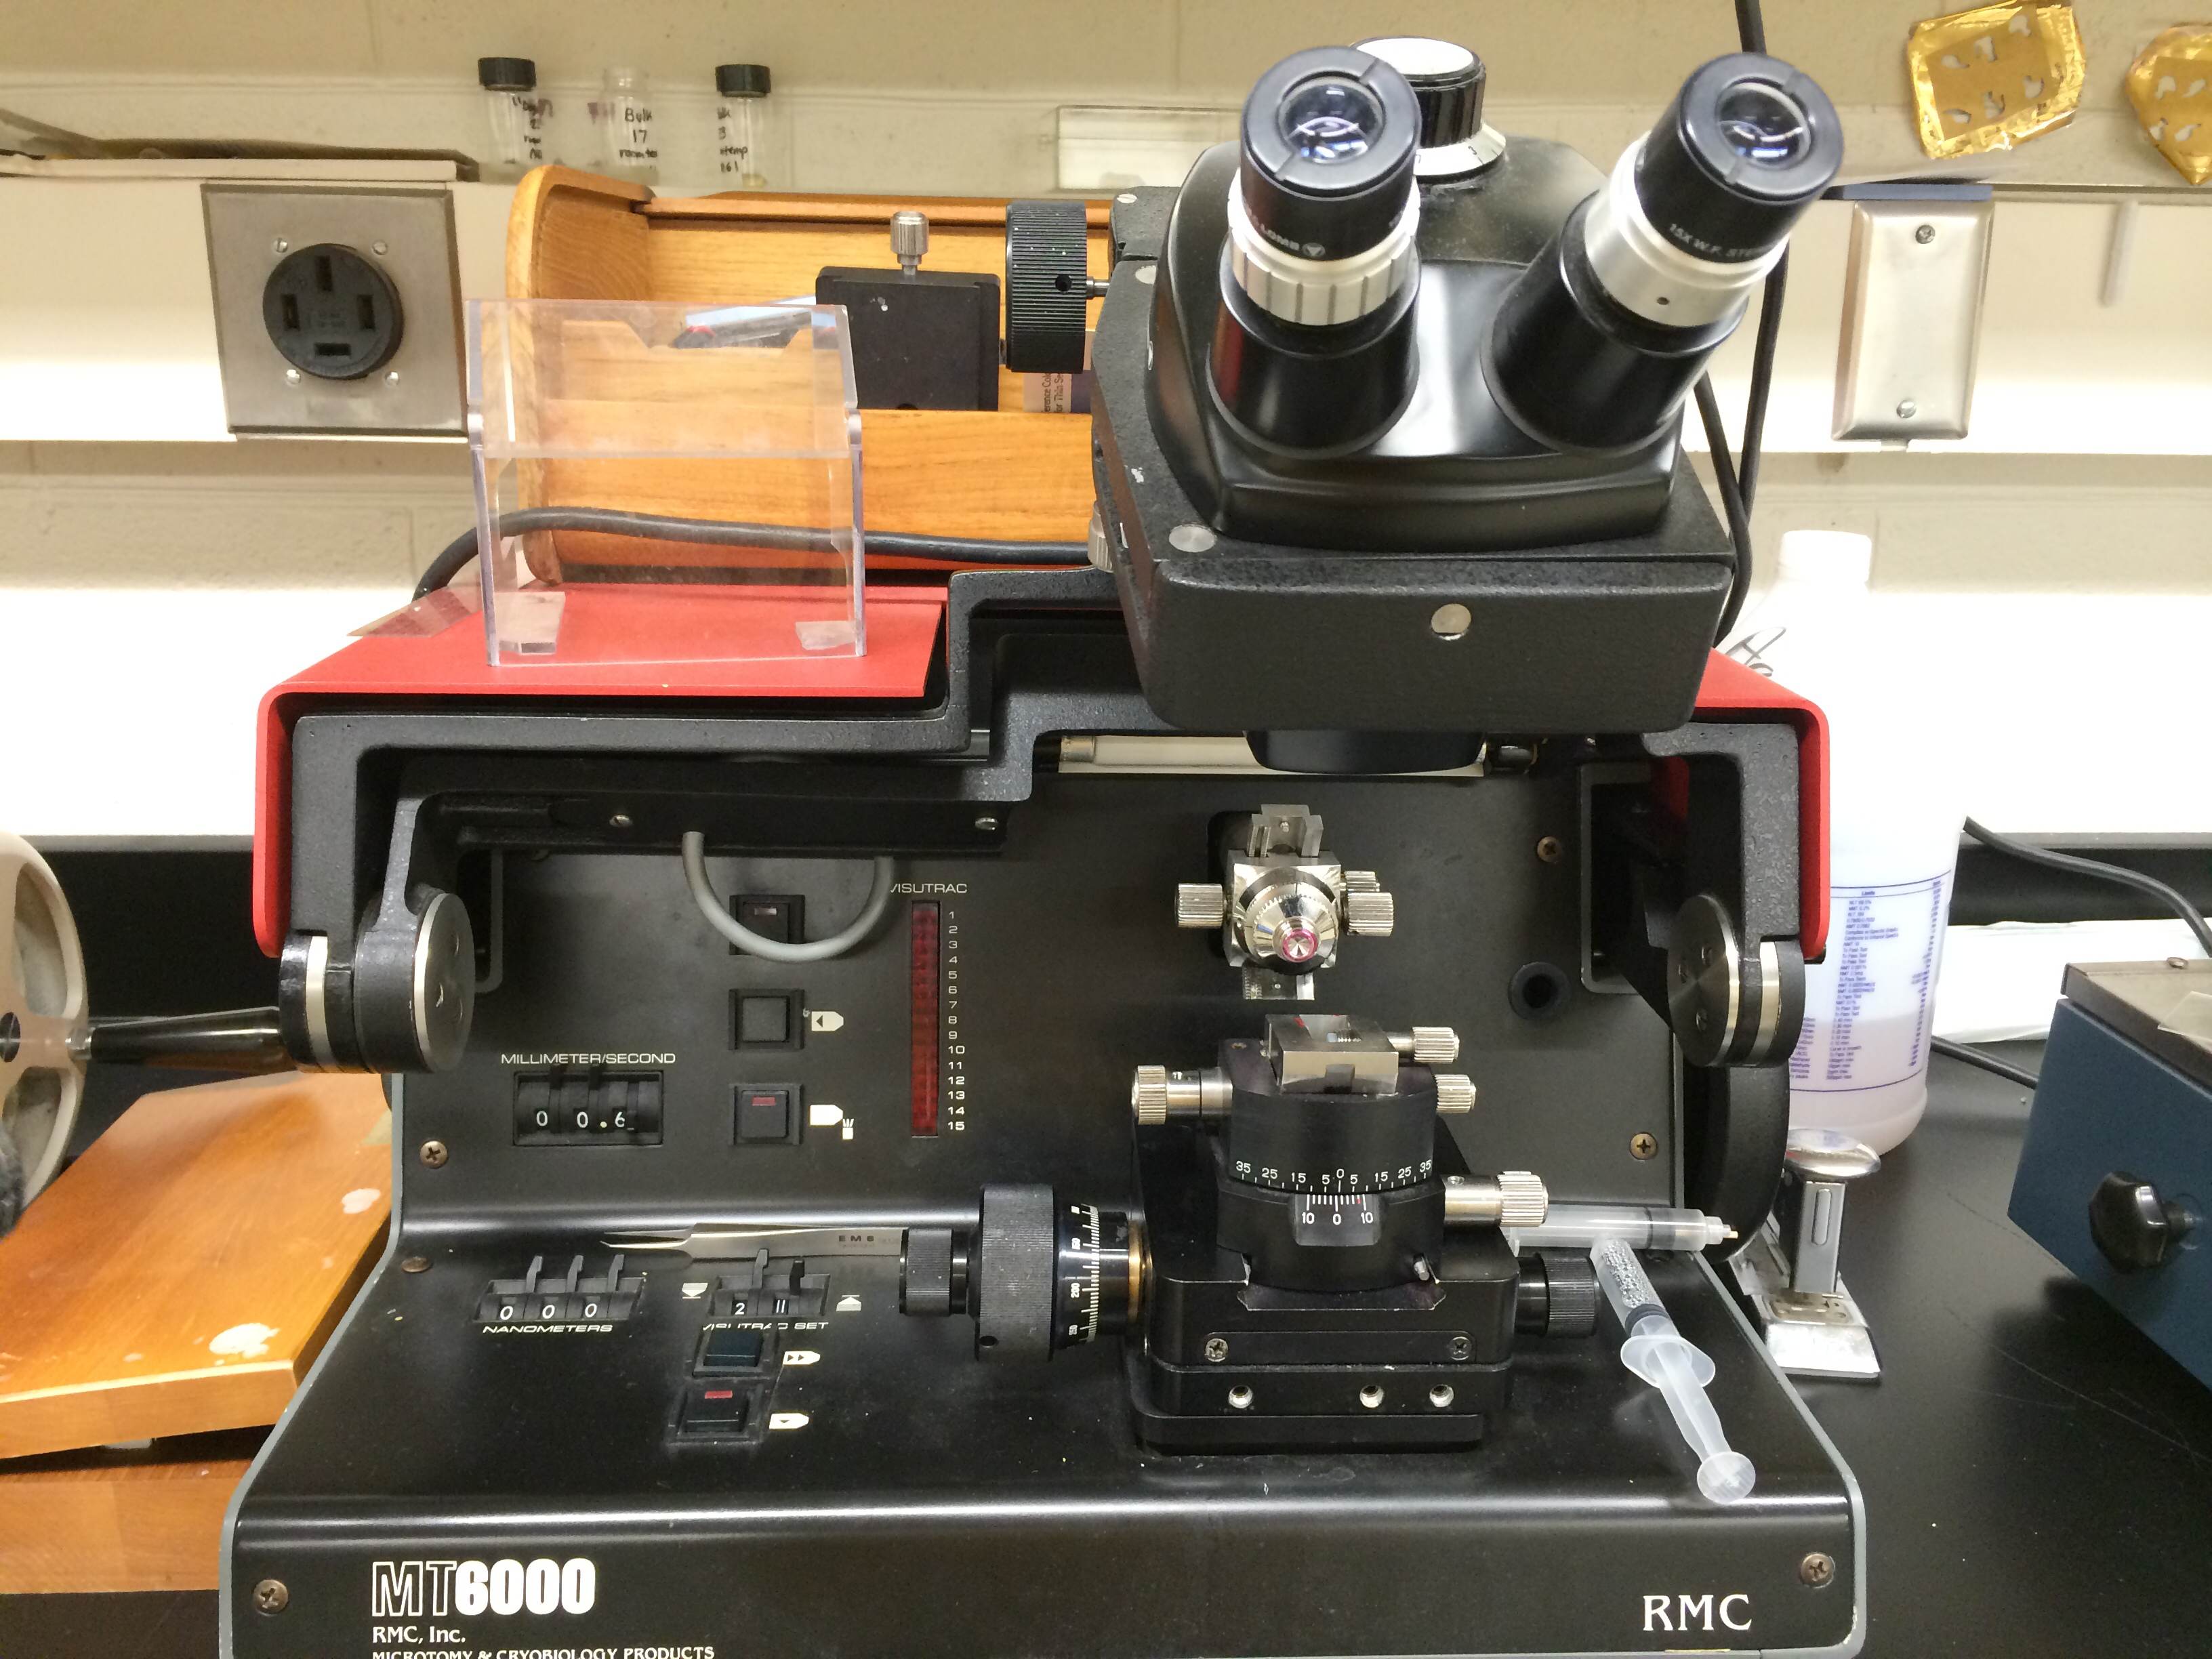
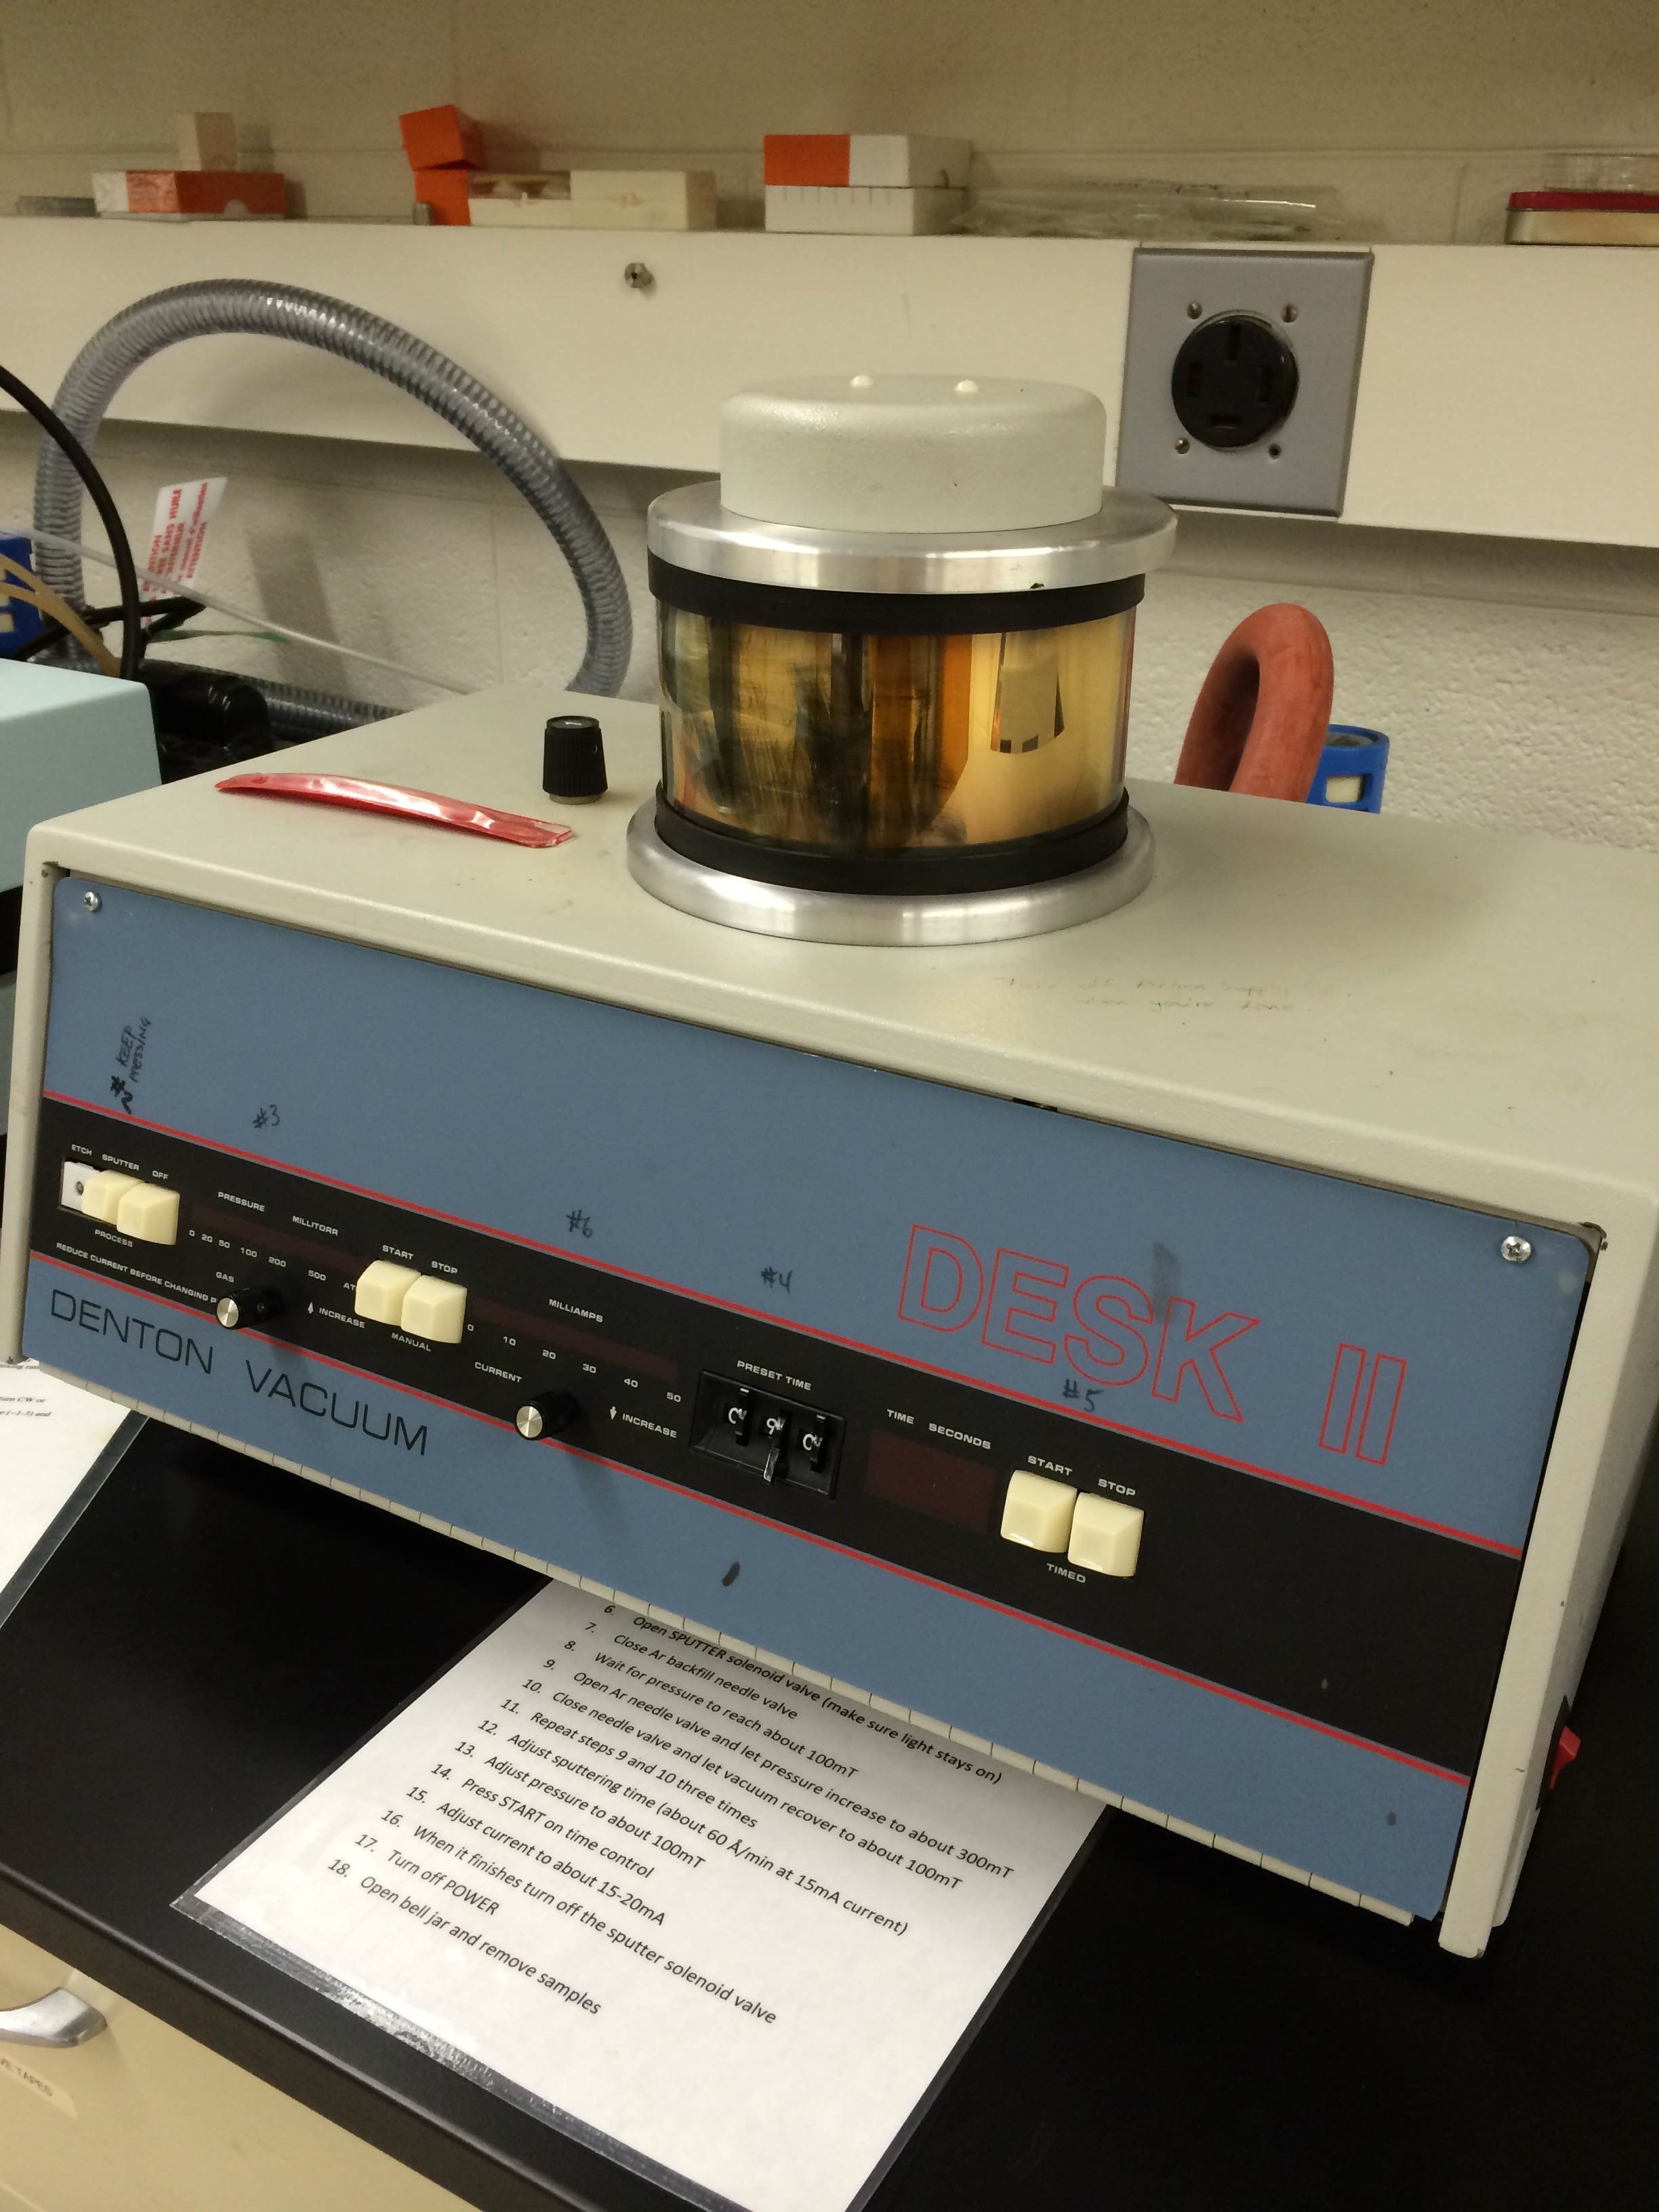
Four unknown wood samples, two hardwood and two softwood, were collected. The samples were split into appropriately small pieces using a screwdriver and trimmed and given flat edges using The Chopper. The samples were then shaved using a Microtome to provide a clean flat surface to image. Samples were then mounted onto a SEM sample stub with a metal ring mounted on it using conductive adhesive tape and secured using conductive glue. To make the samples themselves conductive and reduce charging, the samples were sputter coated with gold for 90 seconds using a gold sputter coater.
Hardwood Samples
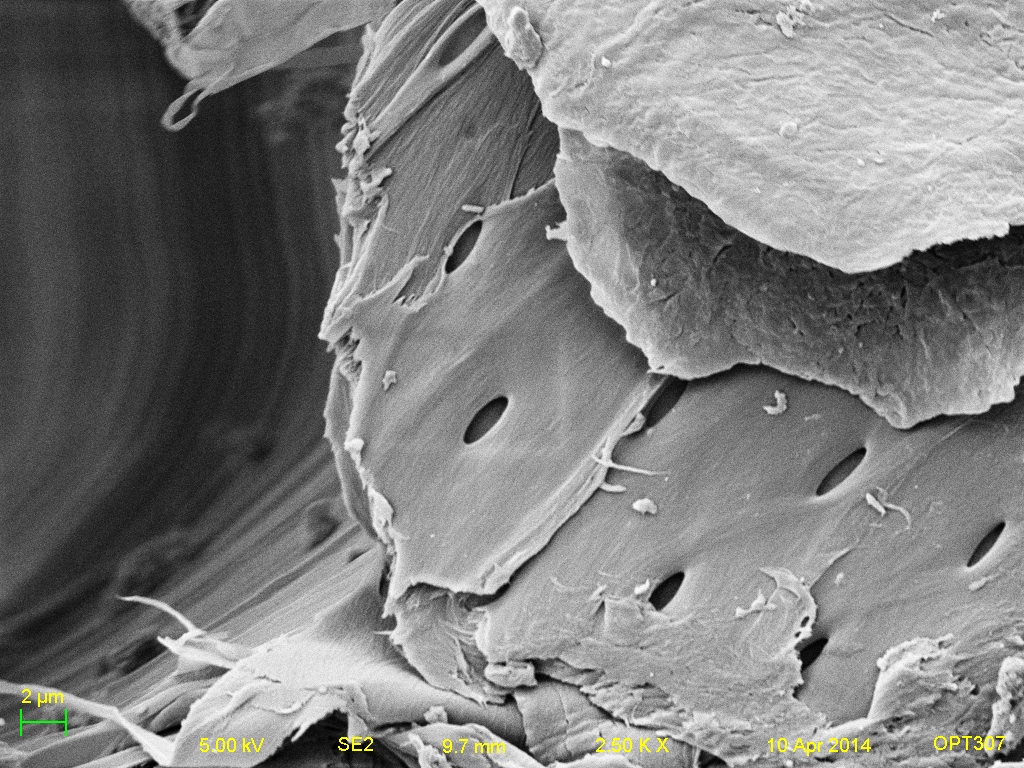
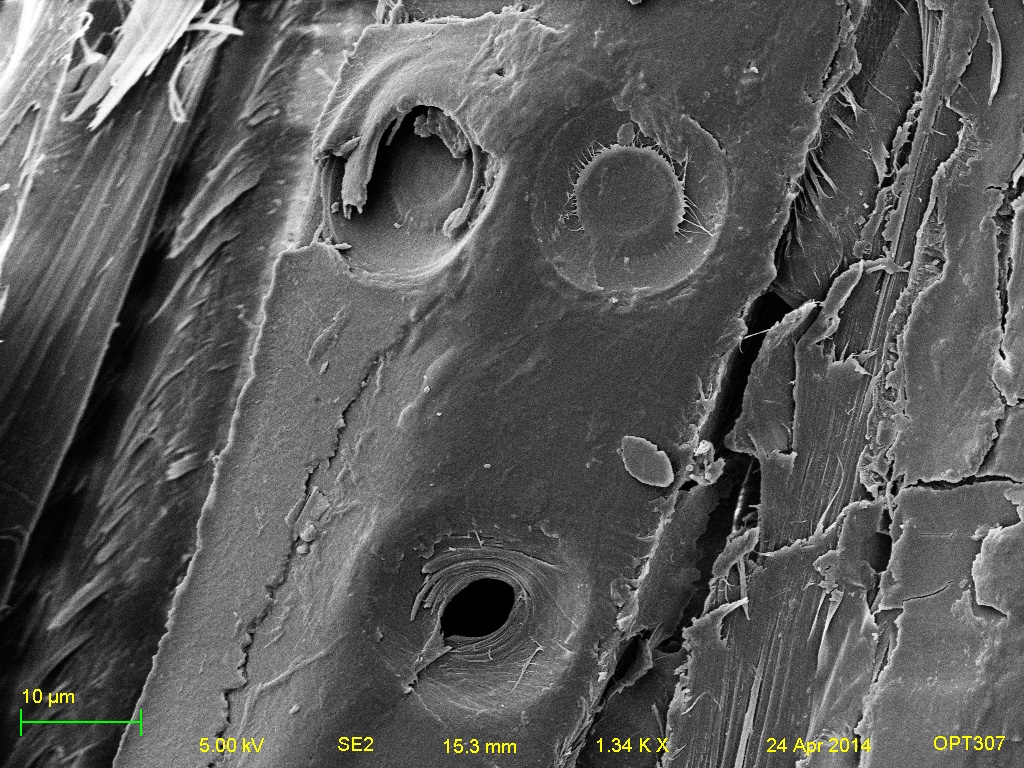
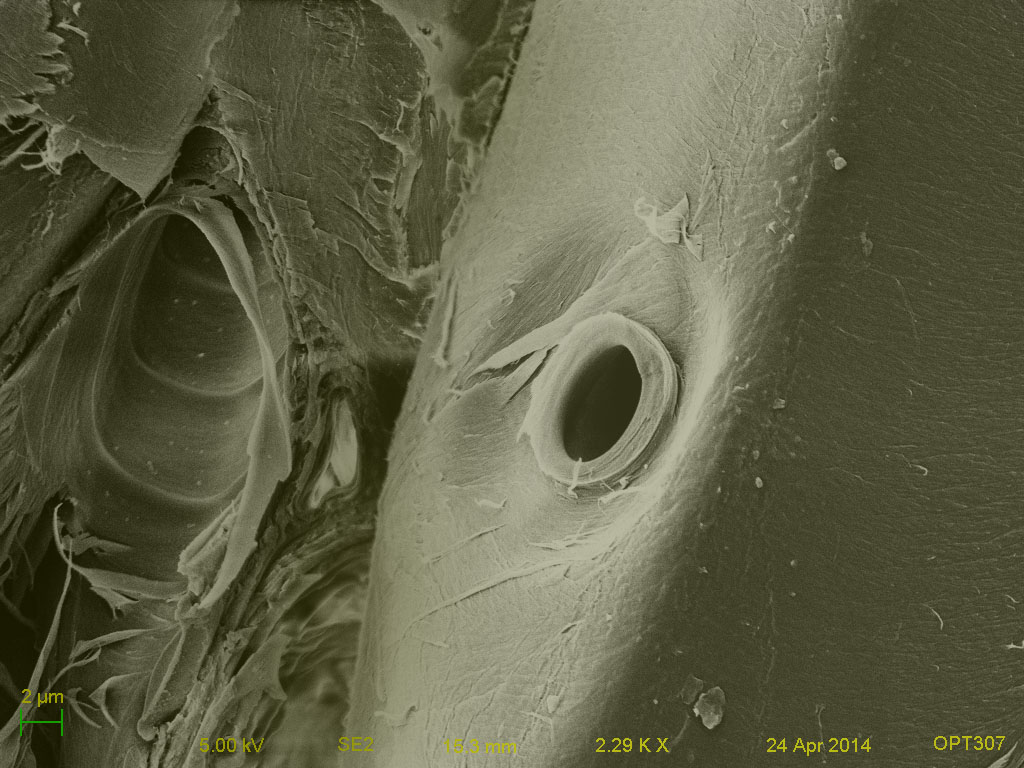
Exposed canal showing a pit. (A)
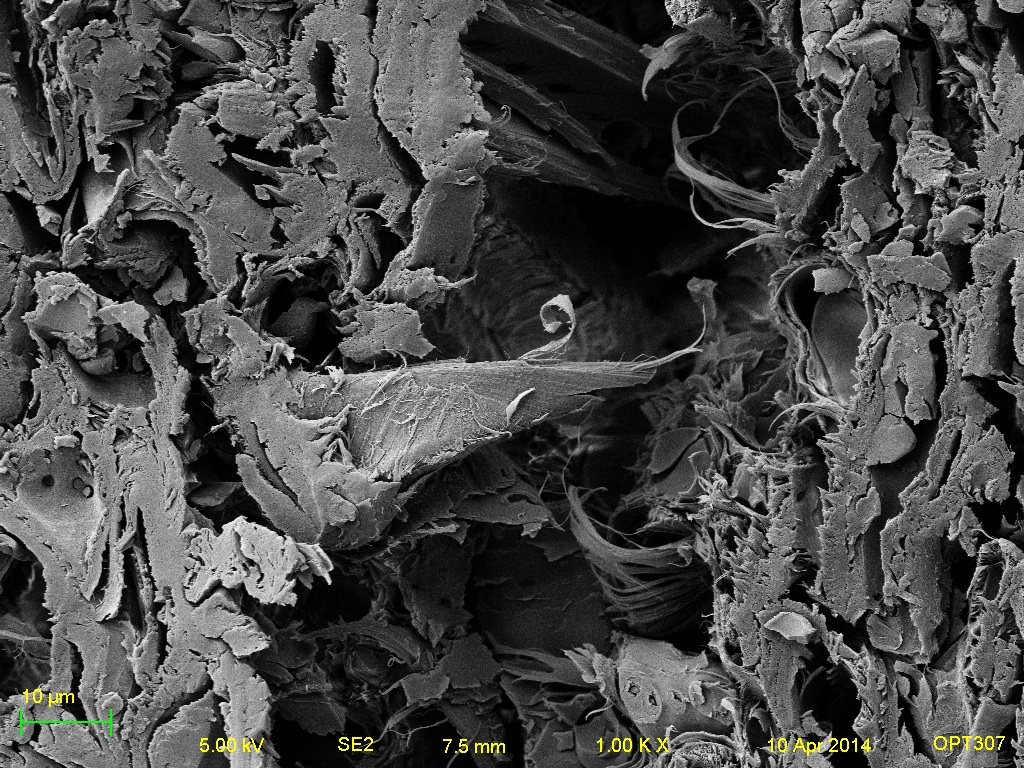
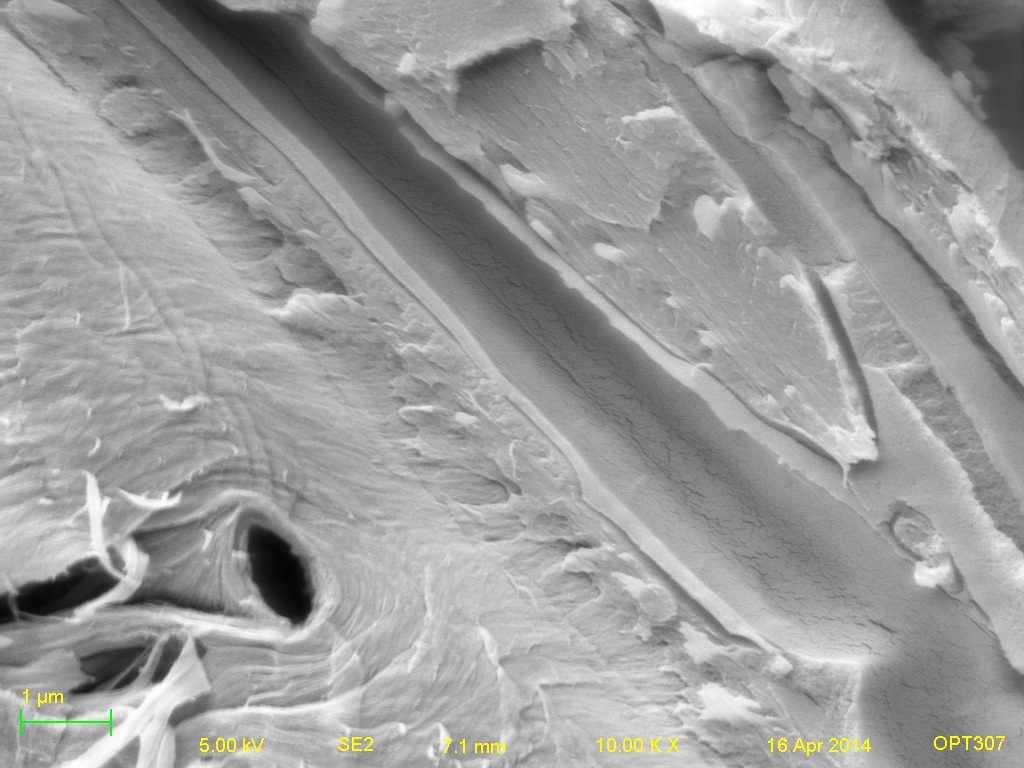
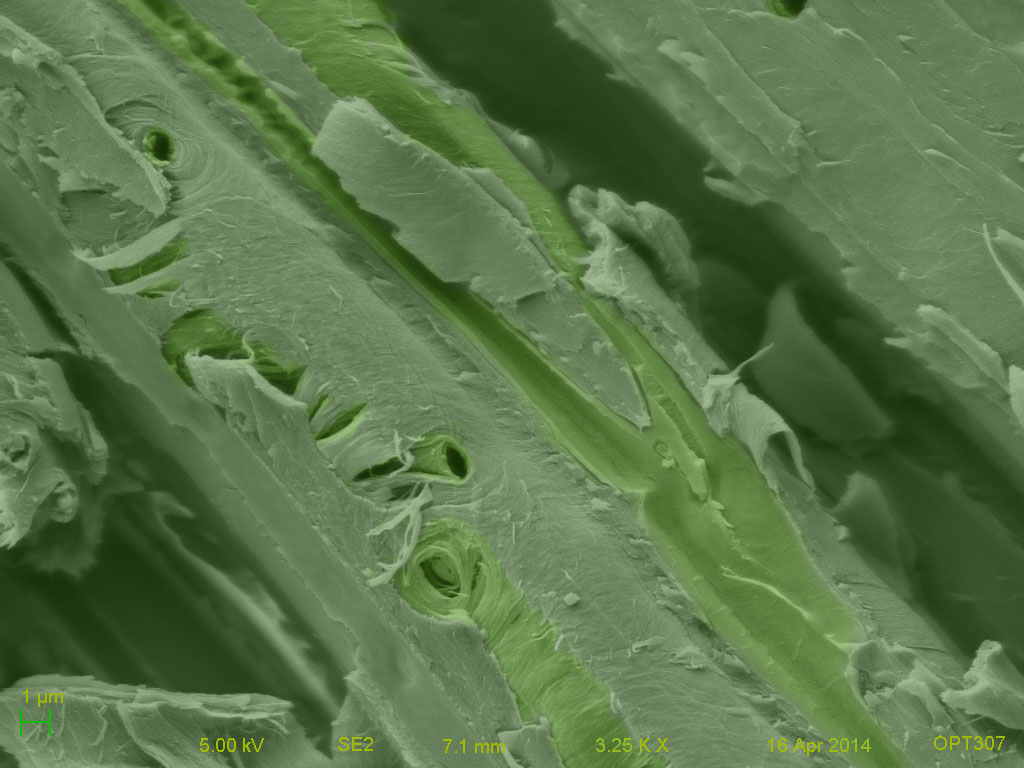
Delicate microstructure. (A)
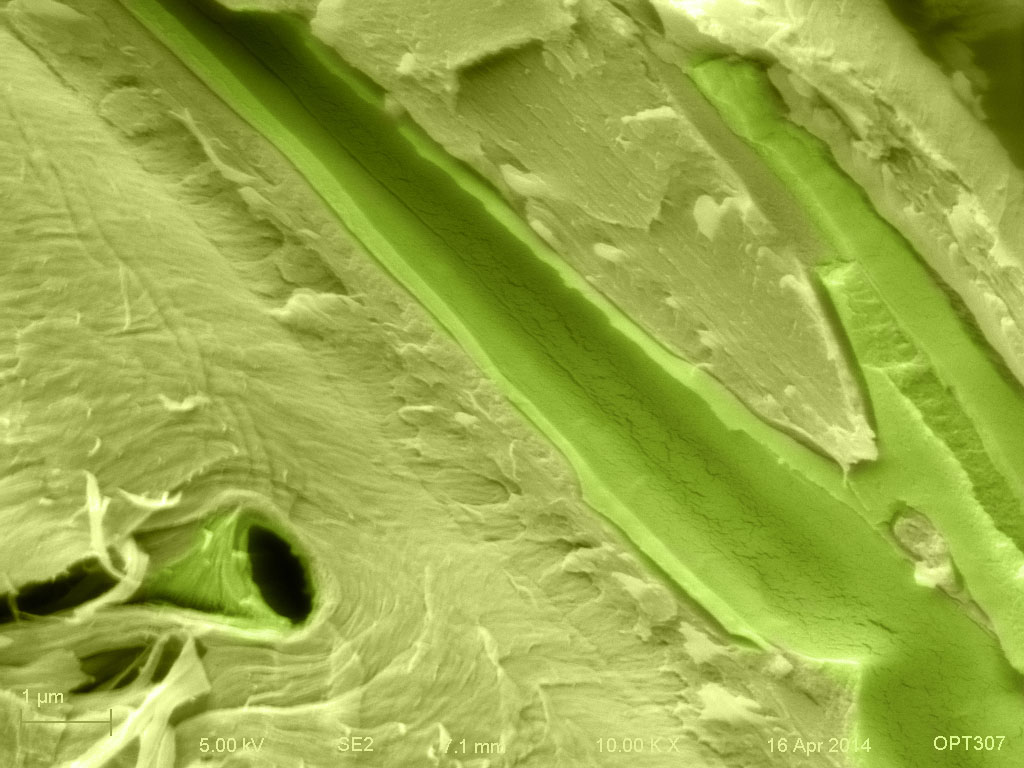
Interesting microstructure next to a resin canal. (B)
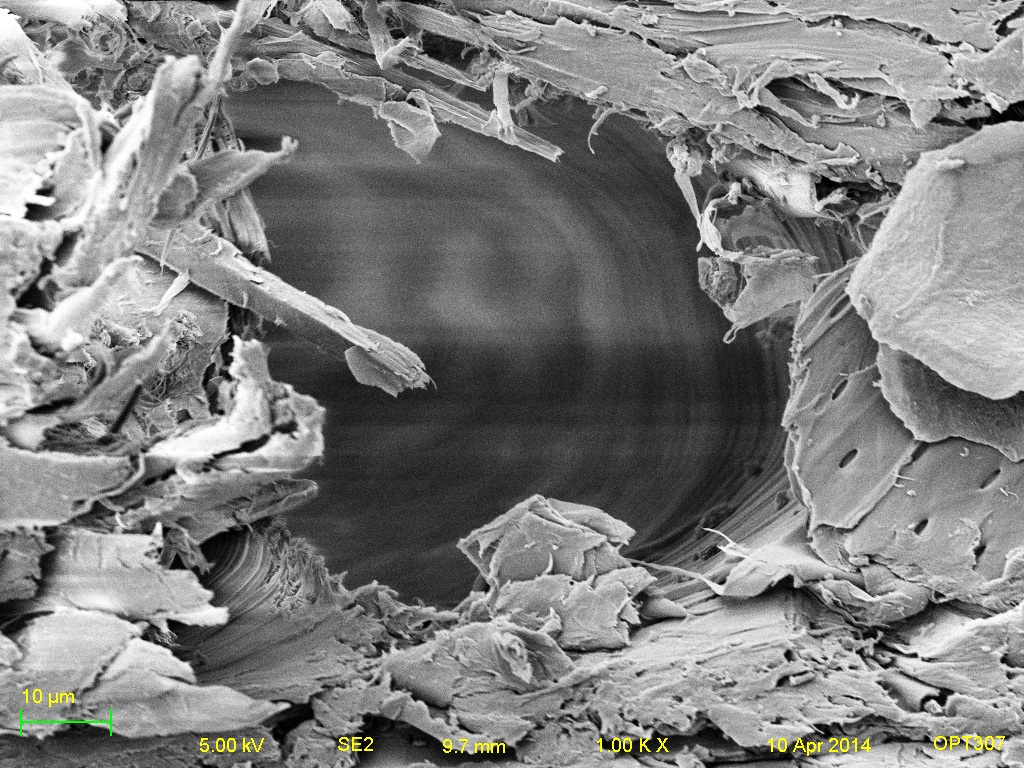
Resin canal opening. (B)
Softwood Samples
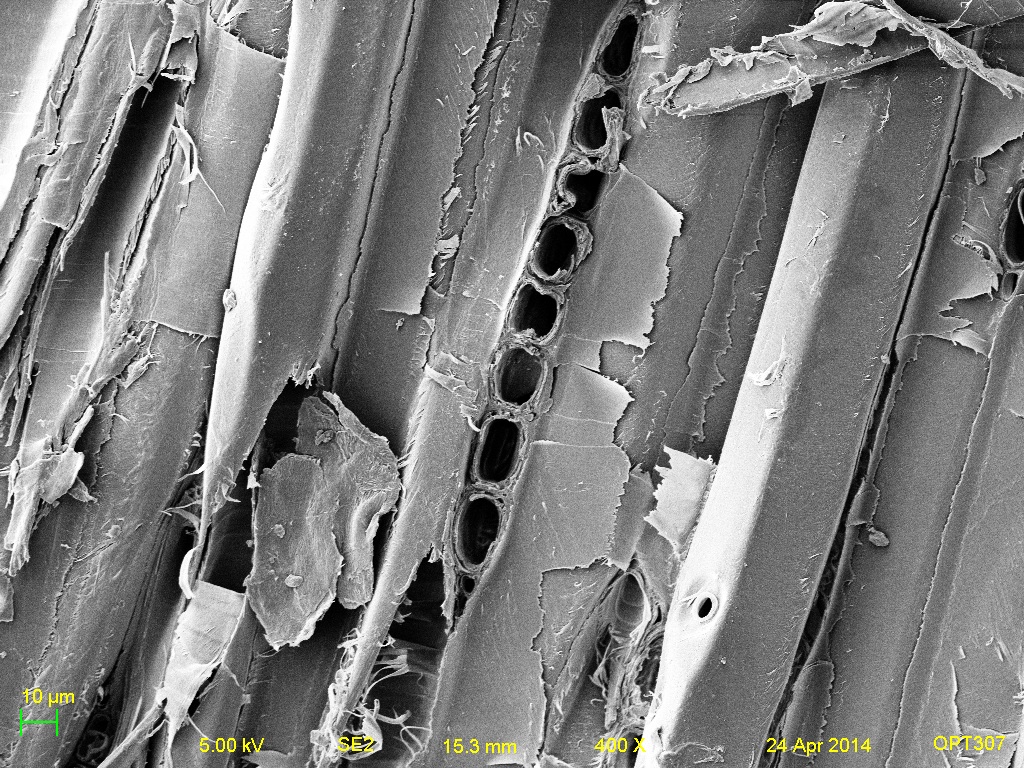
Bordered pits characteristic of pines. (C)
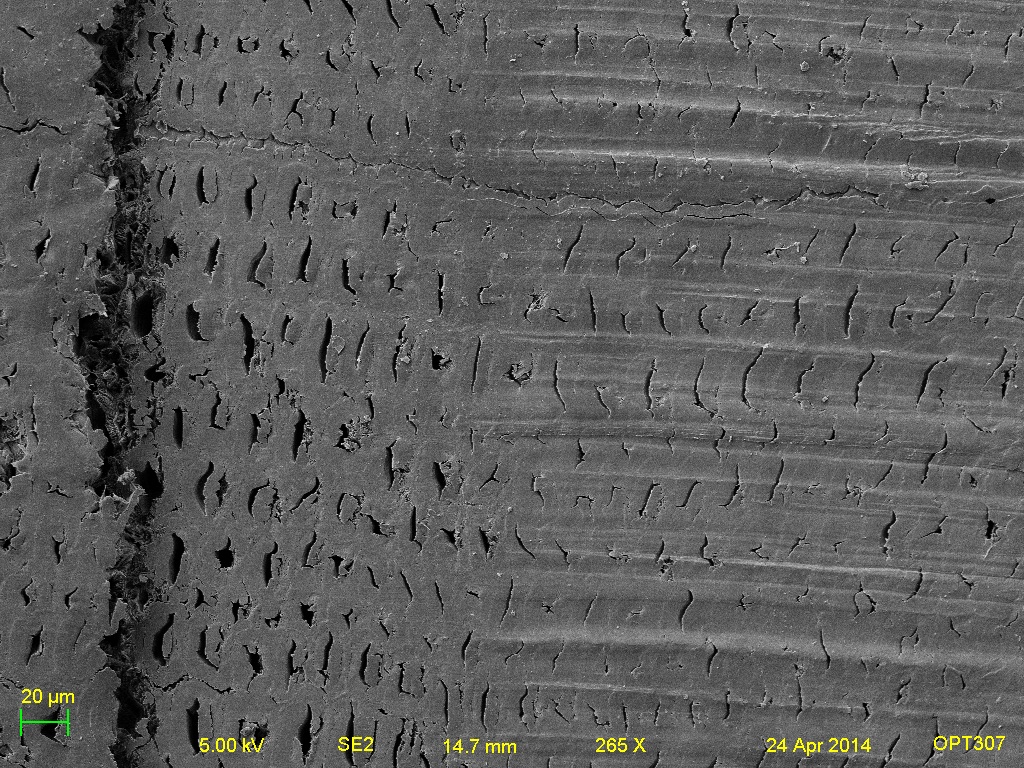
Slow and fast growth (left to right) (C).
rays from a transverse view (C).
X-ray microanalysis was conducted using the Zeiss Auriga Crossbeam SEM at the Institute of Optics at the University of Rochester. X-ray measures the amount of x-ray signal generated from the electron beam interacting with the sample. The Zeiss Auriga Corssbeam SEM is equipped with an energy dispersive x-ray spectrometer consisting of a solid-state detector mounted inside the vacuum chamber at as close to perpendicular to the sample plane as possible. X-ray microanalysis was conducted on each of the four different wood samples. It was hypothesized that the samples may have been treated with a chemical coating that would be detectable by X-ray, as can be seen from the resulting micrographs this was not the case. It did confirm, however, that the samples are indeed organic materials.
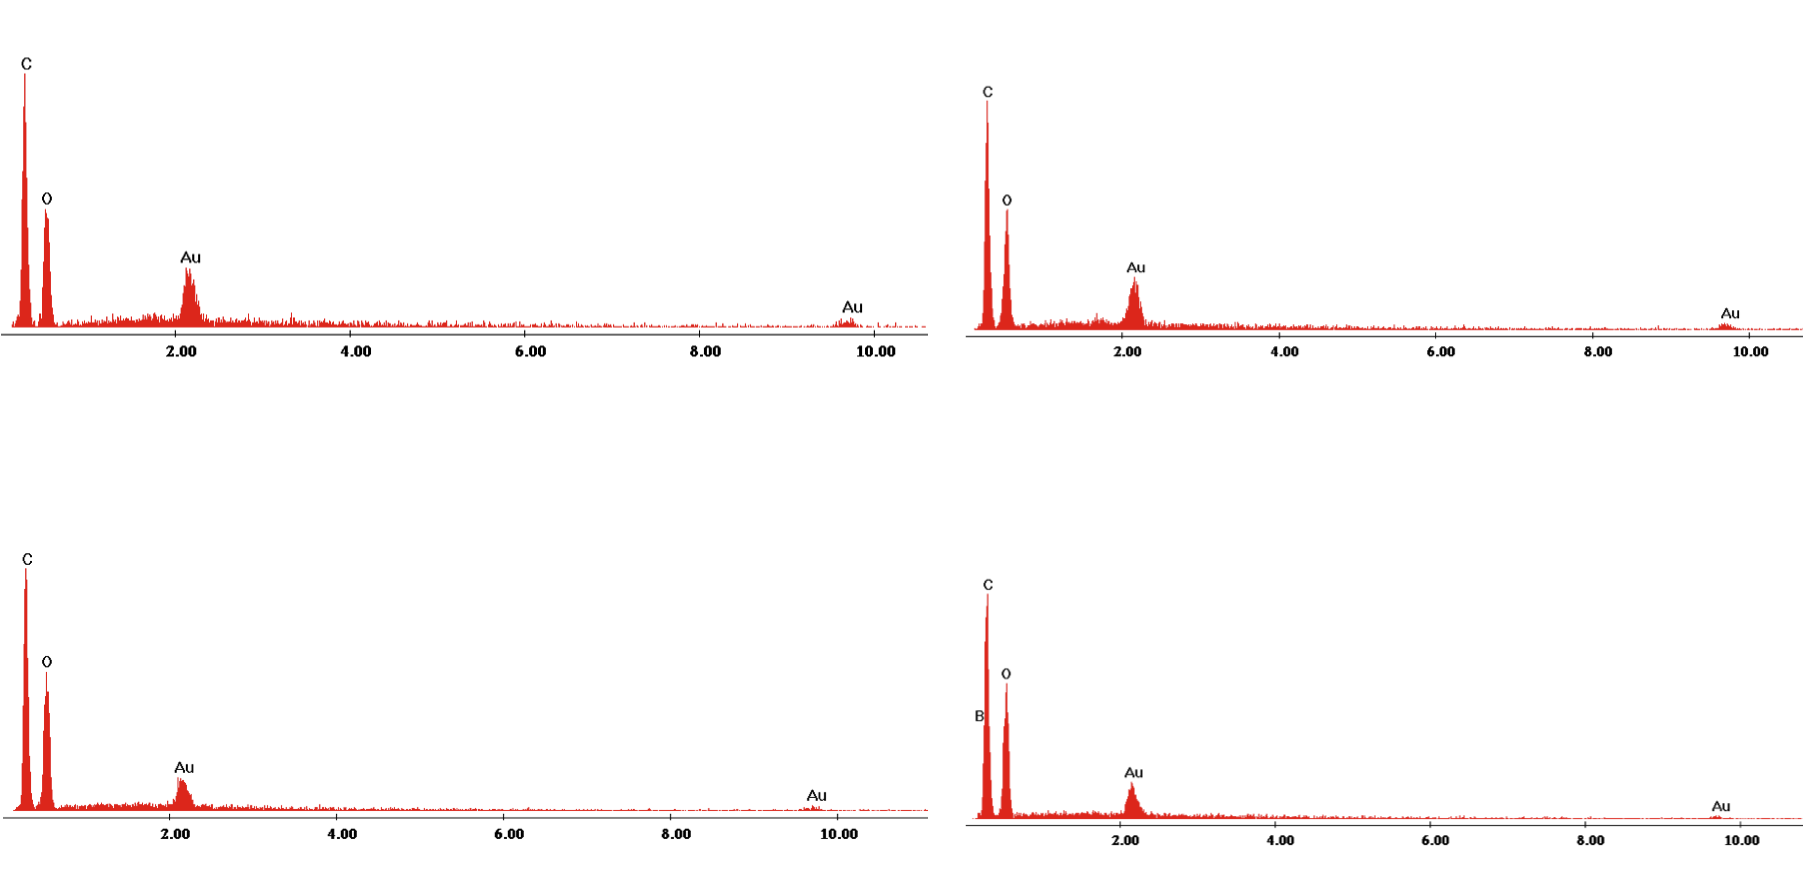
EDAX Analysis for samples A,B,C, and D.
To create a 3D anaglyph, two secondary electron micrographs were collected of the sample, differing only by a tilt of approximately two degrees. Superposition of the images and colorization using Adobe Photoshop CS 6 produced the final anaglyphic image. Secondary Electron images were collected using the Zeiss Auriga Crossbeam SEM at the Institute of Optics at the University of Rochester.
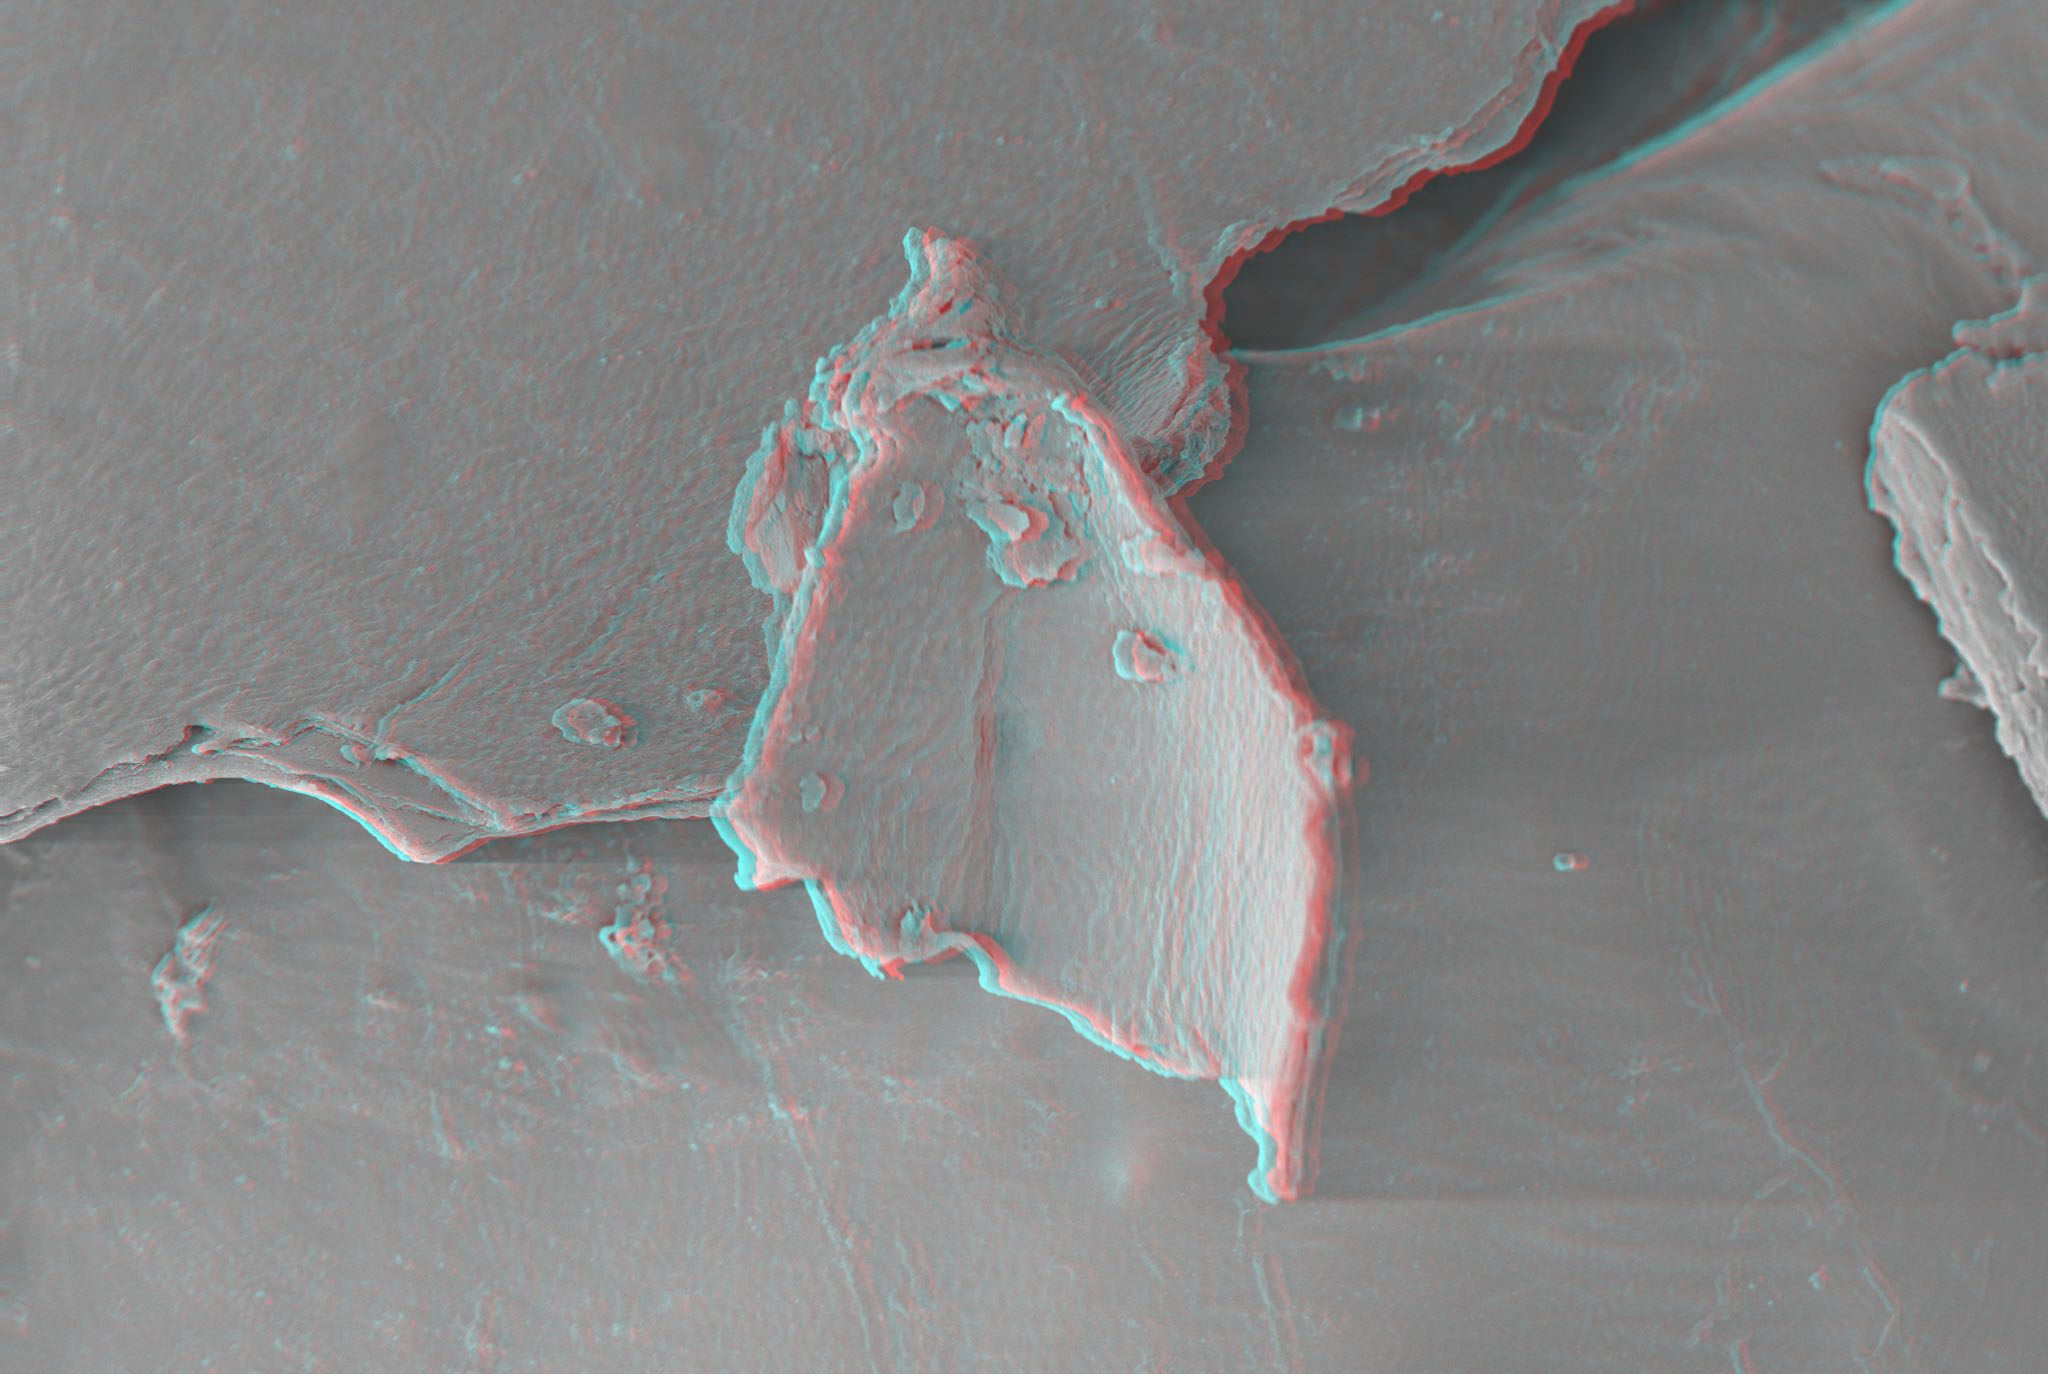
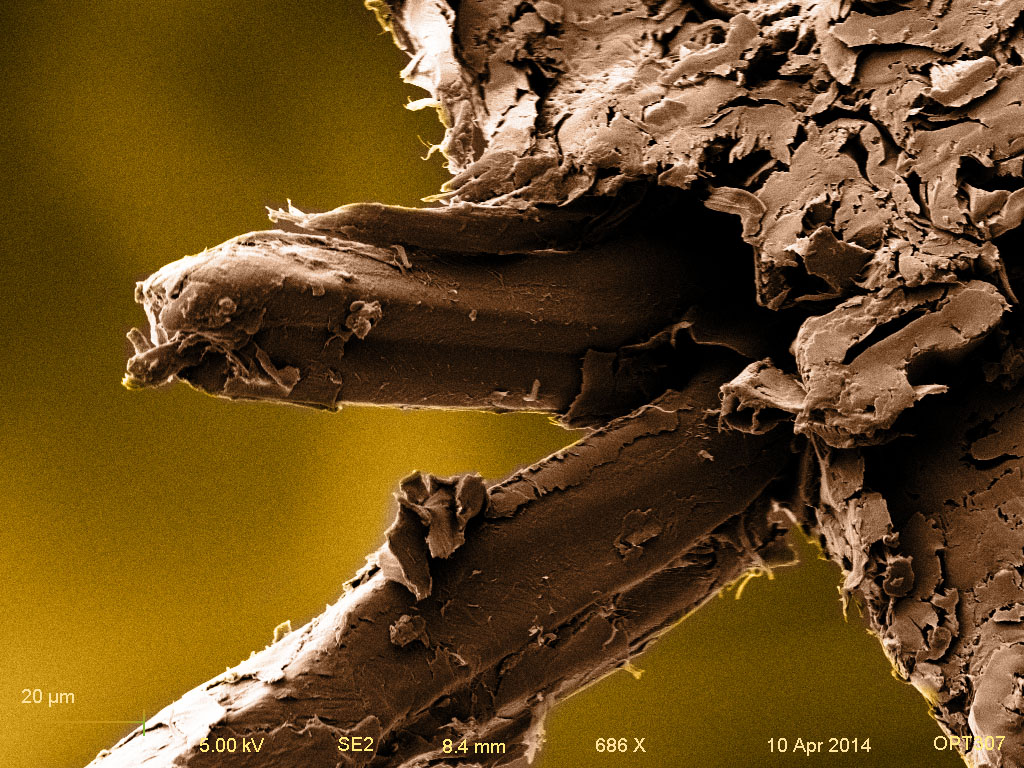
An interesting surface structure.
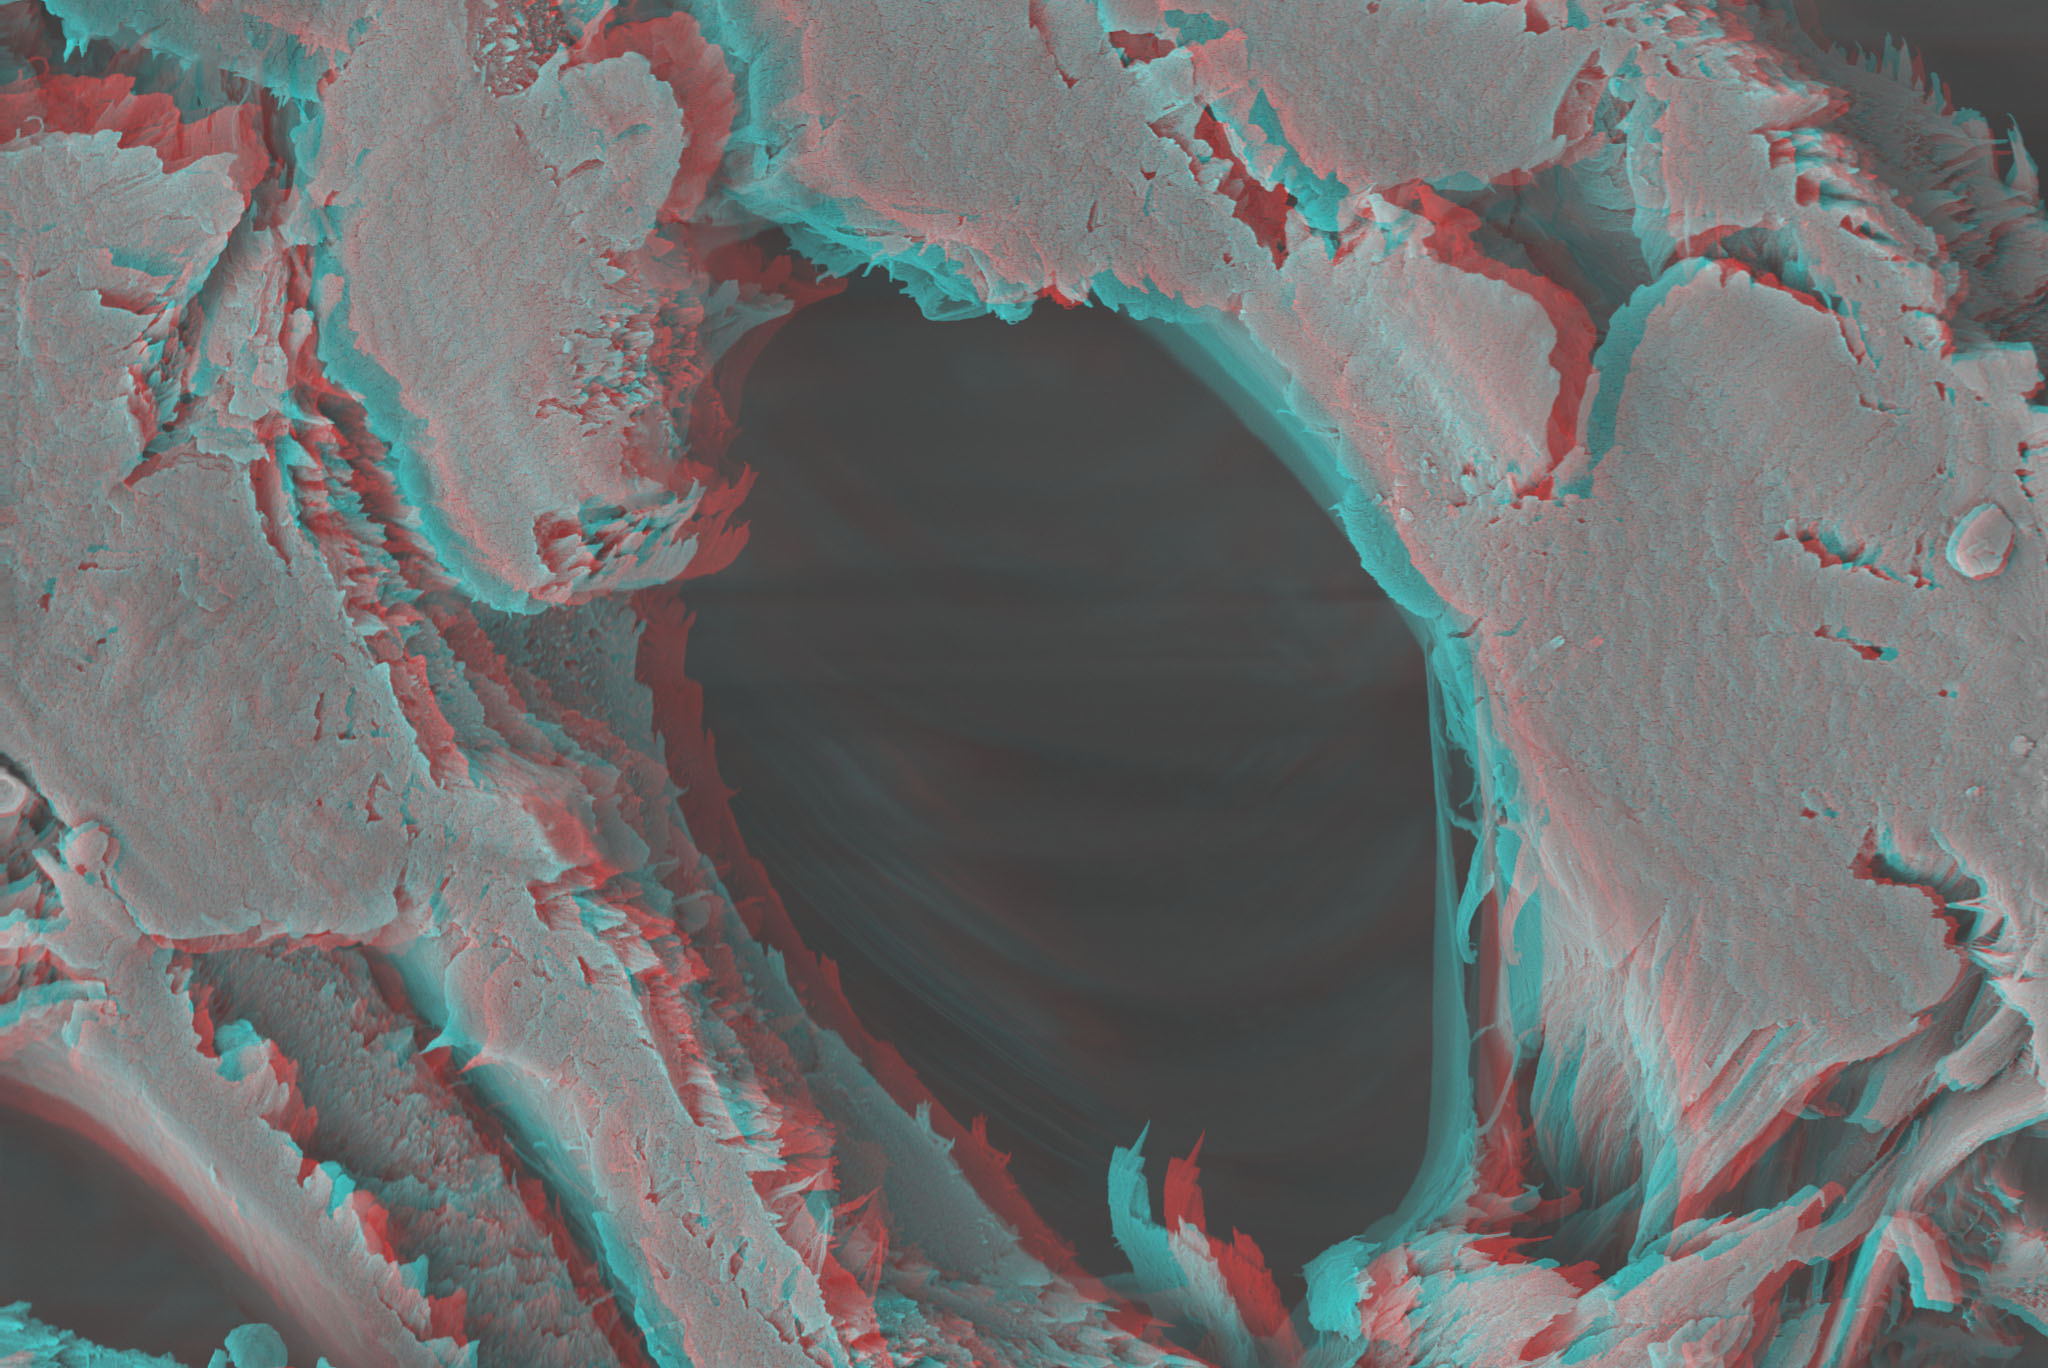
Resin canal opening.
Adobe Photoshop CS6 was used for image colorization.
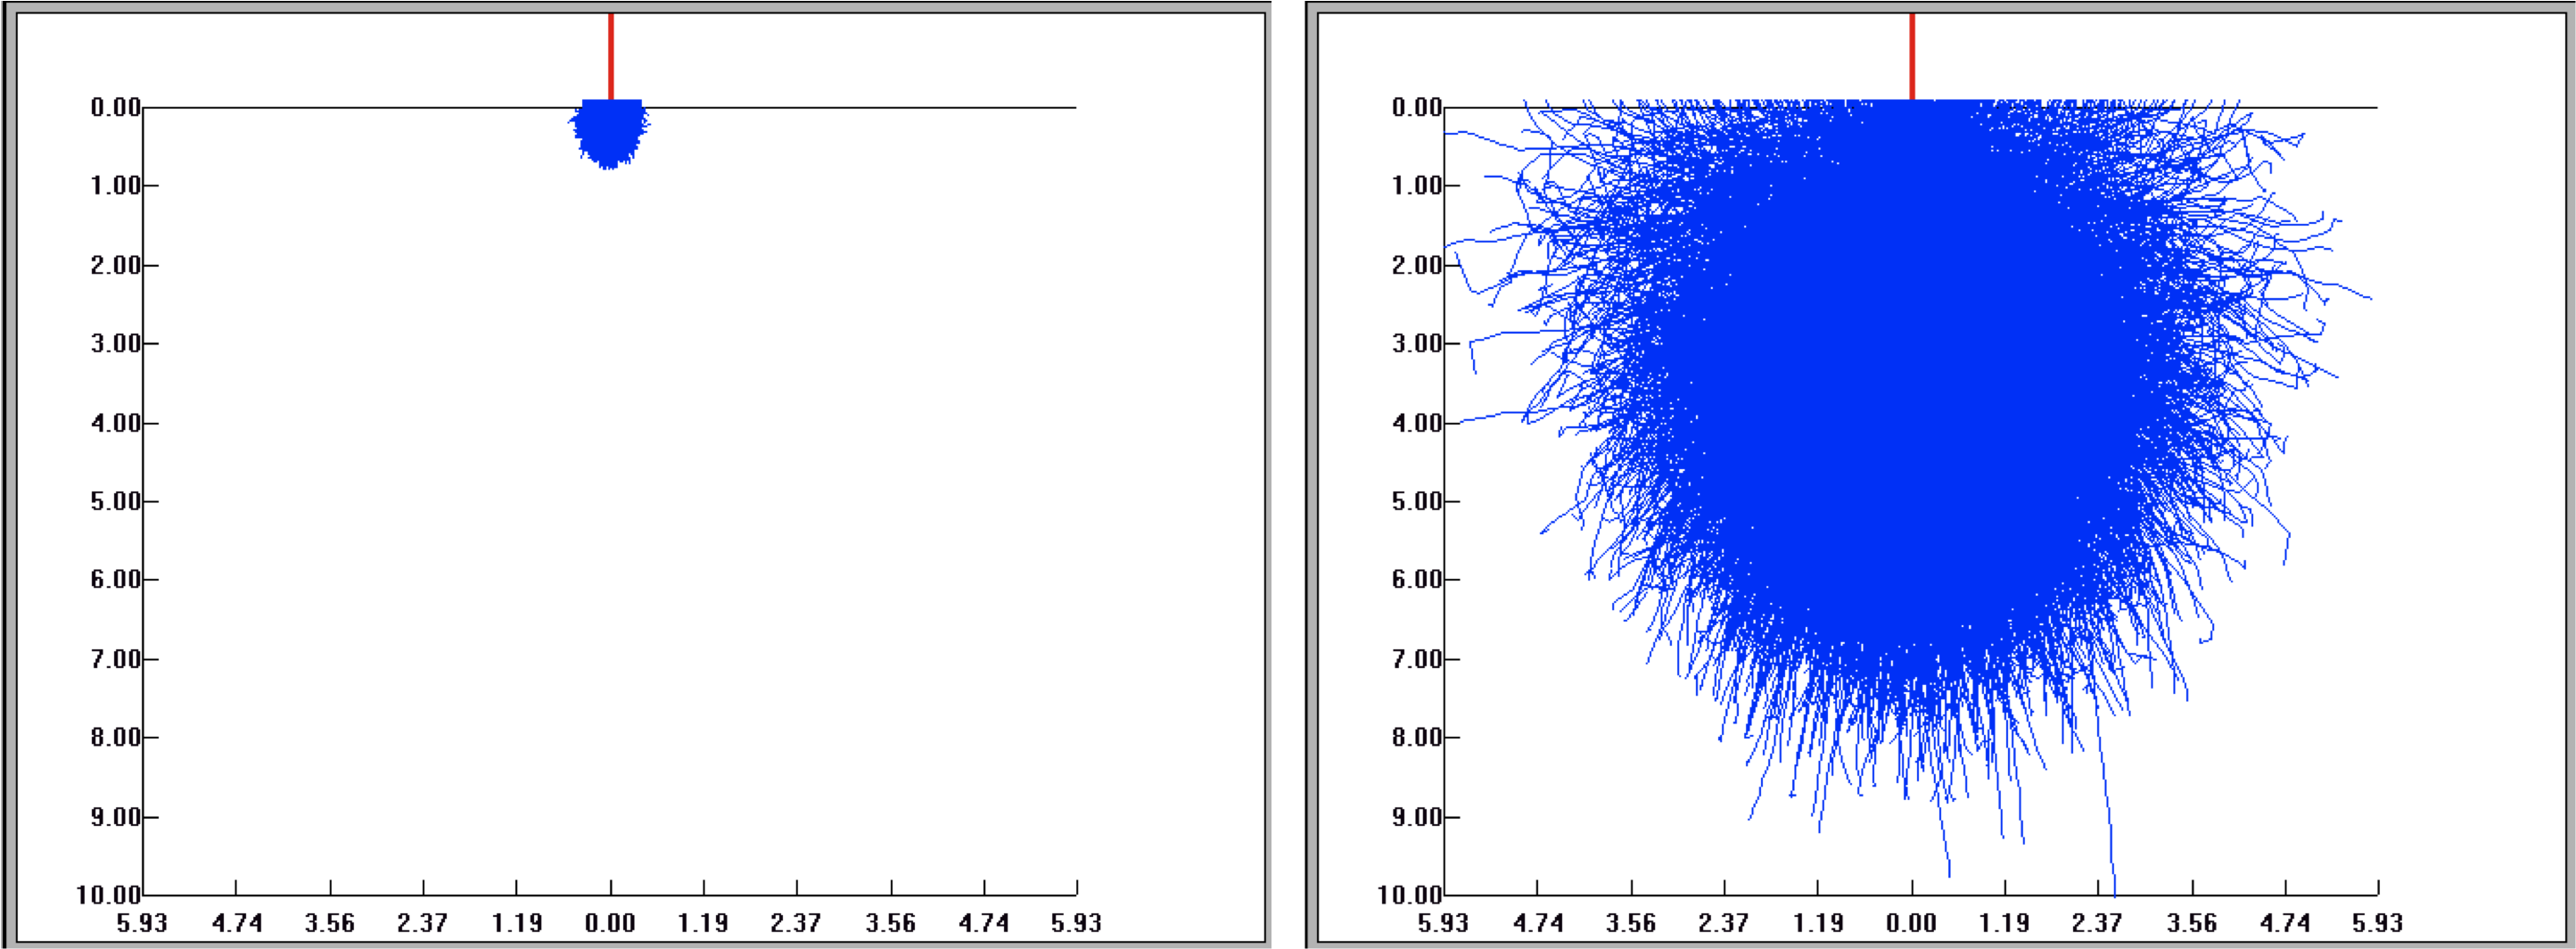
Electon flight simulation was usperfomeding EDS Software owned by the Institute of Optics at the University of Rochester. The electron trajectories were simulated for bulk organic material (wood) at 5kV and 20kV accelleration voltage. The higher accelleration voltage electrons penetrate deeper within the surface of the material, meaning that the there are less secondary electrons generated from the surface.