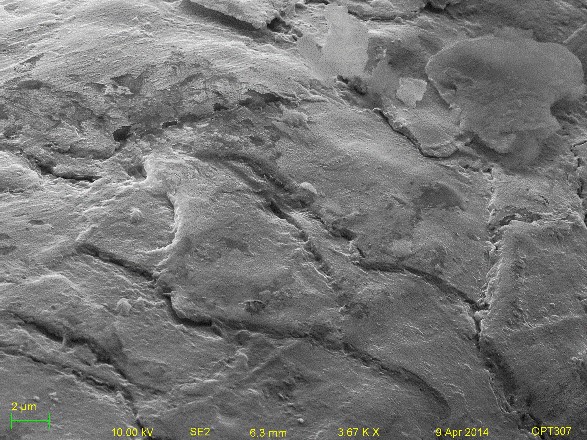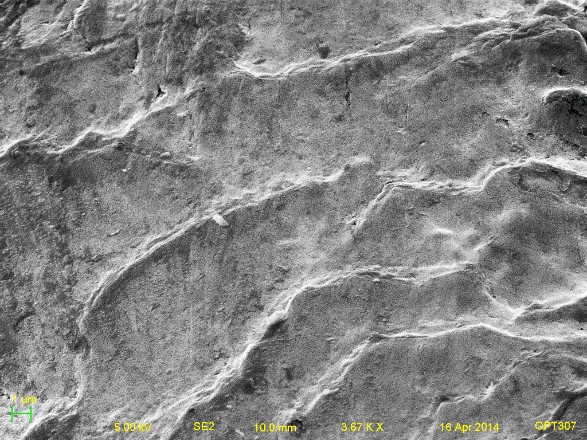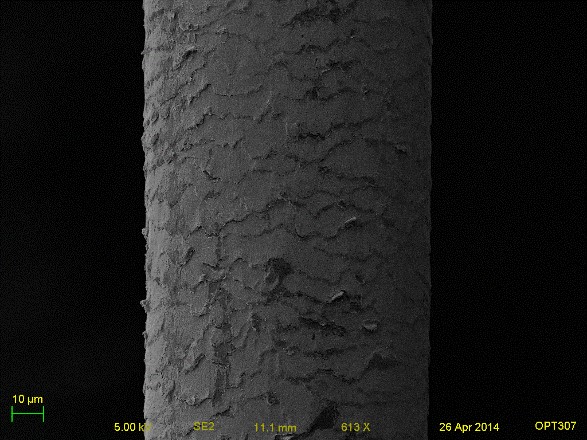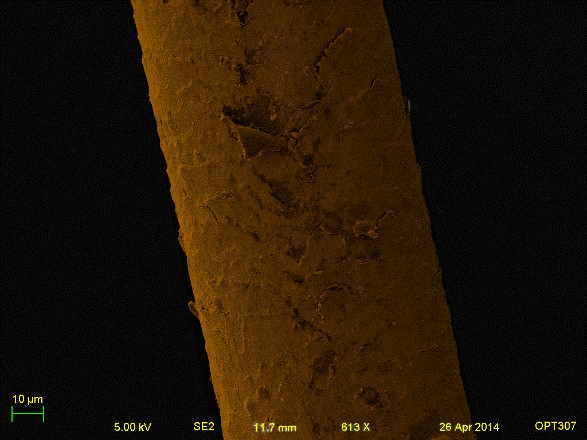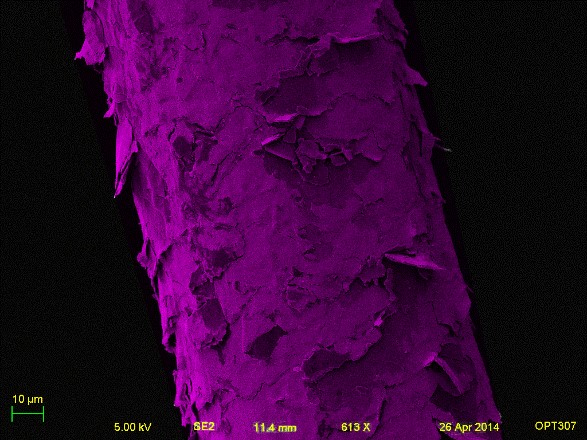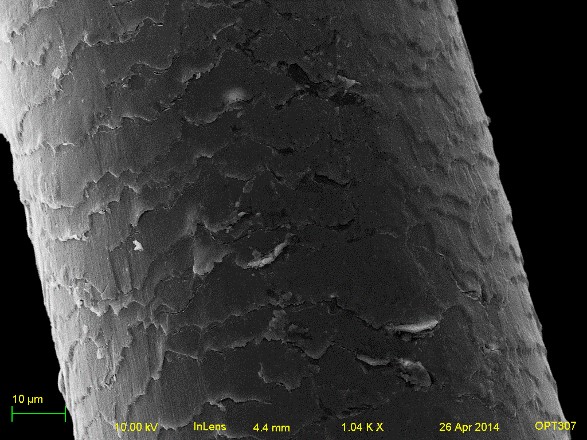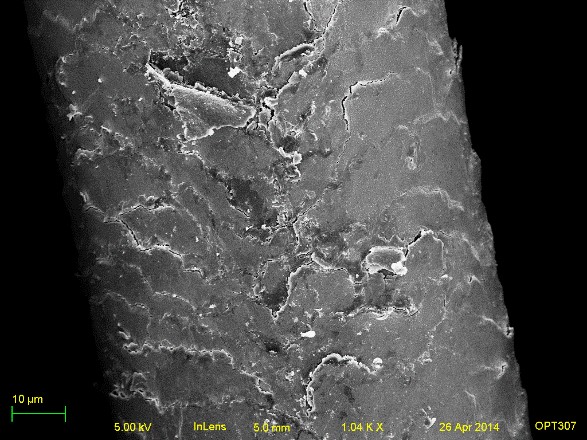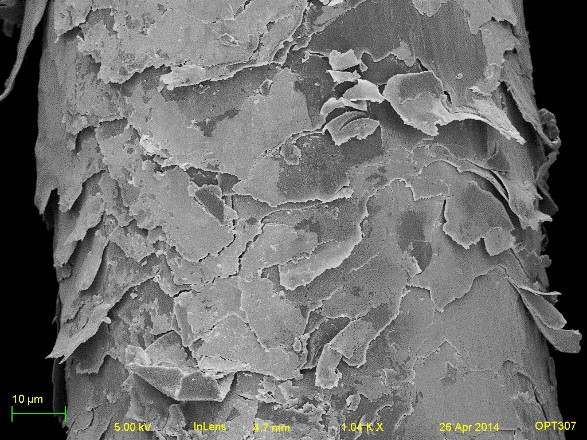
Fig .1 Outer surfaces of SEM images
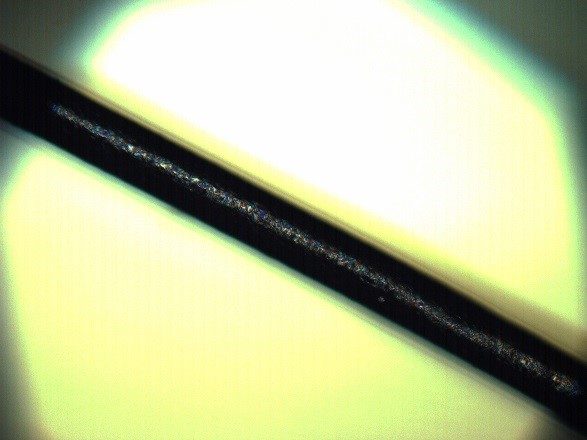
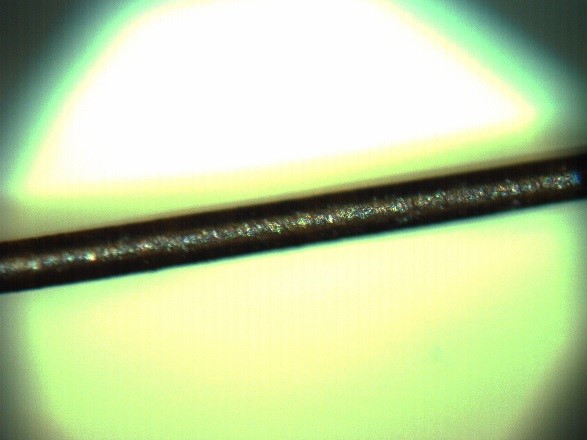

Figure 2. Light microscopy images
Usually, you can feel the difference of hair just by touching. Roughness of the surface was expected microscopically from bleached and colored hair and seen in Figure 1. Layers of the bleached and colored hair (pink) looked like they were peeling off. Even the light microscopy showed the roughness of the pink hair in Figure 2. Between untreated (black) and colored (brown) hair at 3.67kx the layers on the brown hair seemed more filled compared to the black hair. Dye may have closed up the gaps, but it could also be the result of the angle that images were taken. Surprisingly, the brown hair did not show as much difference as the pink hair. It seemed that bleaching was damaging the outer surface more than coloring.| Untreated (Black) |
Colored (Brown) |
Bleached and Colored (Pink) |
|---|
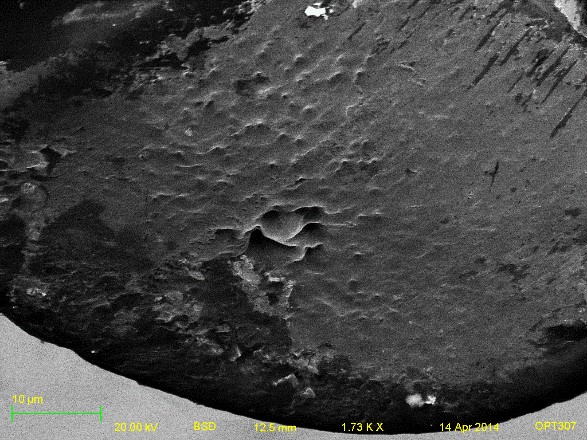
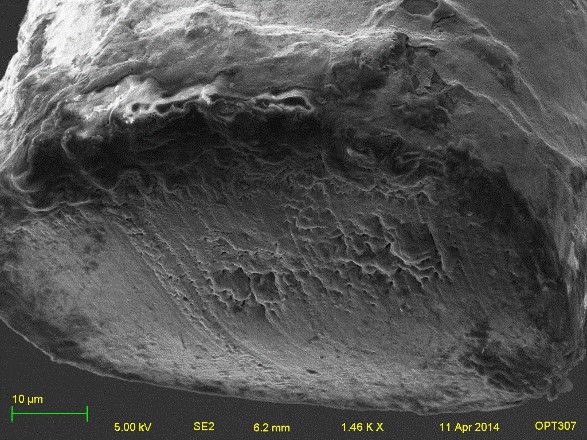
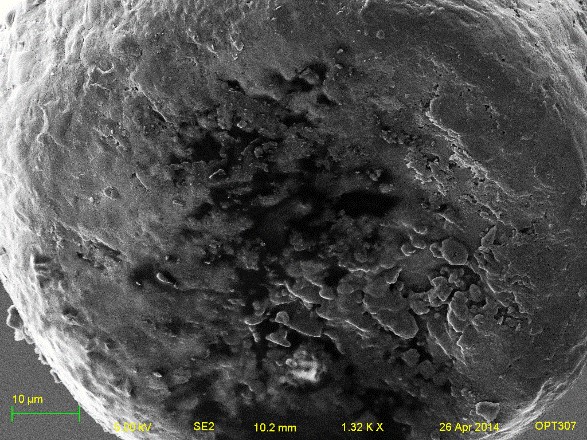
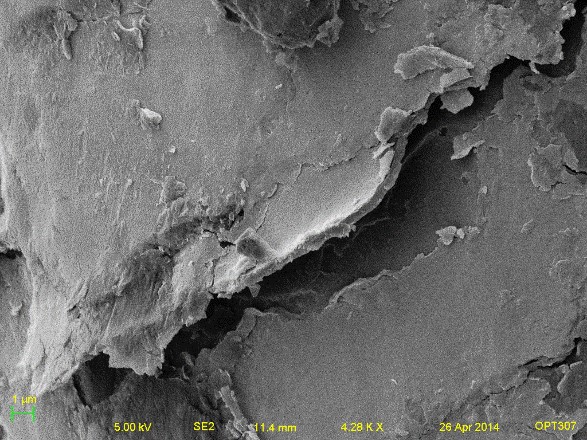
Figure 3. Cross-section SEM images
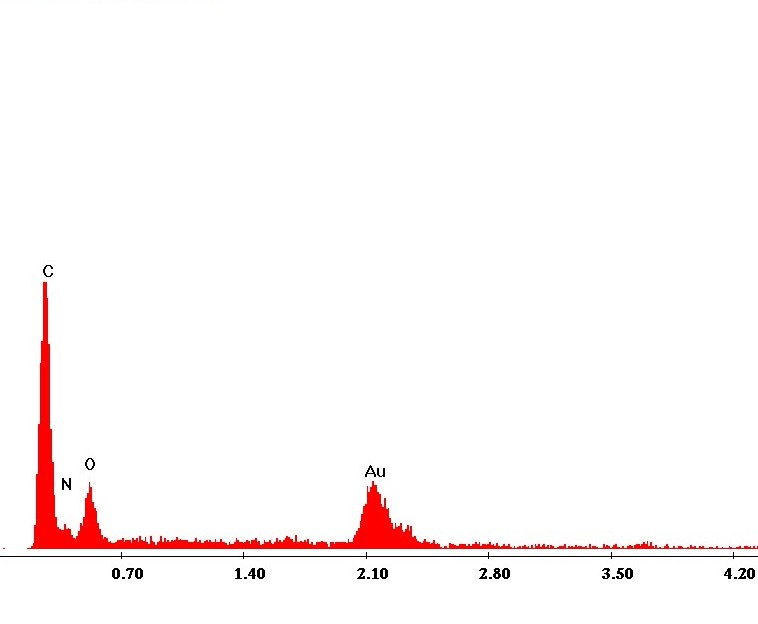
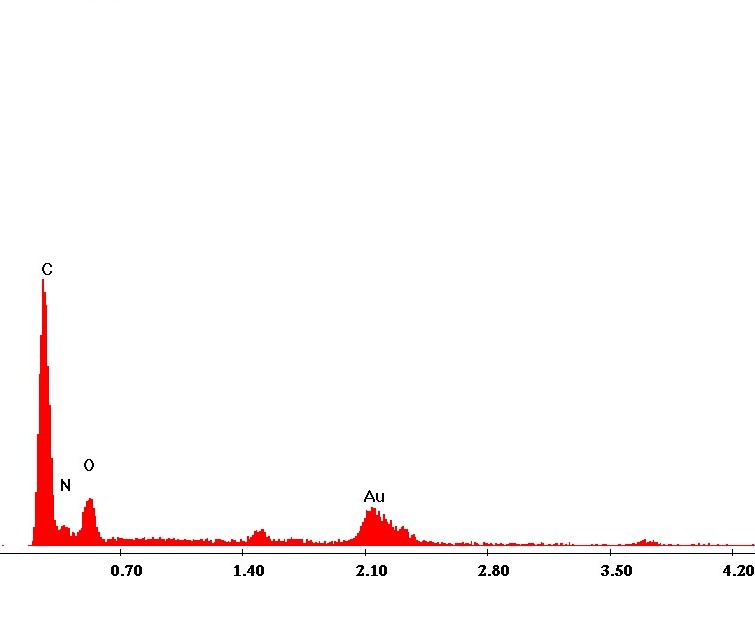
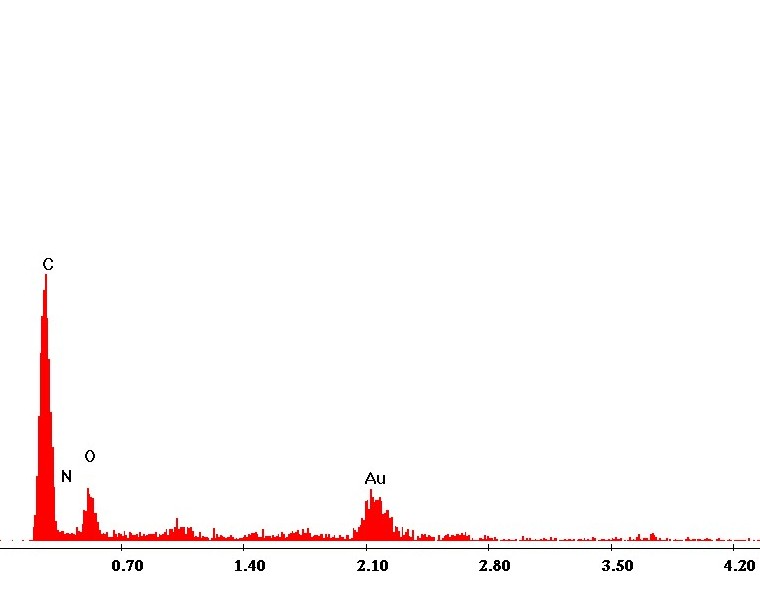
Figure 4. EDS analysis
Unfortunately, no significant difference was found from cross-section area between the samples as seen in Figure 3, although there maybe a dent on the black hair, but not on the others. In the EDS analysis the brown hair had a peak around 1.5 corresponding to aluminum from the stubs. On the other hand, the peak from the pink hair around 1.0 was probably sodium salt from the pink dye.