Thin-skinned
fold-thrust belt type structures rarely incorporate crystalline
basement rocks, however, in the Provo salient of central Utah a thin slice of
basement appears in a foreland thrust sheet. By observing the fracture and
microstructural patterns and mineralizations within samples of this, the Santaquin
Basement Complex of Central Utah, the relative sequencing of these deformation structures,
and the metamorphic grade at which these deformations take place at depth can
be extrapolated. A study of thin sections of the deformed rocks using optical
microscopy revealed several overprinting relationships of fractures and
mineralizations. These mineralizations include quartz veins, chlorite and
epidote mineralizations (found in Greenschist grade deformations), as well as iron
oxide staining (associated with deformation at shallow depths). By further
exploring these findings using electron microscopy, I will determine the compositions
of the fracture fill and continue to learn about the sequencing of events
during the deformation and emplacement of the Santaquin Basement Complex.
2. Regional Geology
The Santaquin basement complex is a slice of metamorphic basement rock
carried in the hanging wall of an external thrust sheet, a highly unusual occurrence in any
fold-thrust belt. This paper identifies and explores the generations of deformation within this
basement complex in order to understand the history of emplacement of the Charleston-Nebo thrust
sheet in which it is carried. Ultimately, the goal of this study is to find the reasons for the
inclusion of this basement slice in an external thrust sheet. In order to do this it is important
to understand the regional structural history of the Provo salient.
The Provo salient is a convex-to-foreland segment of the Sevier Fold-thrust
belt (FTB) located in central Utah. It is made up of associated imbricate thrust faults asymptotic
to a basal decollement and is convex due to basin shape, lithotectonic composition, detachment strength
and other factors (Mitra, 1997; Macedo and Marshak, 1999; Kwon and Mitra, 2012).
The Charleston-Nebo thrust sheet, the leading edge structure of the Provo salient, is the
defining feature of the salient's curvature. It has an approximate 140 degrees of curvature
and accommodates 6 – 10 km of displacement together with significant internal
shortening (Mitra, 1997).The shortening is primarily accommodated by
fault propagation folding, causing the antiformal Santaquin Culmination. This
culmination carries in its core a small slice of Precalibrin basement derived
from the miogeoclinal shelf hinge, which was included as the thrust cut up
section (Mitra, 1997; Haldar, 1997; Kwon, 2004).
This basement section,
which this project focuses on, is primarily composed of pegmatitic gneiss. There is some
evidence suggesting
east-west variation of composition of the Santaquin basement complex ranging
from amphibolite, to pegmatitic gneiss and biotite schist (Nelson et al., 2002).
Three phases of deformation are represented in this basement slice, including a primary
gneissic foliation, Greenschist grade featuring and mineralization, and lastly Iron oxide
bearing fractures. This study focuses on the last two stages of deformation, and the
mineralizations produced.
Fig. 1. Regional map of the Sevier FTB.
Samples were collected from an external thrust sheet in the Provo Salient of central Utah.
(Kwon, 2004).
Fig. 2. Geological map of the Santaquin
field area. Field locations are marked on the topographic map. Thin section samples were collected
from outcrops S6, S7, S8, S11 and S14. Hand samples from outcrop S2, S6 and S10 were also analyzed.
3. Methods
The
samples analyzed by scanning electron microscopy (SEM) for this lab included
ultra-thin polished sections s6.1, s7.1, s8.3, s11.1a, and s14.2. Slides were
viewed using an optical microscope, and photomicrographs of areas of interest collected
prior to SEM preparation. The regions to be observed were marked on the thin
sections to make navigating under SEM observation simpler. Each of these
samples was prepared by mounting on an SEM stub with conductive adhesive.
Hand samples were also prepared in this manner. Then
the samples coated with carbon evaporate to provide an even conductive surface.
The samples were then loaded into the Zeiss Supra 40VP SEM
and images were recorded. Each sample was imaged
using the secondary electron (SE2) detector at working distances of 10mm and
processed at 20kv. In addition to these images, the thin sections were also
processed with the backscattered electron (BSE) detector at 15mm working
distance and in a 20kv setting. X-Ray analysis was conducted on whole rock and
thin section samples containing pertinent compositional information. Both
spectra and compositional maps were collected using EDAX electron dispersive
spectrometry.
The use of Optical and Scanning Electron Microscopy can examine
the overprinting of structural features to determine a sequence of events. These relationships,
as shown by optical microscopy, reveal a tectonic history through the overprinting relationships
of foliations, fractures and mineralizations. Fractures include three different types of cracks;
transgranular, grain boundary, and intragranular. What type of fracture occurs is dependent on
the mechanical properties of the grains involved, and the applied stress (Mitra, 1978). Grain
boundary fractures form between grains, transgranular fractures form through multiple grains,
and intragranular fractures form within a grain (Mitra, 1978). Transgranular and grain boundary
type fractures are equally common. The typical overprinting relationships seen in thin section
involved fractures cutting the tectonic foliation and fractures cross cutting other fractures.
By identifying the type of mineralization within the fracture it was possible to identify timing
relationships.
The non-microscopy methods used in this project include: thin sample
preparation, and carbon evaporate coating.
The microscopy techniques used in this project include: optical light microscopy, reflected
light microscopy, secondary electron SEM, backscatter electron SEM, X-Ray spectrometry and EDS electron mapping.
References:
Haldar, J.K. (1997). Evolution of Late
Crecaceous-Paleocene nonmarine deposystems in the Thistle wedge-top basin, East
Central Utah. Master's Thesis, University of Arizona.
Kwon, S. (2004). Three-dimensional
evolution of a fold-thrust belt salient: Insights from a study of the geometry,
kinematics and mechanics of the Provo salient, Sevier belt, Utah, and from
three-dimensional finite element modeling. Available
from Dissertations & Theses @ The University of Rochester
Kwon, S. and Mitra, G. (2012) An alternative
interpretation for the map expression of "abrupt" changes in lateral
stratigraphic level near transverse zones in fold-thrust belts. Geoscience
Frontiers, Feburary, 2012. P. 401 – 406.
Macedo, J., and Marshak, S., 1999, Controls on the geometry of fold-thrust
belt salients. Geological Society of America Bulletin, v. 111,
p. 1808-1822
Mitra, G. (1978). Ductile deformation zones and
mylonites; the mechanical processes involved in the deformation of crystalline
basement rocks. American Journal of Science, v. 278, p. 1057 – 1084
Mitra, G. (1997). Evolution of salients in a
fold and thrust belt: the effects of sedimentary basin geometry, strain
distribution and critical taper. Evolution of Geological structures in Micro-
to Macro-scales. 1997, p. 59 – 90.
Results
1.
Overview
All thin section samples were viewed using an optical
microscope prior to preparing them for SEM. The composition of veins provided by
optical and reflected light microscopy was corroborated by spectral analysis.
SEM provided textural information on the hand samples, which proved to be more useful
than the compositional analysis. Images were collected of fractures and
veins from all samples. Fracture surfaces of hand samples were imaged to obtain mineral
growth and textural information.
2.
Light and Reflected Light Microscopy
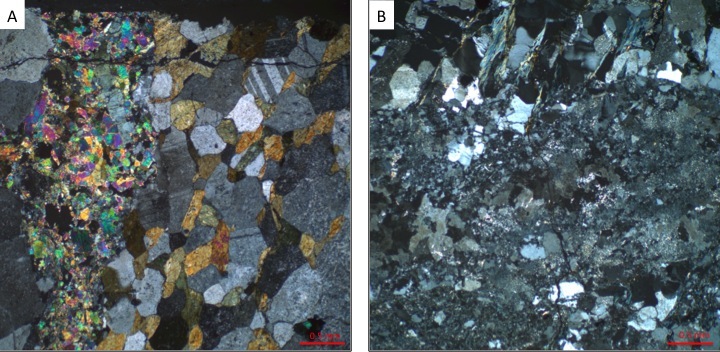
Light microscopy suggested that there were three primary fill types for
veins and fractures. These fills included chlorite, epidote, and quartz. These features can be seen in figure 3A, and
figure 3B. A fourth mineral fill type was identified, but reflected light microscopy was needed to confirm mineralogy.
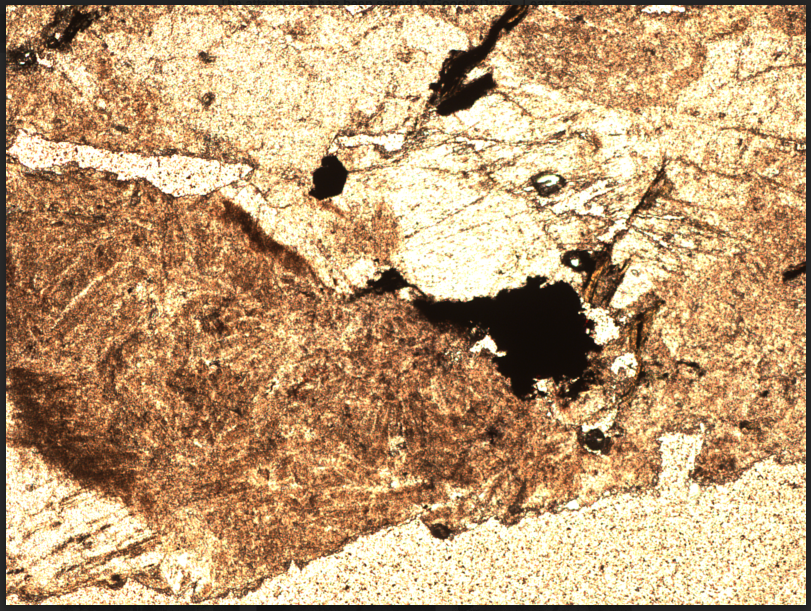
This fill type was magnetite, which oxidized to hematite (figure 4).
>
Fig. 3. Optical photomicrographs of thin sections s11.1a and s14.2. epidote
fill can be seen in (A) and quartz and chlorite mineralization can be seen in (B).
>
Fig. 4. Reflected light photomicrograph of
a thin section containing hematite and magnetite.
3. SE2 and BSE
Secondary electron (SE2) and bacscattered electron (BSE) detectors were used to further
analyze these samples.
The samplese processed included all hand samples and thin sections.
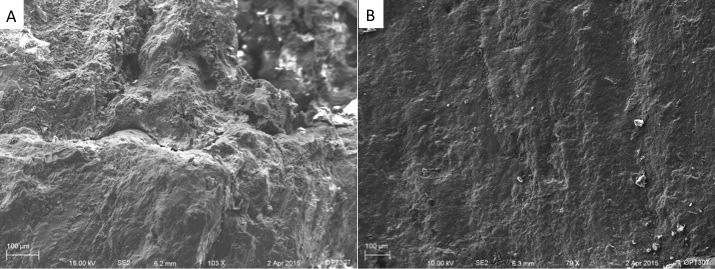
SE2 imaging of hand samples showed quartz surfaces were activated as micro faults. These surfaces show signs of
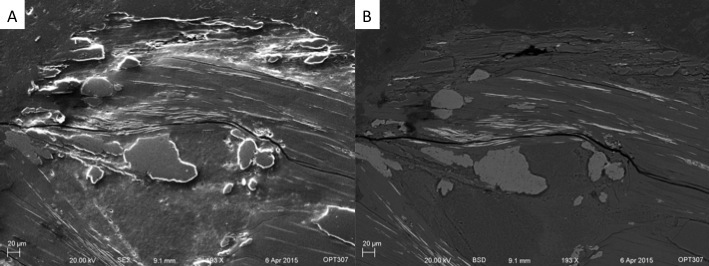
polishing and grooving due to repeated slip (figure 5). Chlorite veins, in thin section samples, were
processed using both the SE2 detector and the BSE detector (figure 6). Bright spots appearing in BSE required further
analysis.
Fig. 5. Scanning electron photomicrographs of a hand sample containing
a quartz surface. (A) indicates grooving in cross section. (B) polished surface do to repeated slip and
friction.
Fig. 6. Cross section of chlorite vein in thin section. (A) SE2 image shows some
relief in the figure, this is due partially to how the sample was polished, and the hardness of the minerals represented.
(B) BSE image; bright spots are appearing in the chlorite mineral growth, this is unusual.
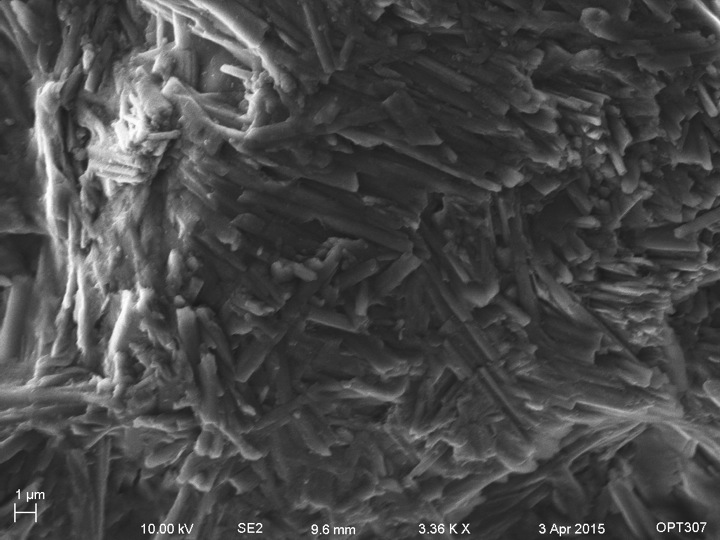
SE2 images of epidote surfaces show unusual mineral growth (figure 7).
The elongated habit of the epidote crystals are likely due to the opening nature of the fracture,
and the elevated temerature at which the crystals formed. This is something that was not visible under an
optical microscope.
Fig. 7. Surface of a hand sample displaying
unusual epidote growth.
4. X-Ray analysis
X-Ray analysis was done on a number of samples to confirm composition
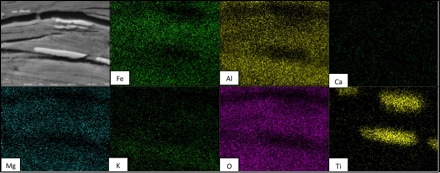
of vein material. The primary subject of compositional analysis was veins containing chlorite. As mentioned
previously, there were unusually bright particles appearing under BSE. EDS mapping of these areas proved them to be a
titanium oxide, rutile (figure 8).EDS maps were collected from a working distance of
10 mm, with a takeoff angle of 43.3o
takeoff angle. The acquisition time varried depending on the area of collection
>
Fig. 8. EDS maps of interstitial rutile in a chlorite vein.
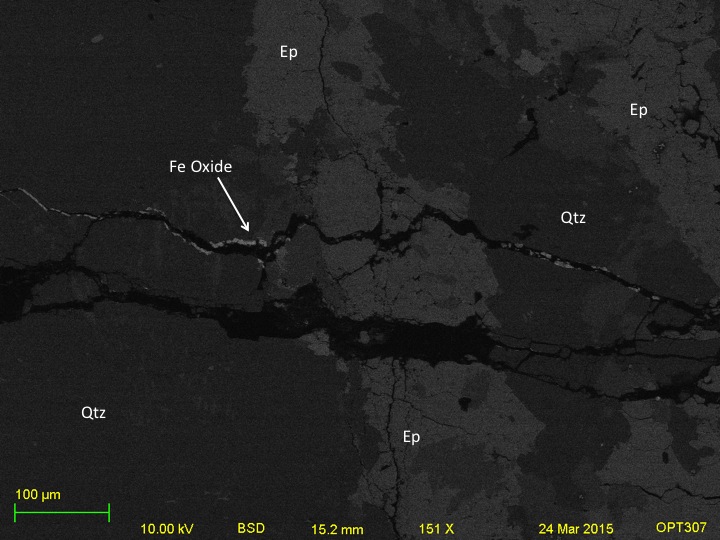
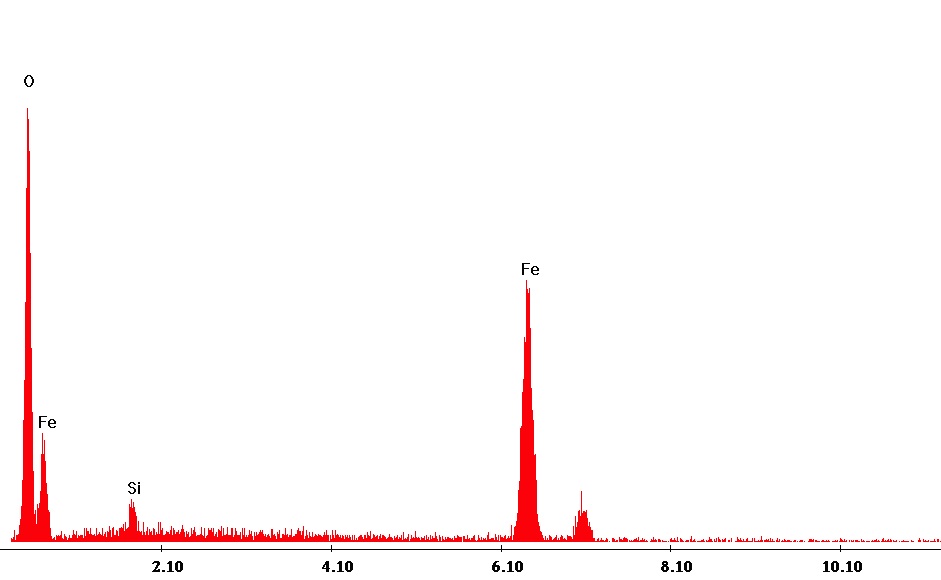
The composition of iron oxide in late stage veins was
confirmed by collecting X-Ray spectra on a similar vein
in a different thin section.The secondary collection was done on thin section s8.1. A BSD photomicrograph was collected to use
as a reference for spectral analysis (figures 9 and 10).
>
Fig. 9. BSE photomicrograph of thin section s8.1 showing high
reflectivity of vein material (indicated by arrow).Composition of labeled phases were confirmed with X-Ray spectral analysis. The vein in
question cross cuts a previous mineralization, and epidote vein.
>
Fig. 10. X-Ray spectra of vein composition in figure 9. This confirms the
observations made with reflected light microscopy.
5. Conclusions
A number of samples were prepared for observation using optical, reflected light, and scanning
electron microscopy. These samples included both thin sections and hand samples from a variety of outcrops in the Santaquin Basement
Complex. These samples were prepared for observation by coating them with carbon evaporate.
Three generations of deformation were identified using the afore mentiond
microscopy techniques. The first, not discussed in this work, was a tectonic foliation that did not produce any veins.
All later events cut through this fabric. The second generation of deformation was the primary cause of fracturing and mineralization.
This second phase resulted in several different kinds of mineralization. Minerals accumulated in veins and fractures include quartz,
epidote, and chlorite. Observation under SEM showed that each of these mineralizations had unique characterisstics. Quartz (figure 5)
was used as a slip survace for microfaulting events. Grooving and polished surfaces resulted from this activity. Epidote, (figure 7)
displayed elongated crystal habit from an elevated temperature during formation. Chlorite (figures 6 and 8) showed evidence of interstitial
rutile, which is an unusual occurence. Conclusions as to why there is excess titanium present in the rock cannot be made from this study.
The third generation of deformation resulted in fractures cross cutting both previous events (figure9). This final phase
was initially identified as magnetite under reflected light microscopy (figure 4). BSE and X-Ray spectrometry confirmed this conclusion.
6. Summary
The three generations observed in hand sample and outcrop were confirmed during this
observation using a variety of microscopic methods. Compositions of veins from multiple phases of deformation were confirmed. These
compositions include quartz (SiO2), epidote (Ca2(Al3)Si3O12(OH)), Chlorite (Fe2Al4Si1O10(OH)4), and magnetite (Fe2O4). Intersitial rutile
(TiO2) was also identified.
Acknowledgments
I Brian McIntyre for his endless patience, Gerry Kloc for preparing so many thin sections,
and Gautam Mitra for suggesting this project to me.
Please contact me if you
have any questions, criticism or suggestions:
Jenna Kaempfer
Hutchison Hall 227
Earth & Environmental Sciences
University of Rochester
Rochester, NY 14627
(303) 718-4012
jkaempfe@u.rochester.edu
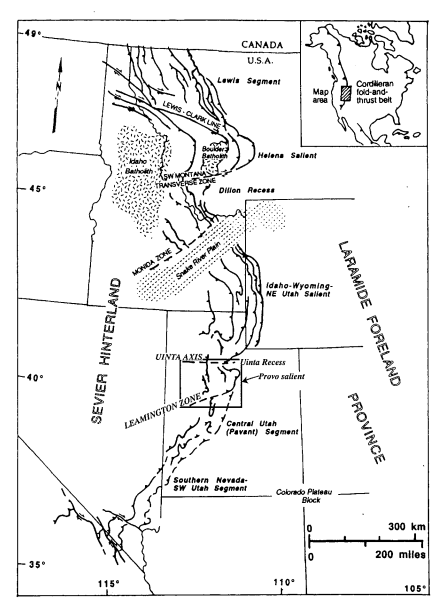 Fig. 1. Regional map of the Sevier FTB.
Samples were collected from an external thrust sheet in the Provo Salient of central Utah.
(Kwon, 2004).
Fig. 1. Regional map of the Sevier FTB.
Samples were collected from an external thrust sheet in the Provo Salient of central Utah.
(Kwon, 2004). 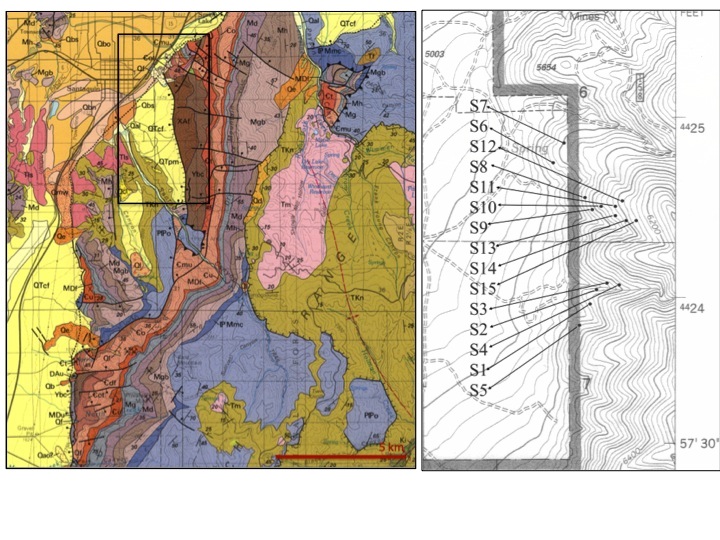 Fig. 2. Geological map of the Santaquin
field area. Field locations are marked on the topographic map. Thin section samples were collected
from outcrops S6, S7, S8, S11 and S14. Hand samples from outcrop S2, S6 and S10 were also analyzed.
Fig. 2. Geological map of the Santaquin
field area. Field locations are marked on the topographic map. Thin section samples were collected
from outcrops S6, S7, S8, S11 and S14. Hand samples from outcrop S2, S6 and S10 were also analyzed.
 >
>
 >
>
 >
>
 >
>
 >
>