Imaging Quantum
Dots on Buckyballs and Nanotubes
University of
Rochester, Rochester, NY
by Caleb Whittier
OPT307/407
Spring 2016
Individual
Project
| Proposal | Results |
Quantum dots (QDs) are semiconducting nanocrystals with unique optoelectronic properties, with potential applications in LEDs and biological imaging. Carbon nanotubes (CNTs) are graphene layers rolled into a tube formation, and are well-known for their high tensile strength and nature as a lightweight material, lending them use in strengthening other materials. Buckyballs are hollow carbon spheres comprised of 60 carbons, and have not yet been widely implemented.
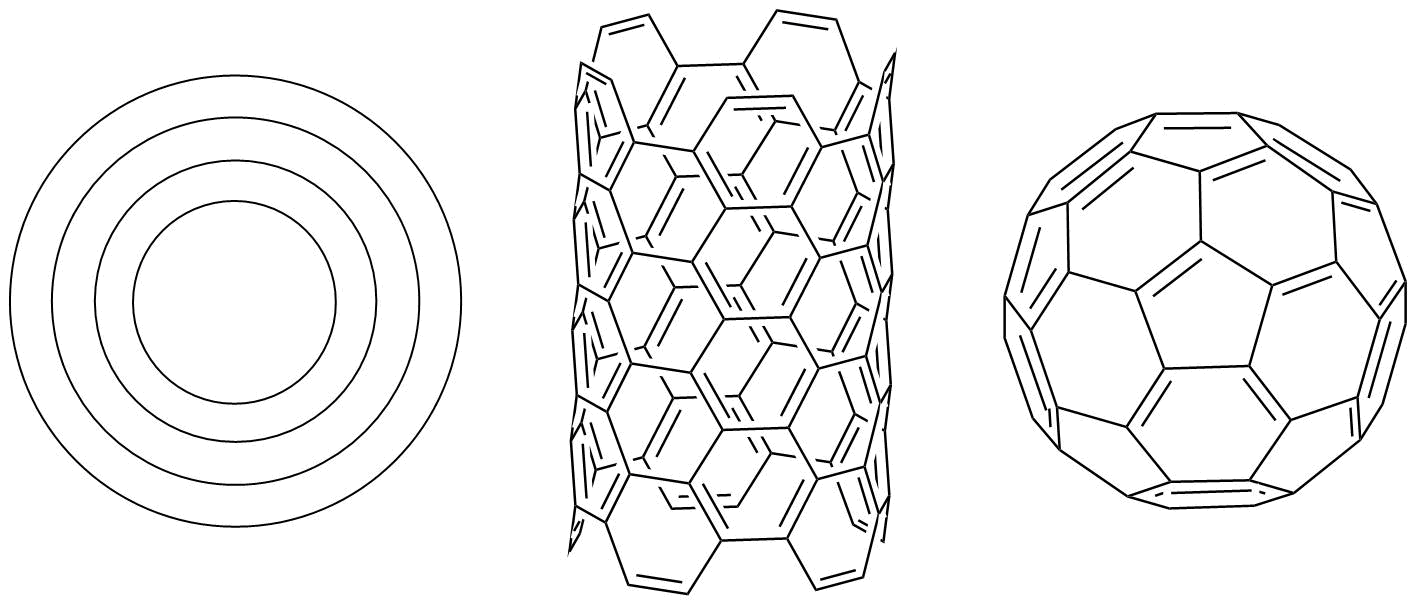
Fig.
1. From left to right, see a core/shell quantum dot, carbon
nanotube, and buckyball.
It is possible to use chemical techniques to connect QDs to both CNTs and buckyballs. By doing so, it may be possible to partially combine the properties of these structures. In this project, simplistic techniques were used to connect the structures, and resulting samples were imaged in the TEM to confirm the project's success.
CdSe/CdS
core/shell QDs were obtained from Kelly Sowers of the Krauss Group. The
QDs were diluted in toluene (~10mL), and a small amount (0.2mL) of them
were were bath sonicated in the
presence of single-walled CNTs or buckyballs (<1mg) in a
solution of
1-methyl-2-pyrrolidone (~10mL) to
break up large clumps of buckyballs/CNTs. The resultant sample was then
probe sonicated to create full dispersion and connection between
nanoparticles. Three drops of each sample were then placed on a gold
TEM grid and allowed to air dry. Data collection was acquired on the
University's TEM system, and electron flight simulations were performed
on the SEM computer.
Electron flight simulation was performed for CdSe and CdS to allow for a projection of interactions between the electron beam and sample. TEM imaging was performed to evaluate the chemical treatment. Using the knowledge that the QDs were ~7nm in diameter and that the buckyballs were ~20nm in diameter, areas were searched for showing a connection between particles of roughly these sizes. For QD/CNT samples, areas were searched for that showed QDs attached to tubular structures, and lattice was searched for in the tubes to differentiate between organic matter and CNTs. Images were colorized using the ImageJ program. X-Ray microanalysis was performed to confirm the chemical nature of the samples. The TEM's STEM setting was utilized to allow for elemental mapping of the QD and buckyball sample.
Electron
flight simulation shows how the electrons scatter through the sample
upon entrance, and as such helps to understand how certain microscope
conditions affect the imaging. Bars on the right side represent x-ray
emissions from the sample’s chalcogenide component (Se or S).
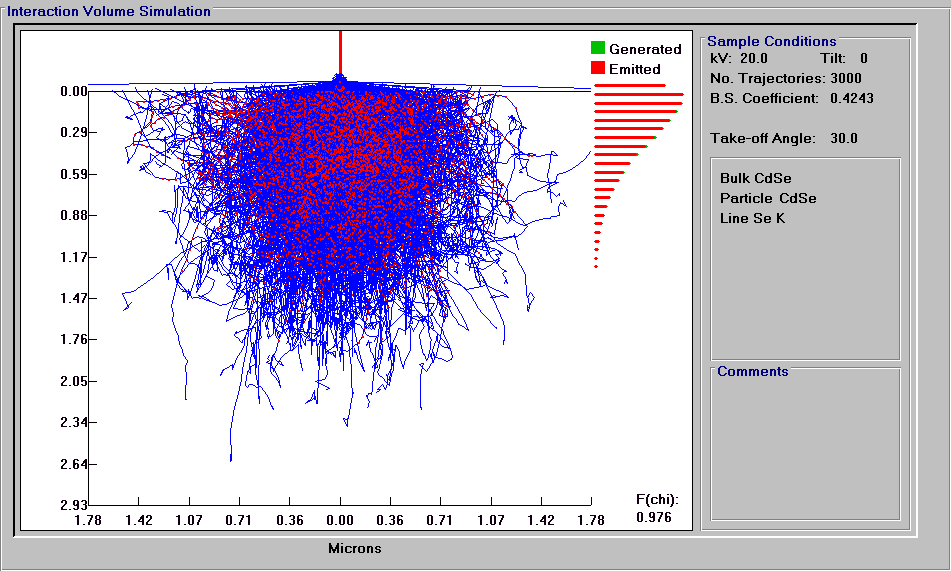
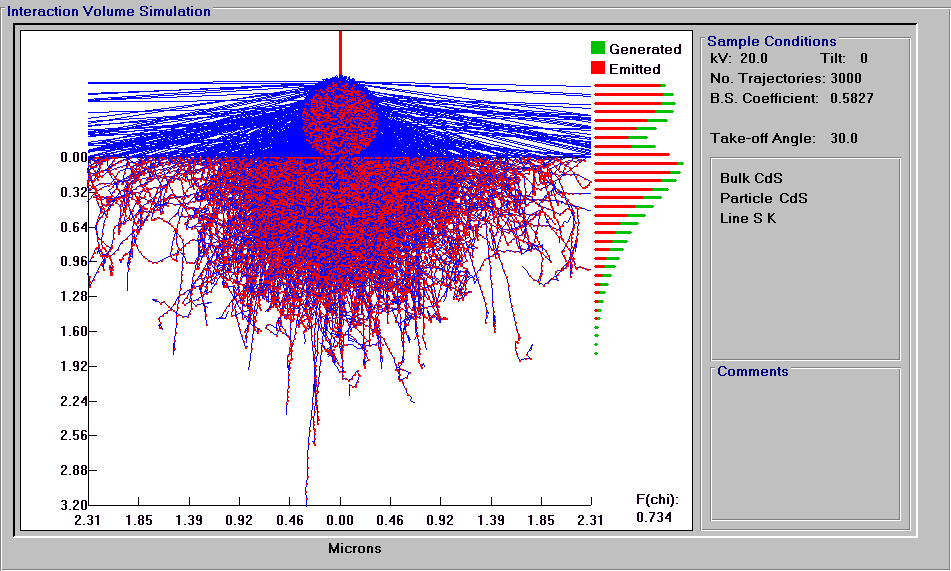
Fig. 3. Electron flight simulation of a spherical CdS particle atop bulk CdS.
Due to the sample's nature and the utilized imaging techniques, the resultant electron flight simulations required some tweaking. For example, the spherical particles could not be simulated at their proper size, as it would be too small for the simulator to yield legible data for. Furthermore, if using a 200kV beam in the simulator as was used in the TEM, the resultant data barely showed the particle. In order to receive some data rather than no data, parameters were adjusted to be a 20kV beam in the simulator, a 70nm CdSe particle (Fig. 2), and a 700nm CdS particle (Fig. 3). These values were chosen as they were different from the actual values by only an order of ten (in the case of CdS, an order of 100).
TEM
was utilized at 200kV
for all samples, which were deposited on gold TEM grids. Samples imaged
were a composite of QDs and buckyballs, as well as composites of QDs
and CNTs.
Images were colorized using the ImageJ program.
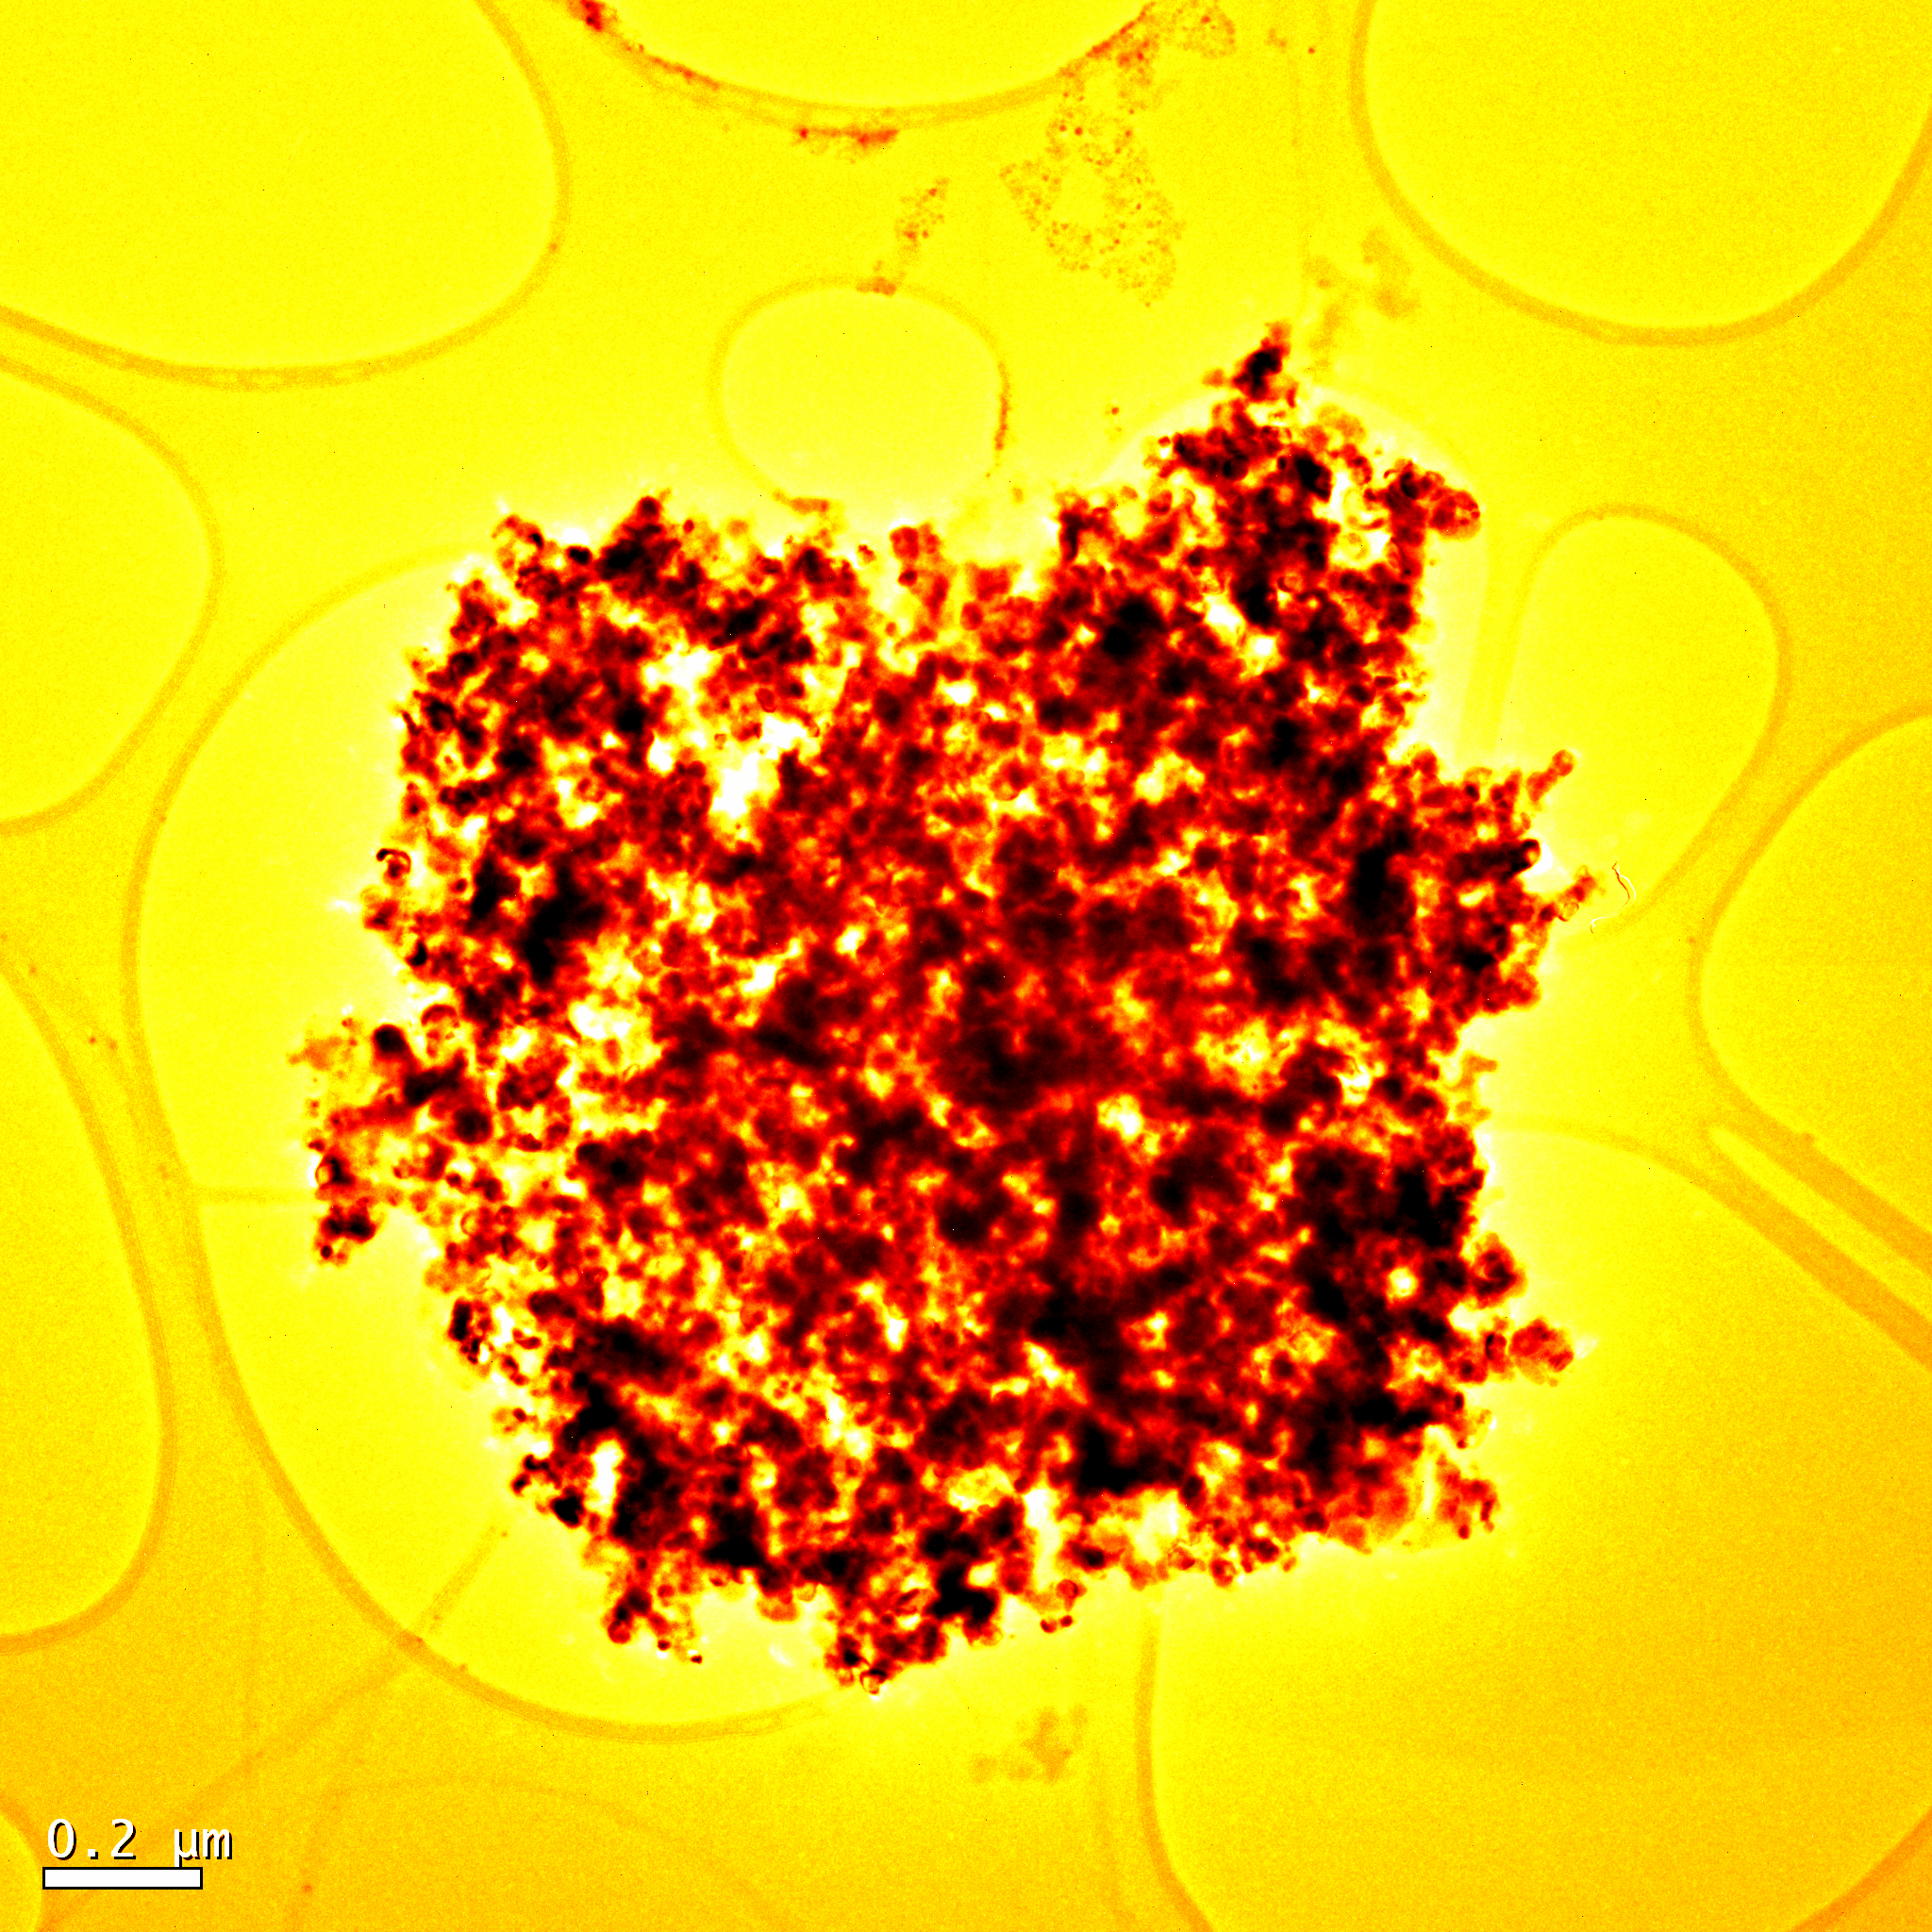
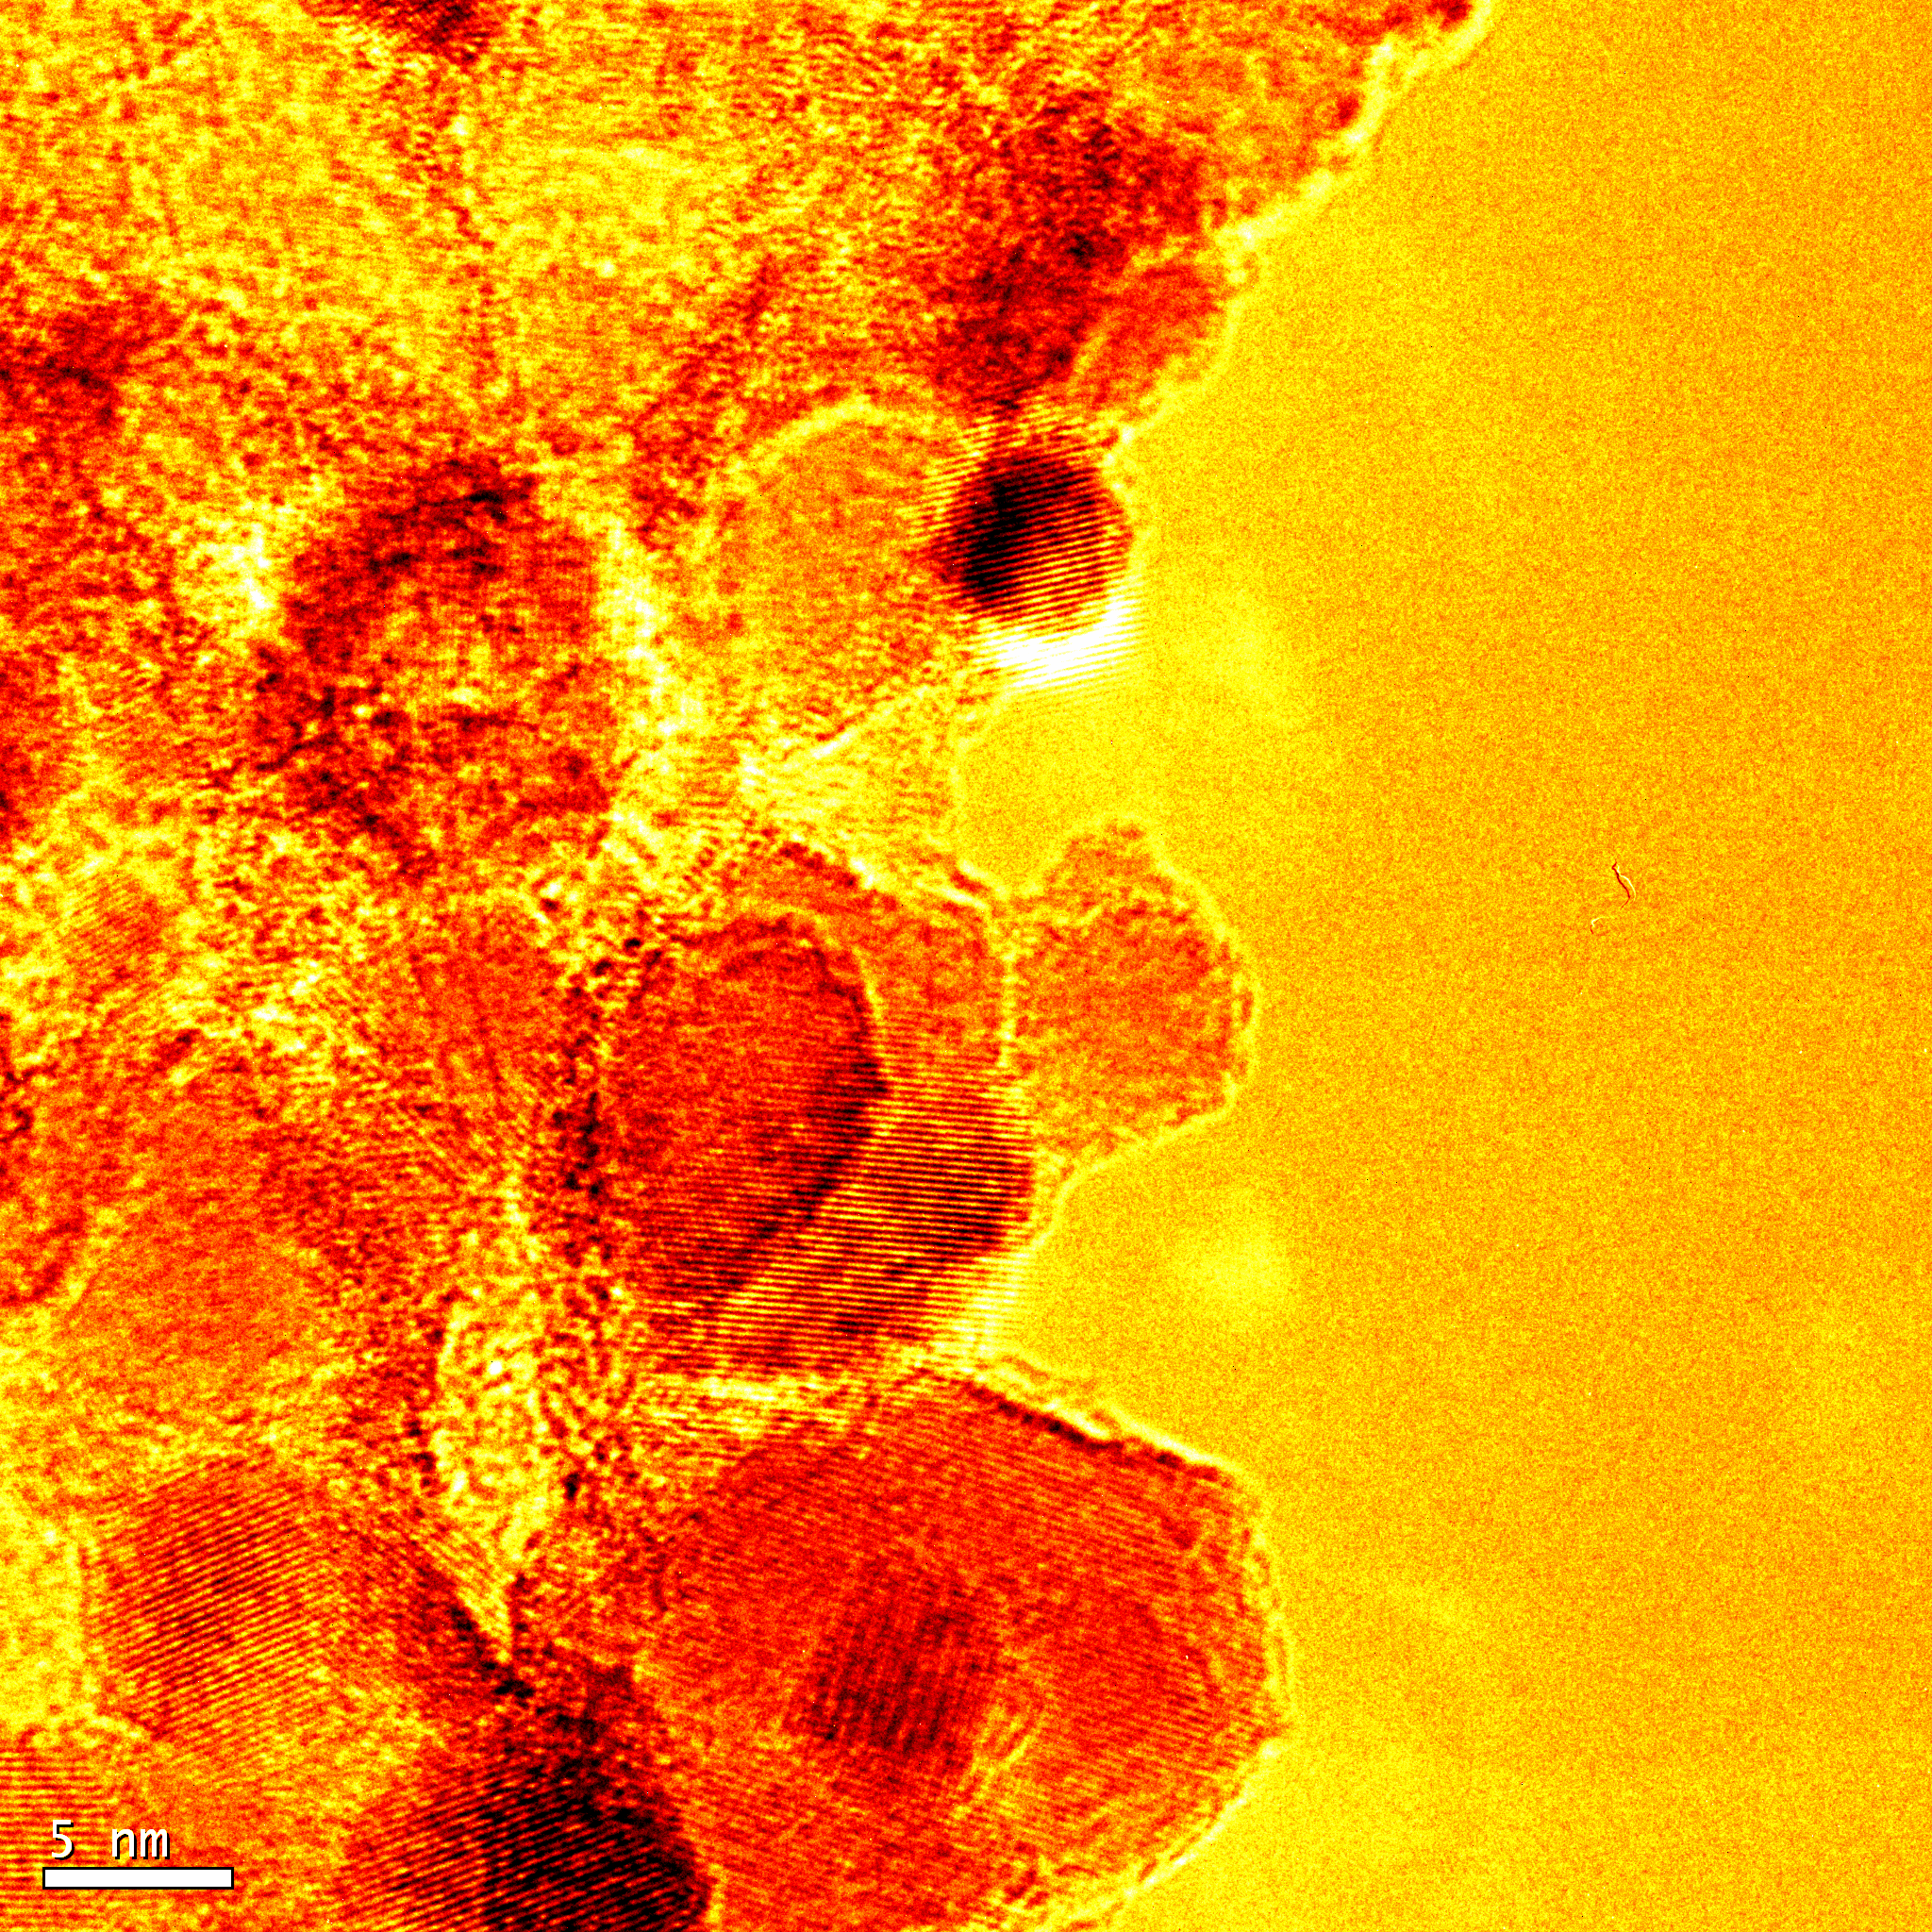
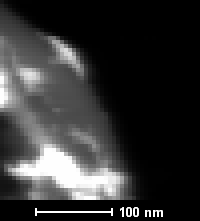
Fig. 4. Overhead of a conglomerate of QDs and buckyballs, and a closeup image of a QD on a buckyball found on the conglomerate's edge.
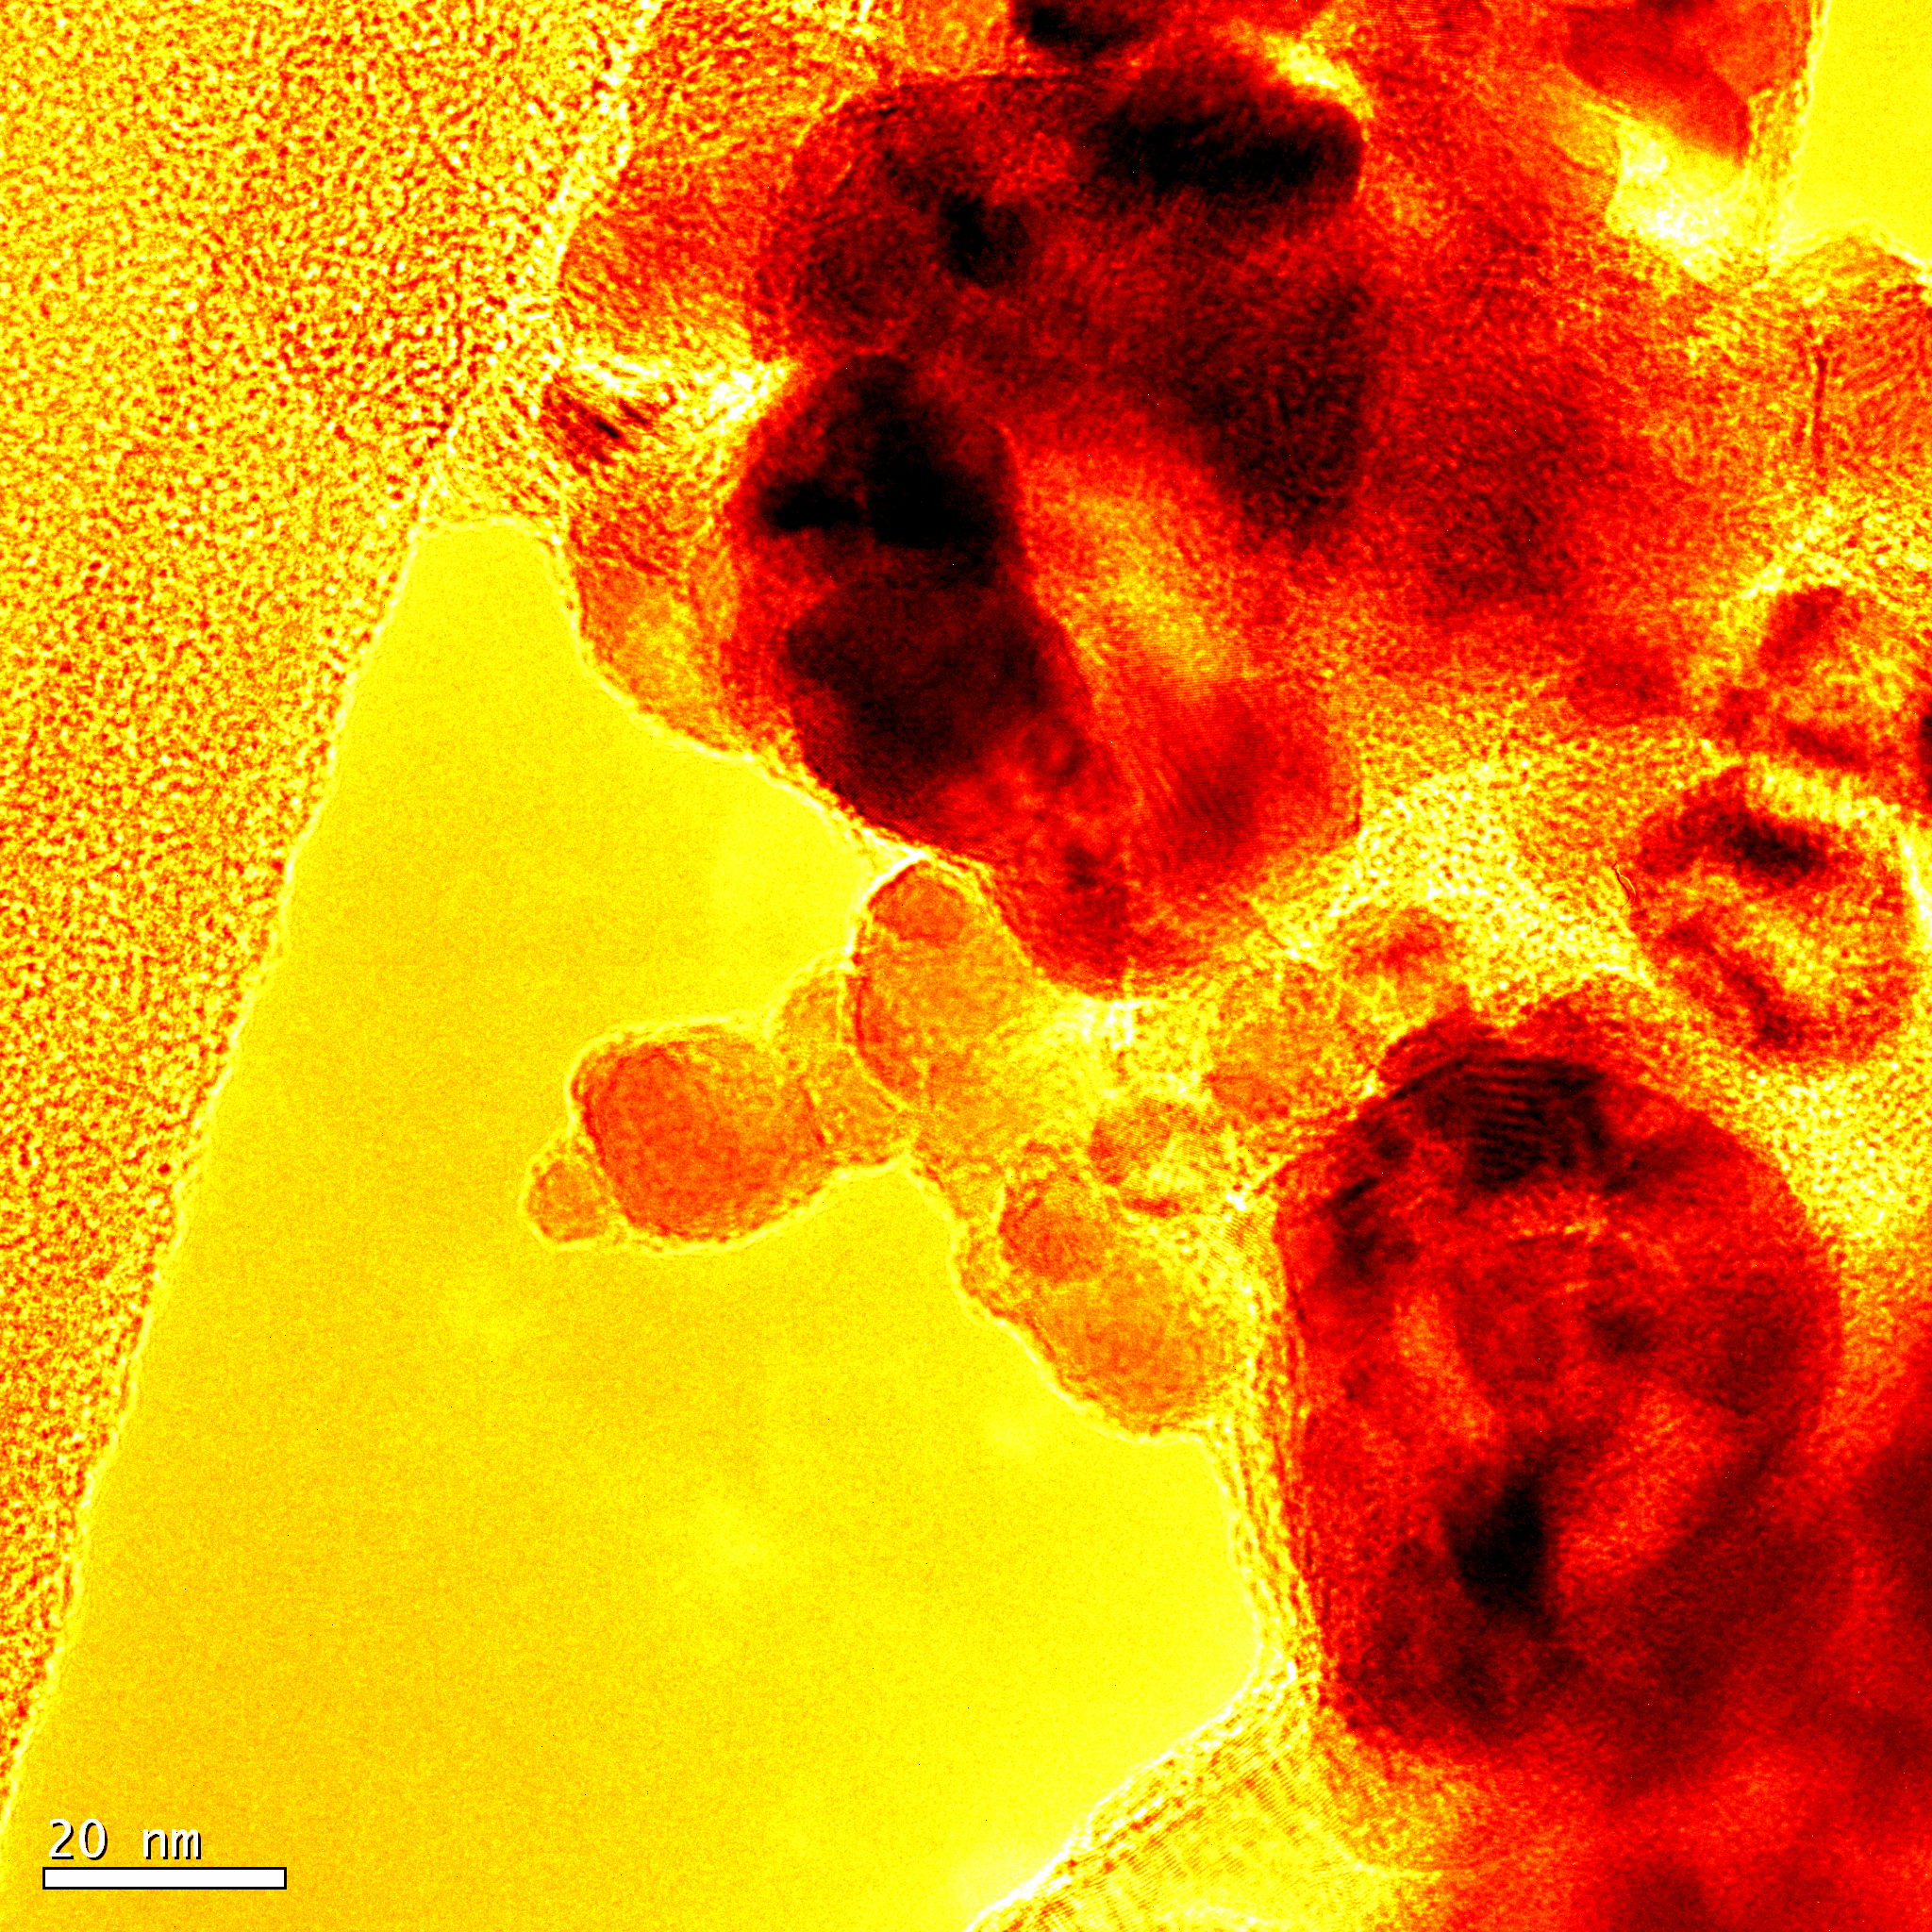
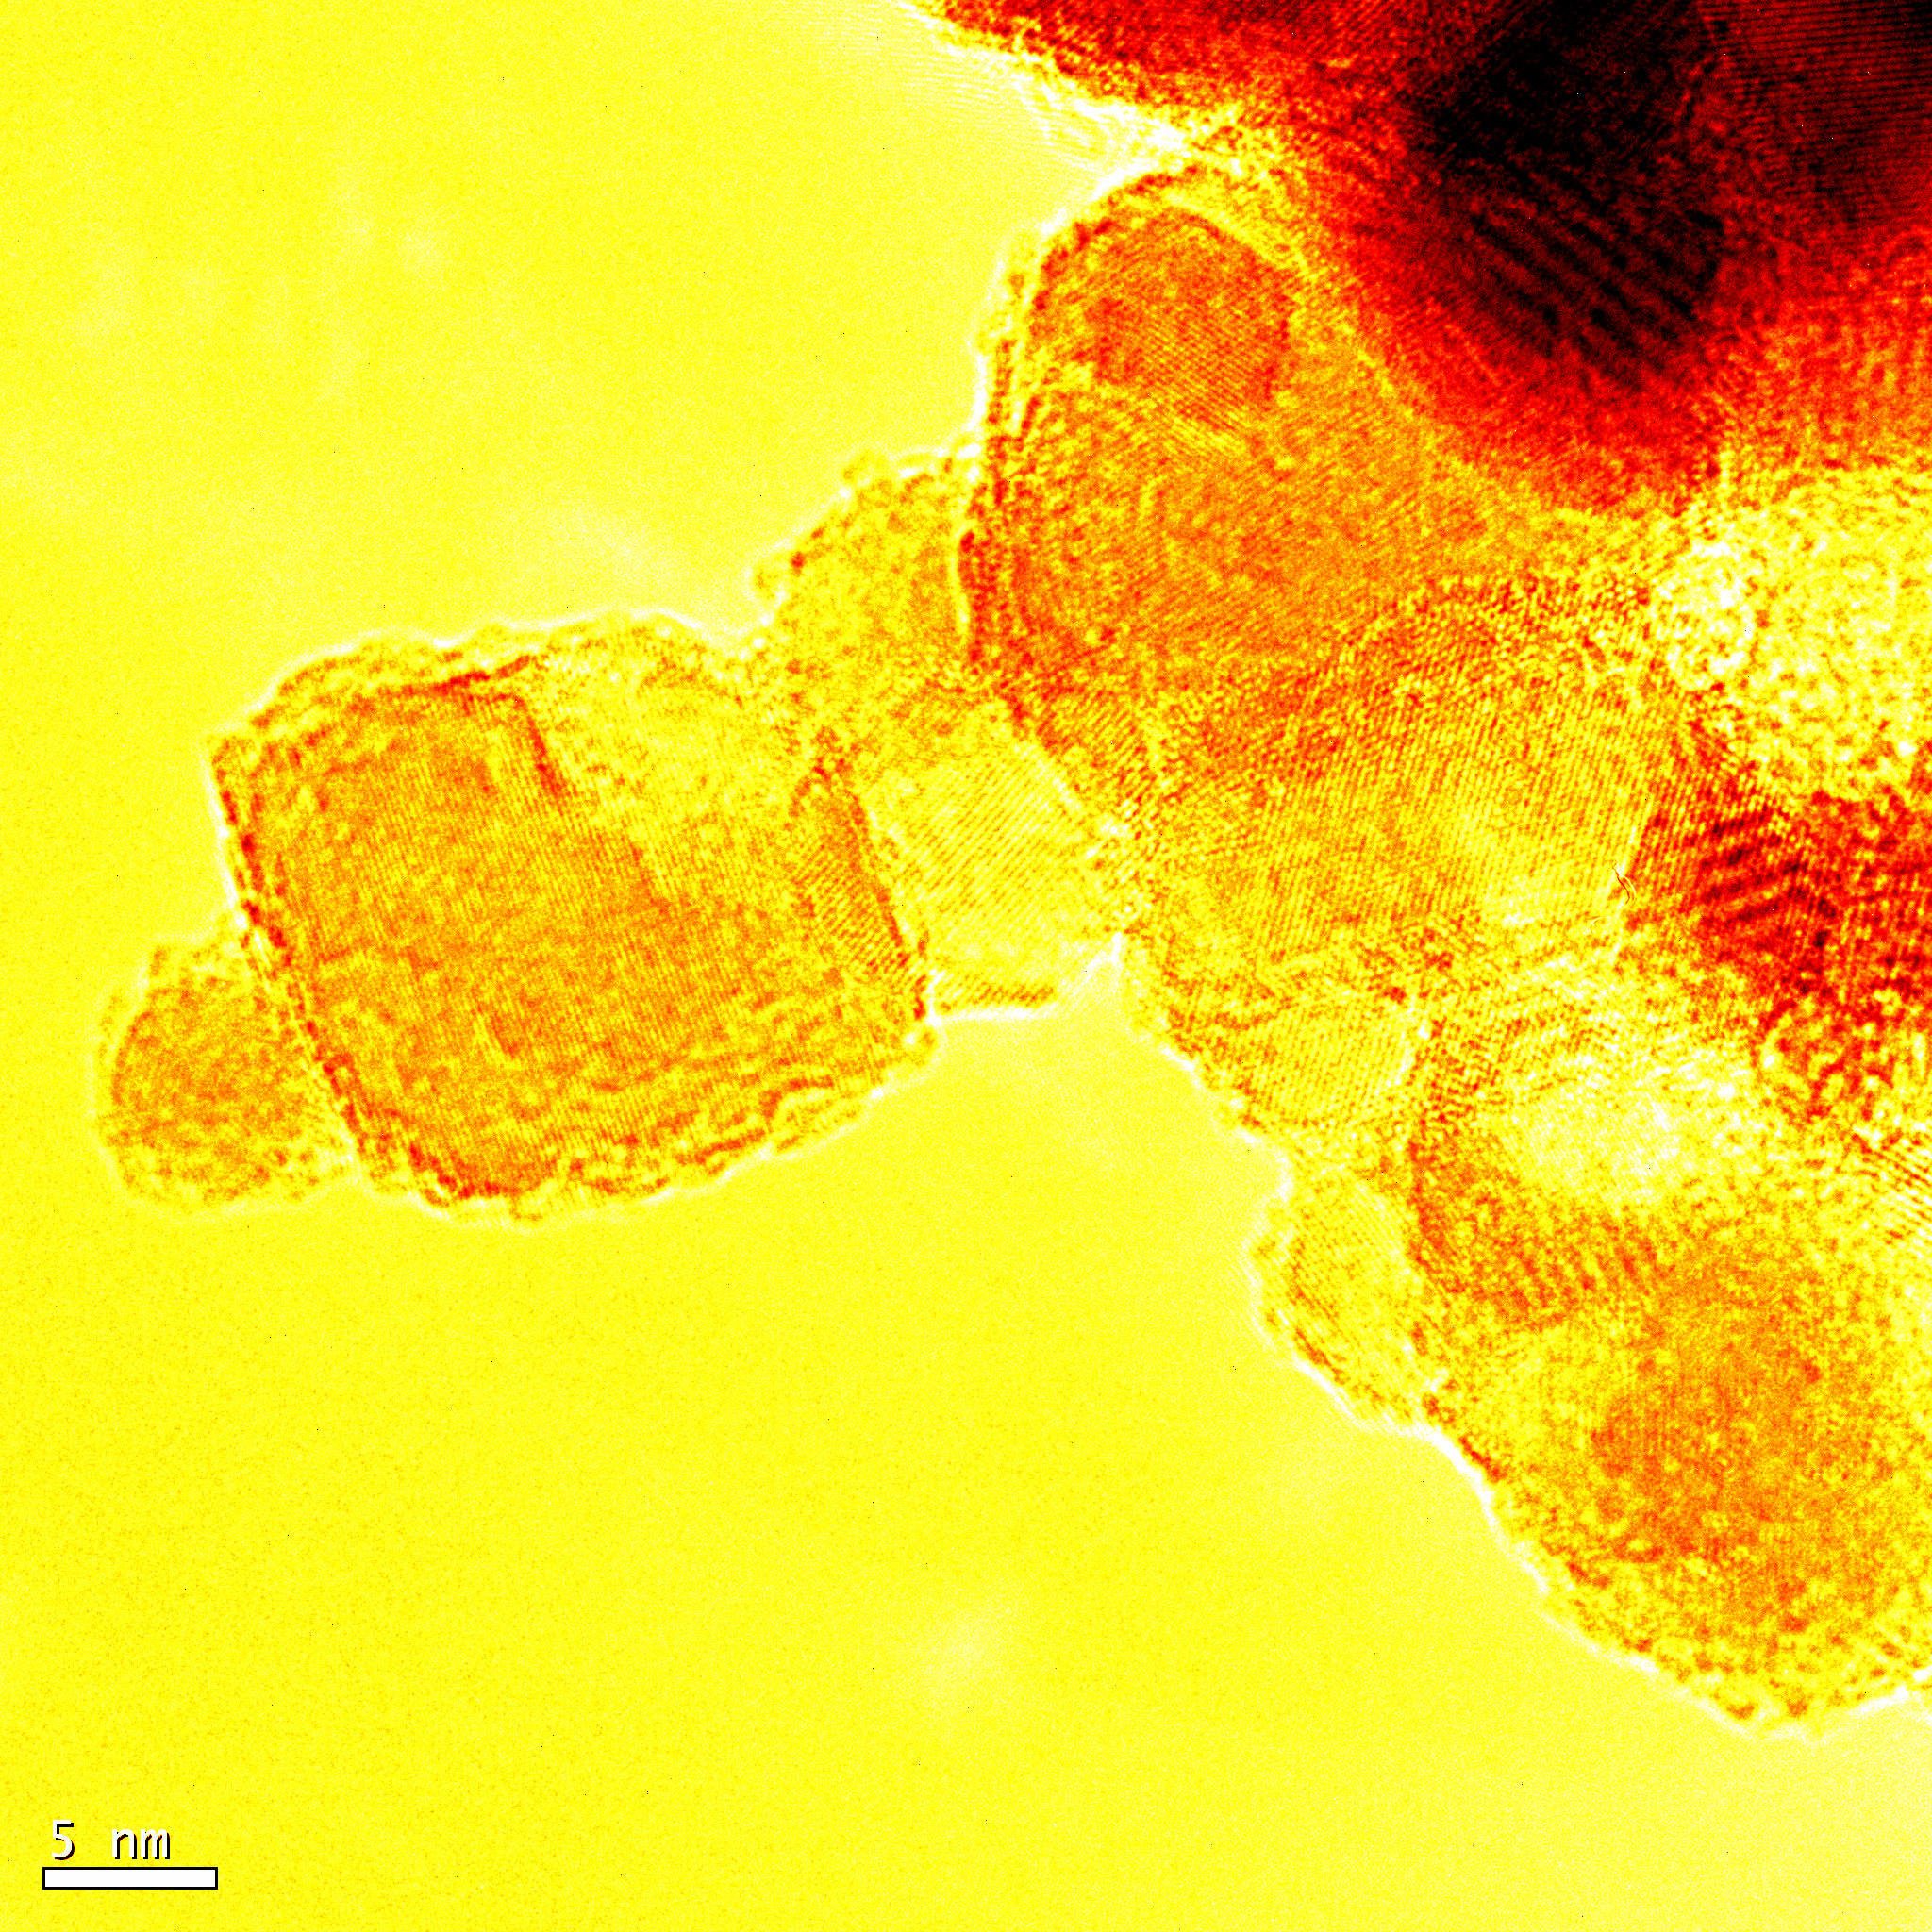
Fig. 5. QD connected to a buckyball, and a closeup of this region to show detail.
As is seen in Fig. 4, QDs and buckyballs tend to aggregate together into large clumps, making it necessary to skirt the edges to find clear images. The zoomed in image of this region shows some areas where there may be a dot on top of a buckyball, but overlaying of other buckyballs and dots makes it challenging to evaluate these areas, aside from the clear portion hanging off the edge. Fig. 5 shows an ideal case of this, where the aggregate has a buckyball-QD connection clearly jutting out from the edge.
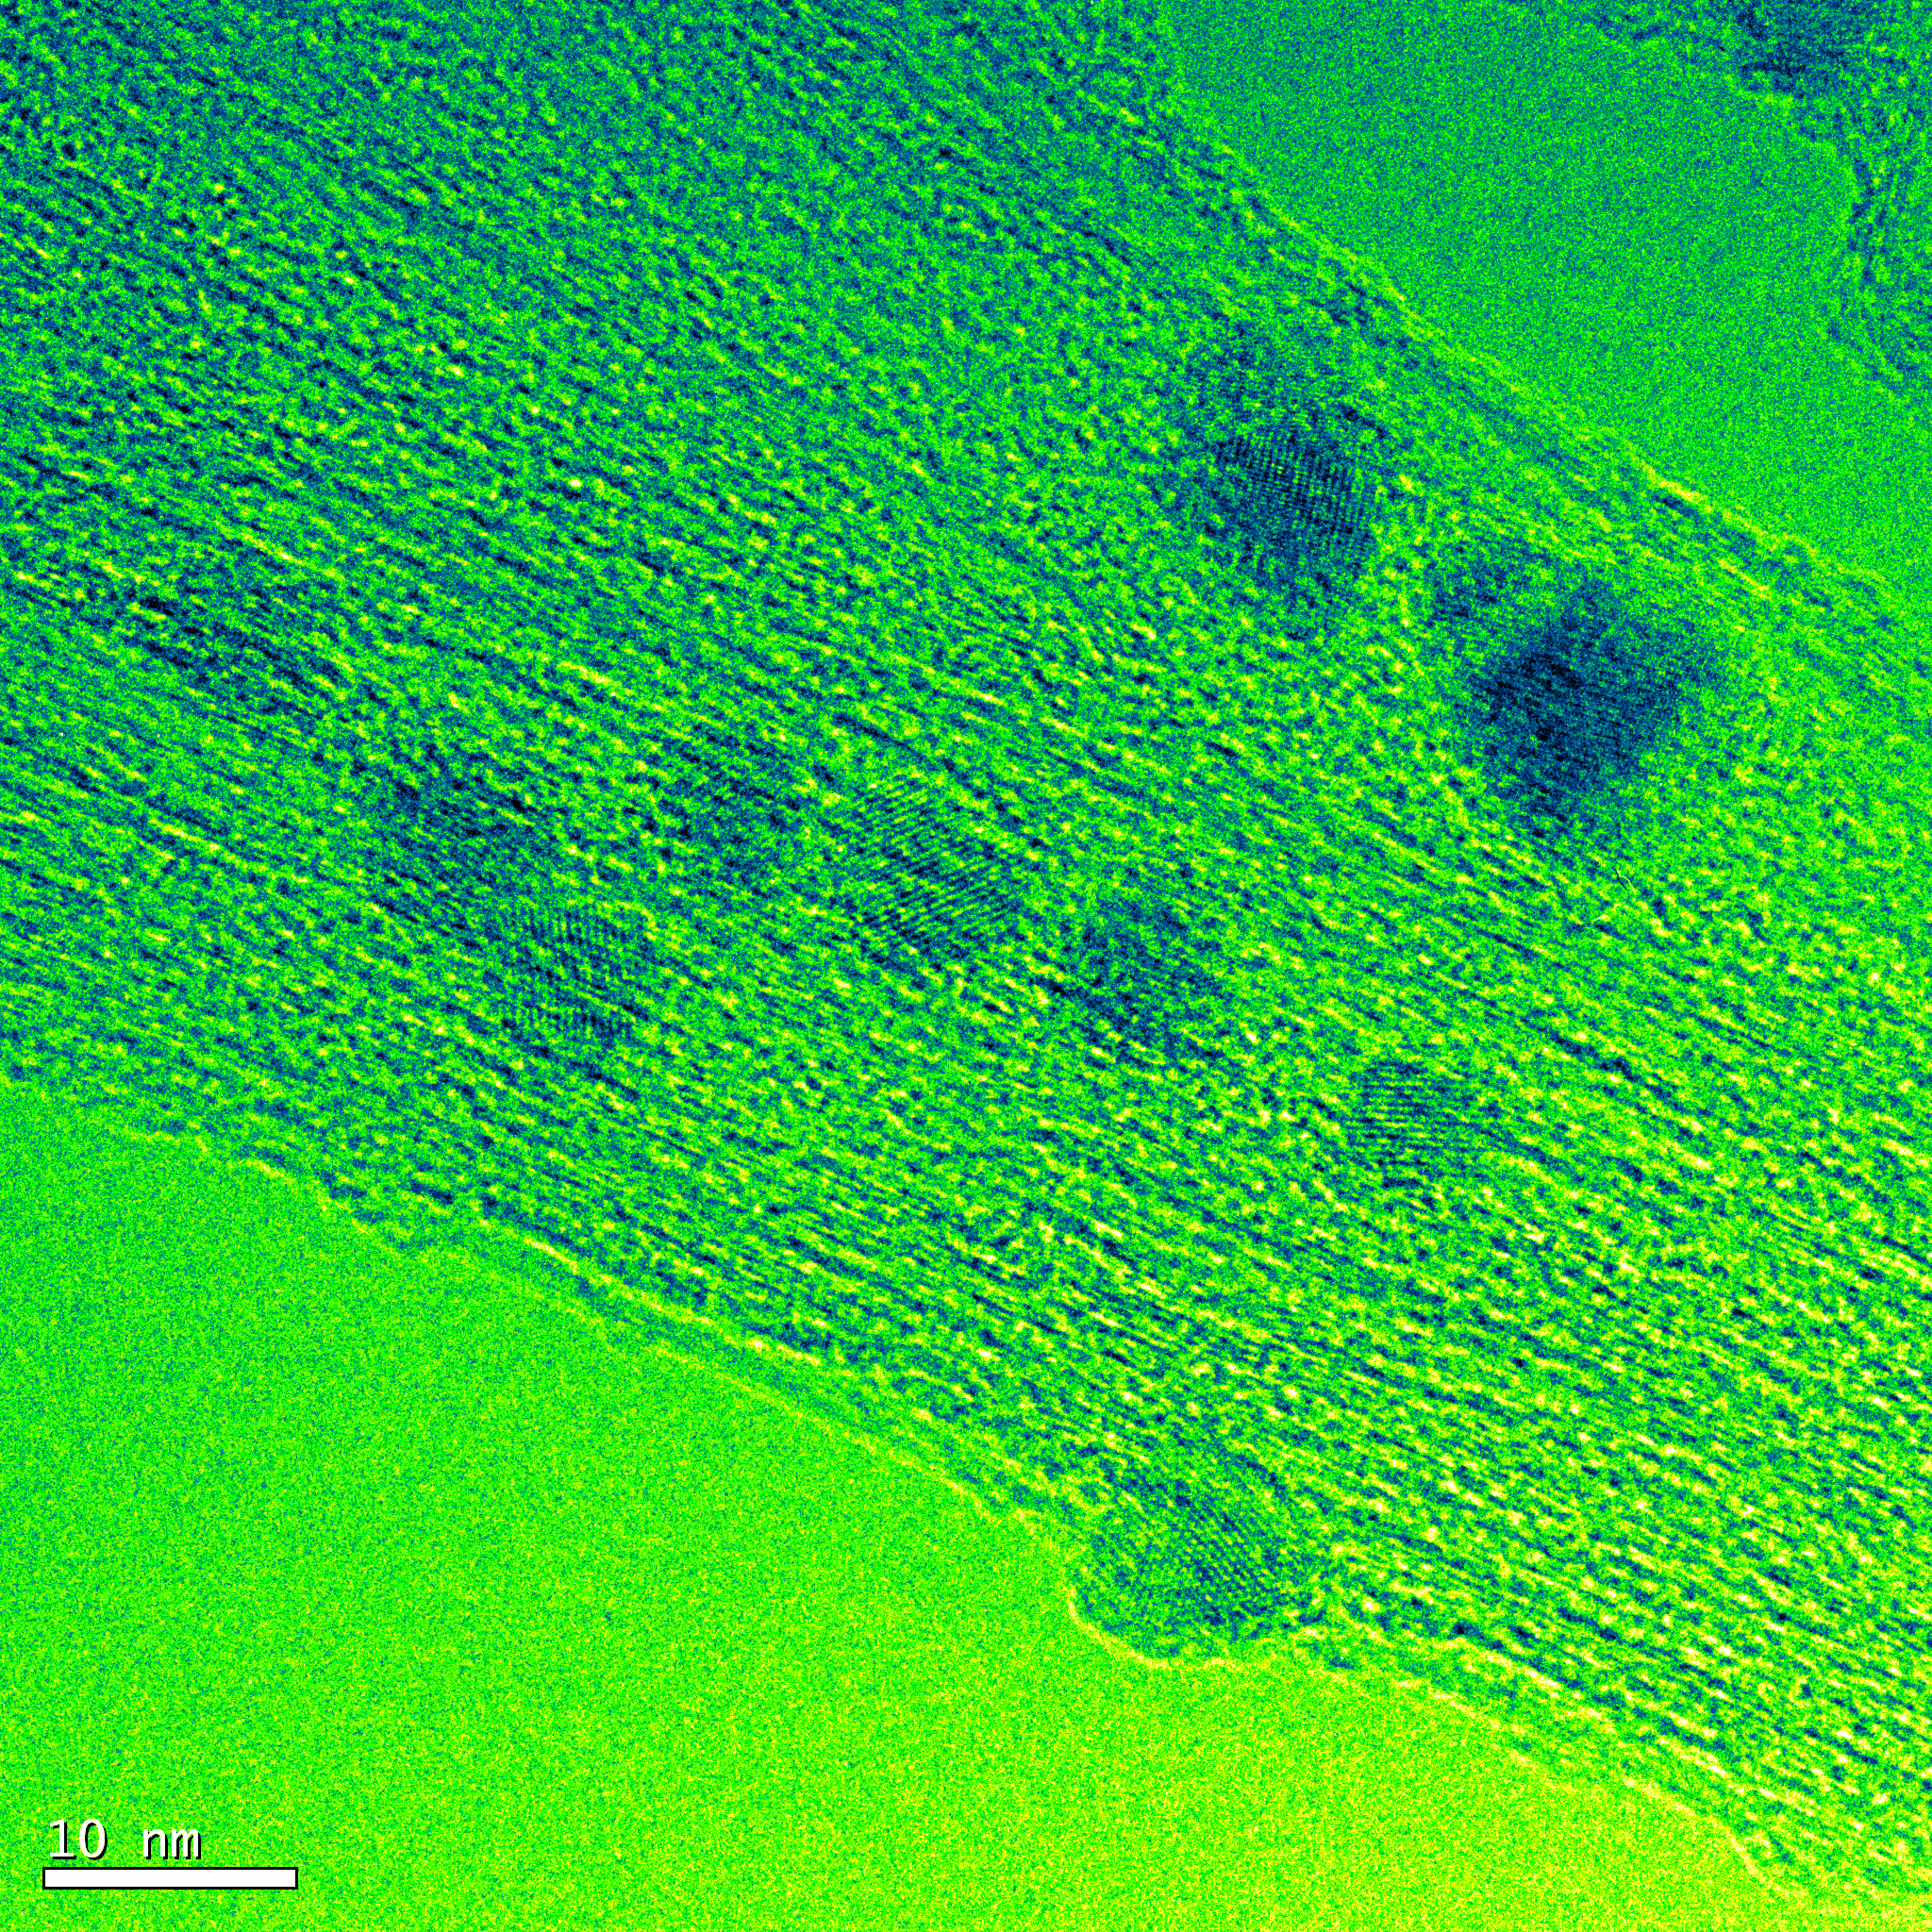
Fig. 6. CdSe/CdS core/shell QDs on CNTs.
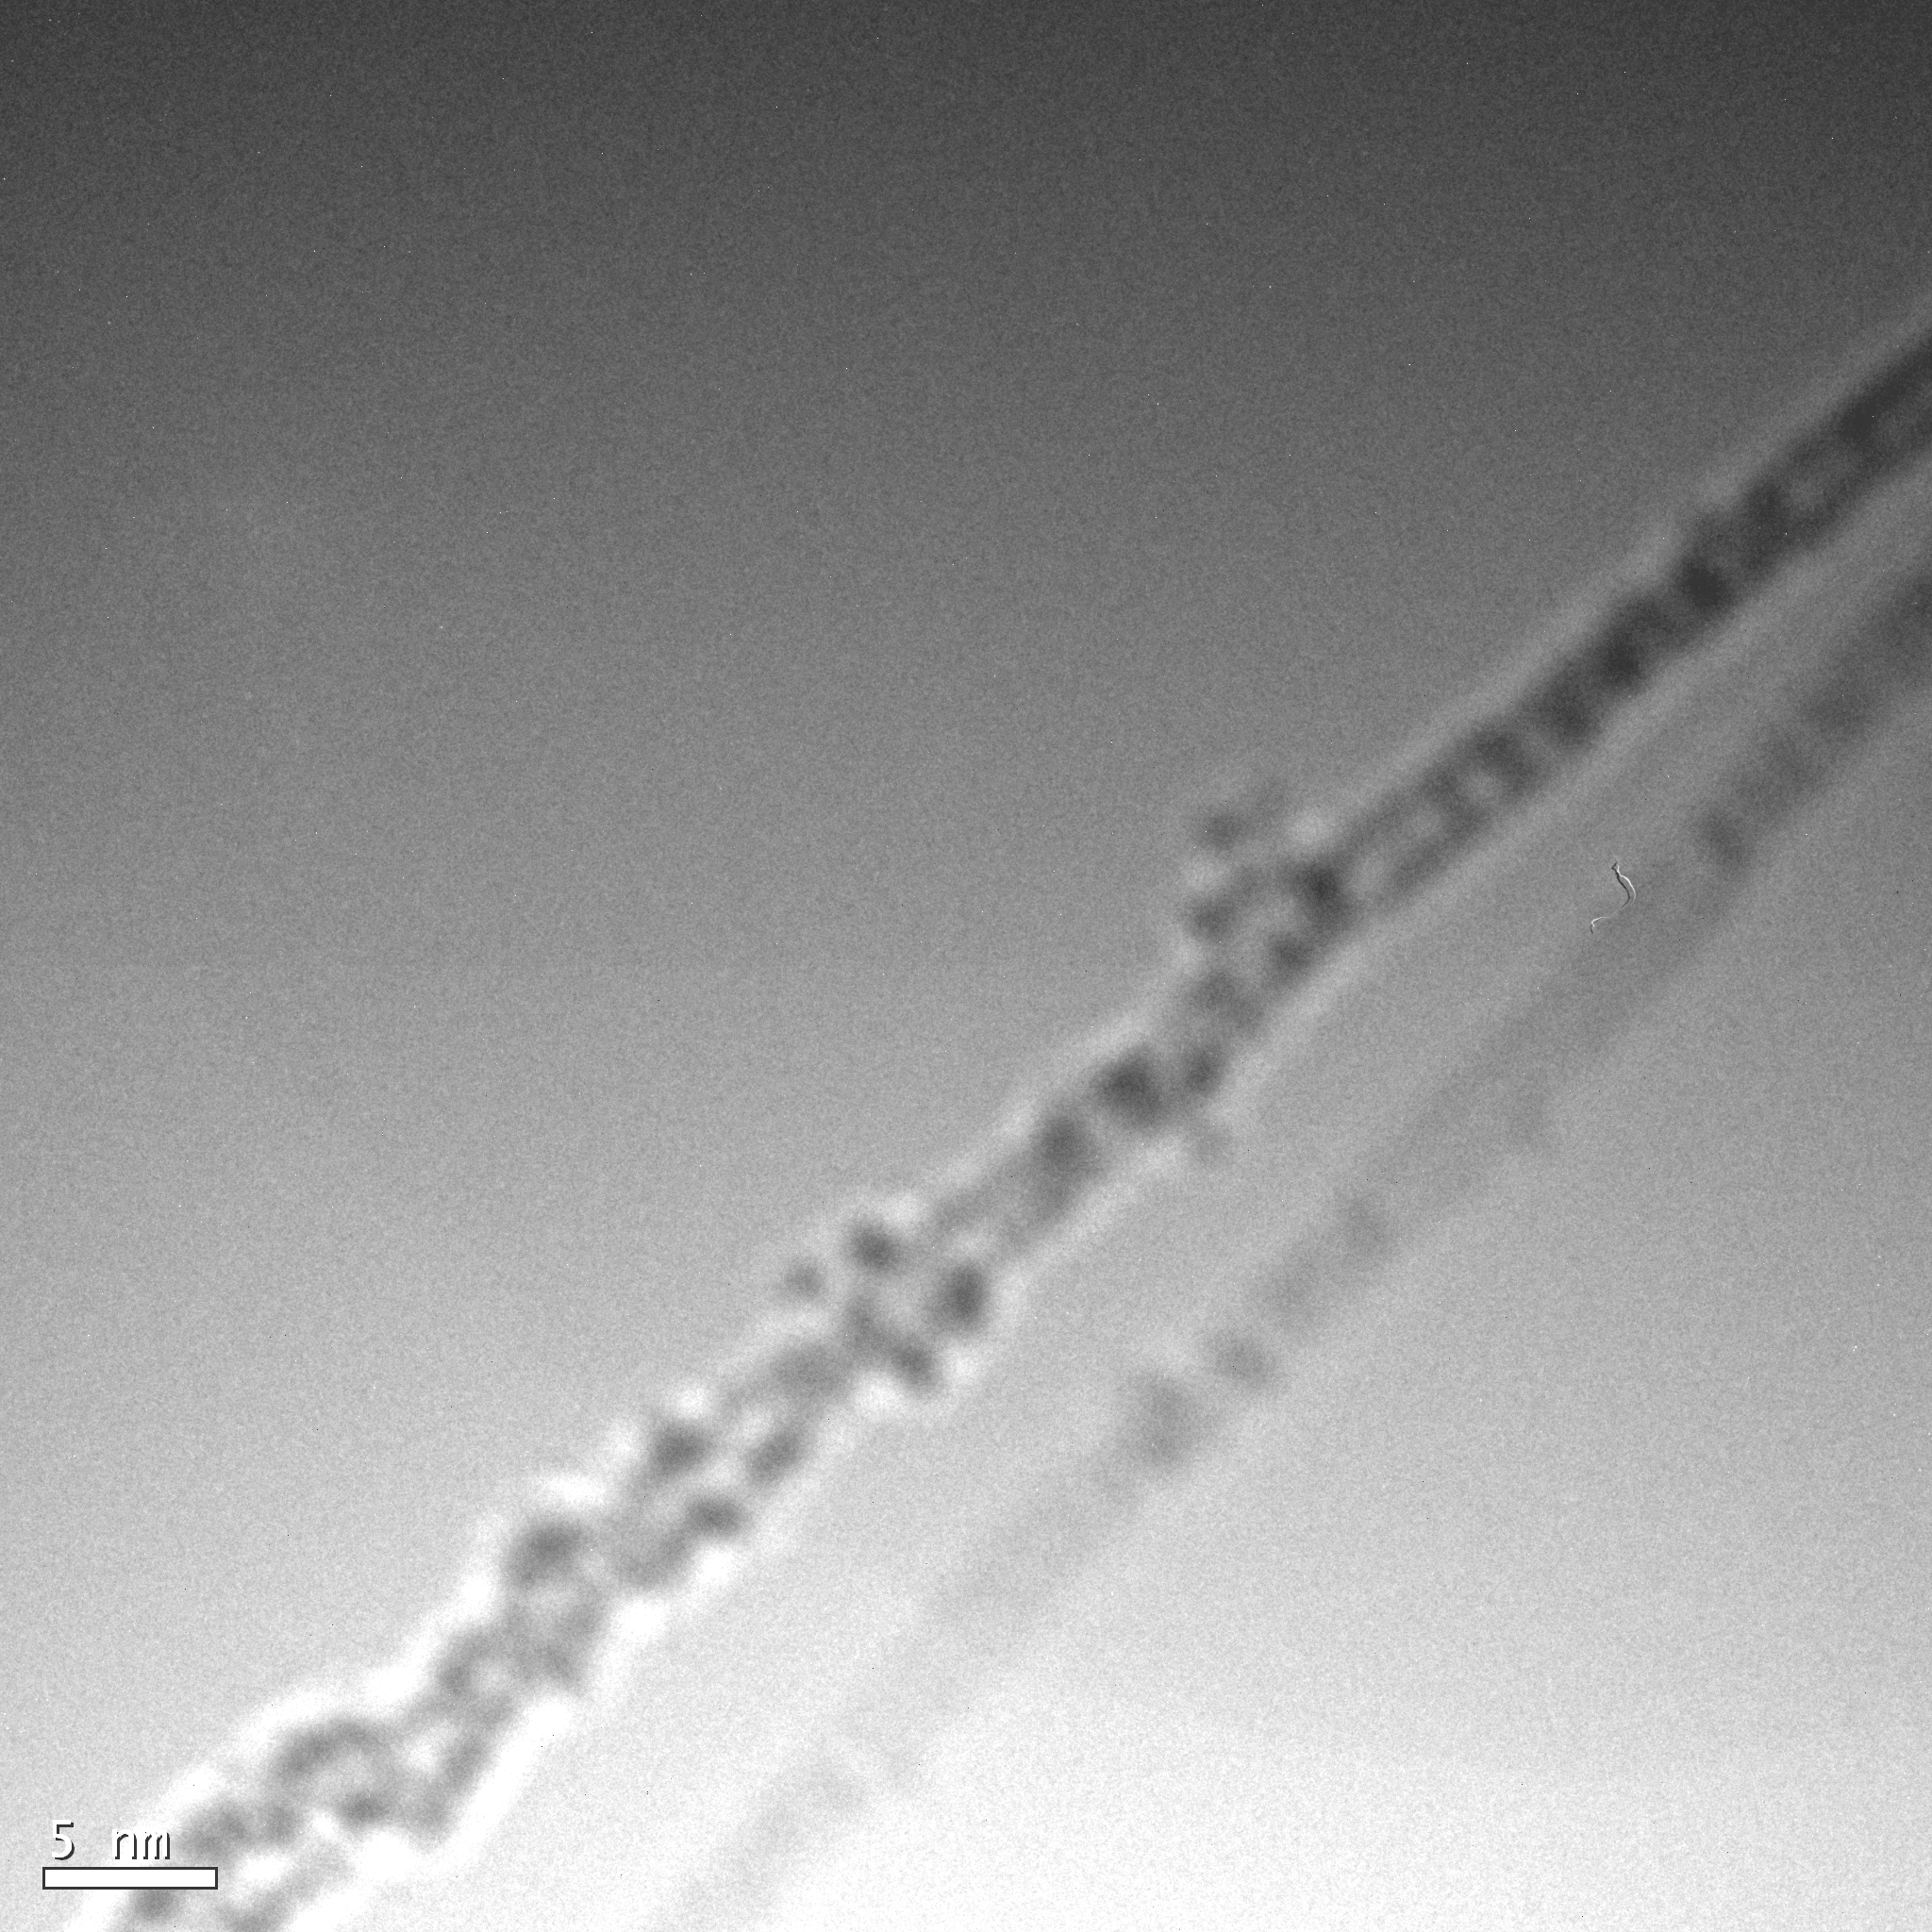
Fig. 7. PbS QDs on a
CNT.
Fig. 6 yields an image of several CdSe/CdS QDs on top of an array of CNTs. An issue similar to the QD/buckyball sample arises, where it is easiest to evaluate results when some particles are jutting off the edge. This is more prevalent in Fig. 7, where many small PbS QDs can be seen attached to the CNT. Despite not being properly focused, the image still shows several interesting results. For example, the CNT has several areas where dots seem to be hanging off the edge. Furthermore, if looking at the top right corner of the image it can be seen that some dots might be inside the tube.
X-Ray data allows us to discern the elements present in the samples,
which assists in supporting the theory of dots connected to CNTs or
buckyballs.
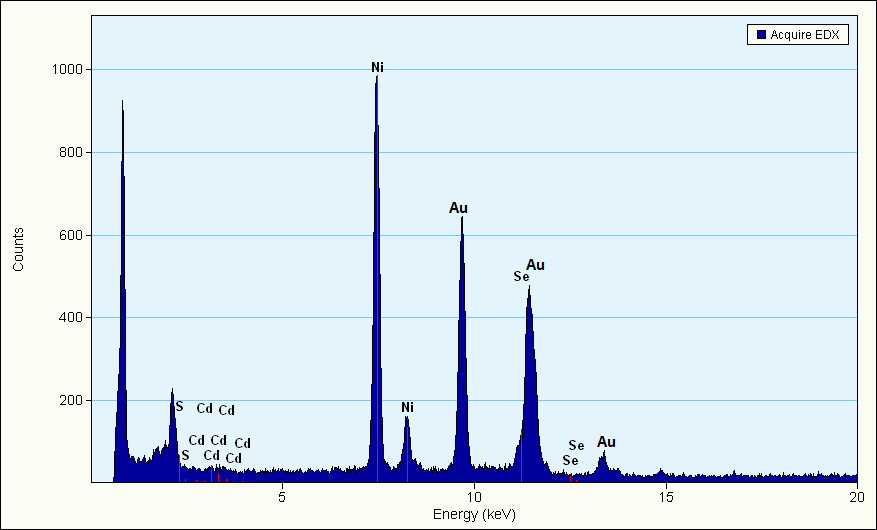
Fig.
8. X-Ray data corresponding to the overhead image in Figure
4.
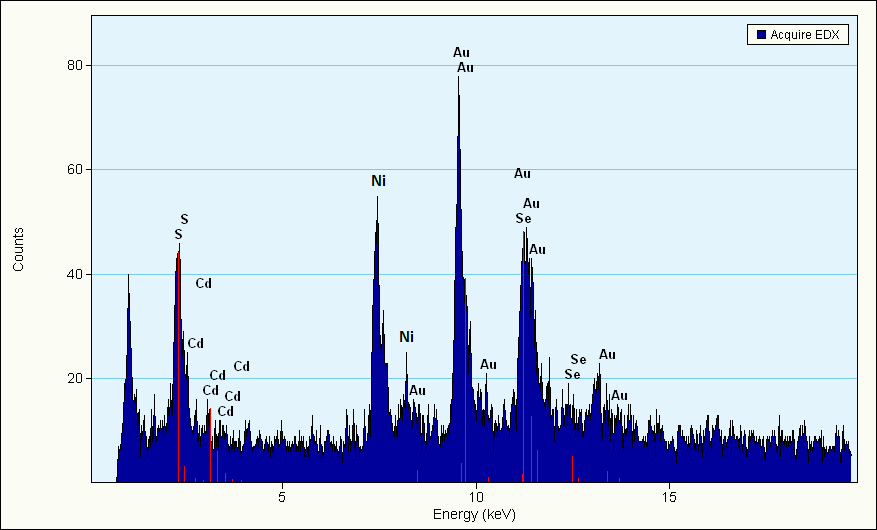
Fig. 9. X-Ray data corresponding to the zoomed in image in Figure 5.
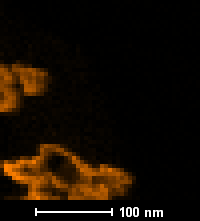
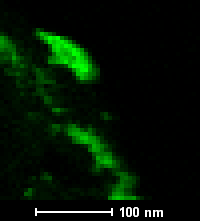
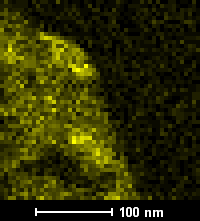
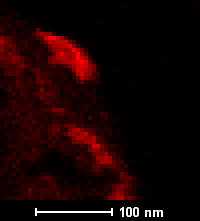
Fig.
10. STEM
elemental composition map of a QD on buckyball sample. From left to
right, images correspond to the raw STEM image, Ni, Cd, Se, and S.
Results confirm that QDs could be attached to buckyballs and NTs using this simplistic method of sonication, albeit to a very small yield only useful for imaging purposes. TEM imaging yields multiple locations in the samples where connections occur. It is probable that there are more connections than those observed, but these likely appear within the formed conglomerates. If connections are formed in the center of the conglomerates, it becomes impossible to make concrete conclusions regarding the chemical treatment, and as such data is limited to the outer fringes of the aggregates. In order to more efficiently create nanocomposites of this nature, further chemical processes need to be performed, which could potentially result in more connections and less aggregated samples.
Acknowledgments
Please contact me if you
have any questions, criticism or suggestions:
Caleb
Whittier
Department
of Chemistry
University
of Rochester
Rochester,
NY 14627
cwhittie@u.rochester.edu