University of Rochester, Department of Earth and Environmental Sciences
Backscatter Images and X-Ray Spectra
Tourmaline, (Ca,K,Na)(Al,Fe,Li,Mg,Mn)3(Al,Cr,Fe,V)6(BO3)3(Si,Al,B)6O18(OH,F)4, is a mineral that is found in quartzite and in rocks such as schist and marble. Tourmalines consist of a large variety of different minerals, as tourmaline is a group of silicate minerals with indistinct cleavage and made of brittle material. Tourmalines can also be found in sedimentary deposits such as sandstone or conglomerates. The tourmalines found in this analysis were found in a quartzite composition material. These specific tourmalines are being studied to see if there is a magnetic remanence carrier.
The tourmalines analyzed under the SEM were found in a region of Western Australia known as the Yilgarn Craton. The Yilgarn Craton is an area where some of the oldest material on Earth can be found. One of the quartzite outcrops found in this area is approximately 1.2 billion years old.
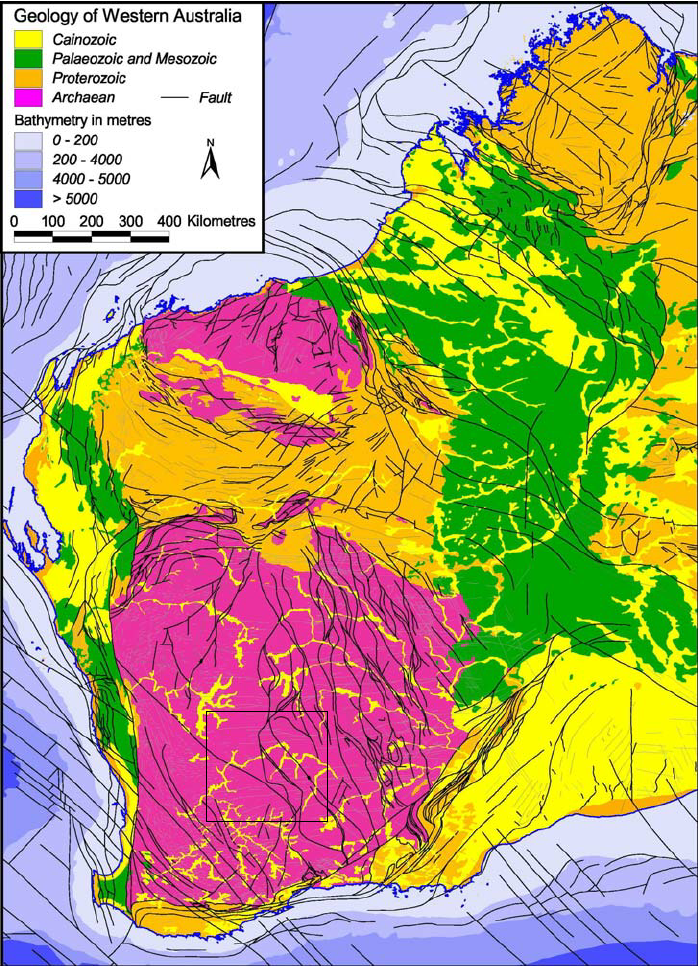
Figure 1: The ages of rocks found in Western Australia are seen in this image, the black rectangle is the approximate area of the tourmaline grain location (Sinandovski et al., 2005)
The tourmaline samples were prepared by creating a cold dry epoxy resin material to stage the samples. This was done without heating the samples, as this could interfere with some of the magnetic properties found in the material. Next, the samples were polished using 30μm, 15μm, 6μm, 3um, 1μm, and 0.5μm polishing films. The faces were observed under a microscope during the procedure to estimate surface quality. Finally, the samples were coated in a thin carbon layer, as it would be the least disruptive coating when using x-ray analysis for geological materials, as gold material could overlap with some elemental peaks.
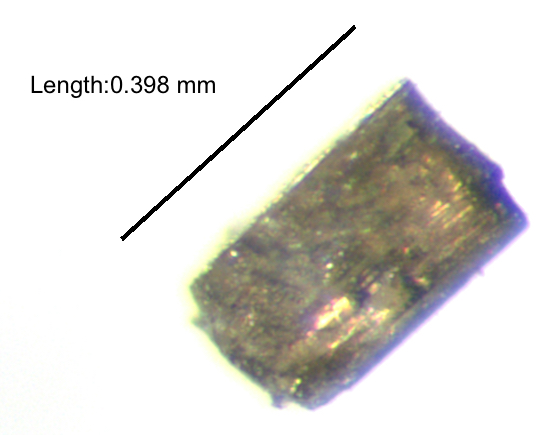
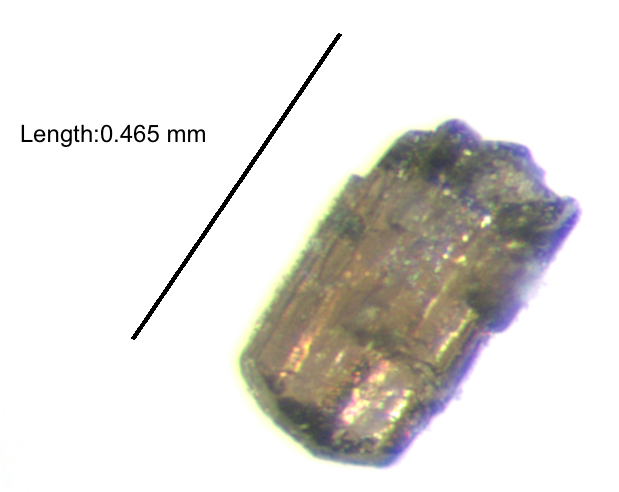
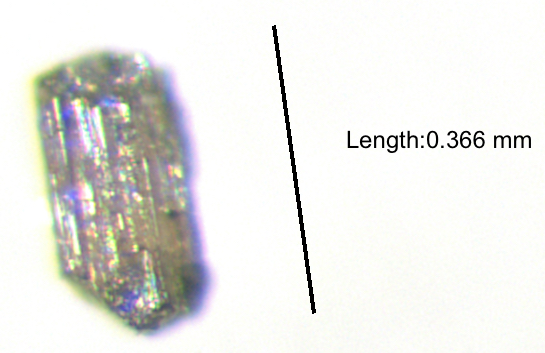
a) T4-1 b) T4-2 c) T4-3
c) T4-4 d) T4-5 e) T2-3
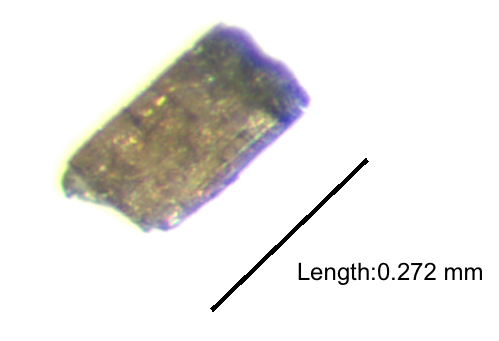
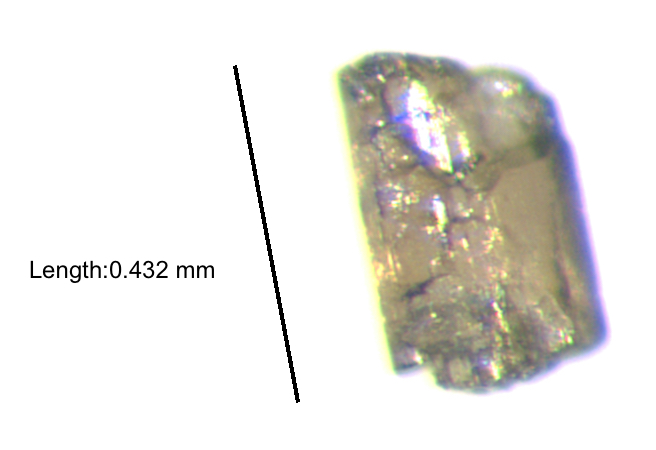
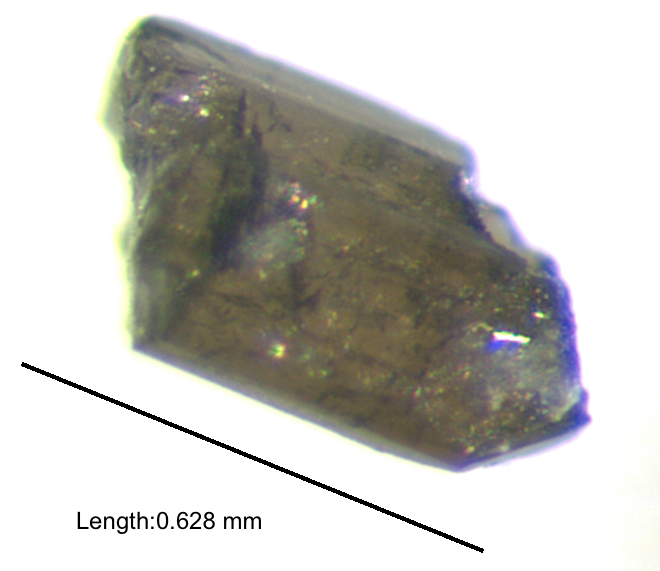
Figure 2(a-f): These were the tourmaline samples found in the granite samples collected in the field. The largest specimen picked out was approximately 0.63mm in length while the smallest specimen picked out was approximately 0.27mm in length. Five of the tourmaline samples were collected from the same rock (a, b, c, d, e) while one of the tourmalines (f), was collected from a different crushed rock sample, but the same outcrop.
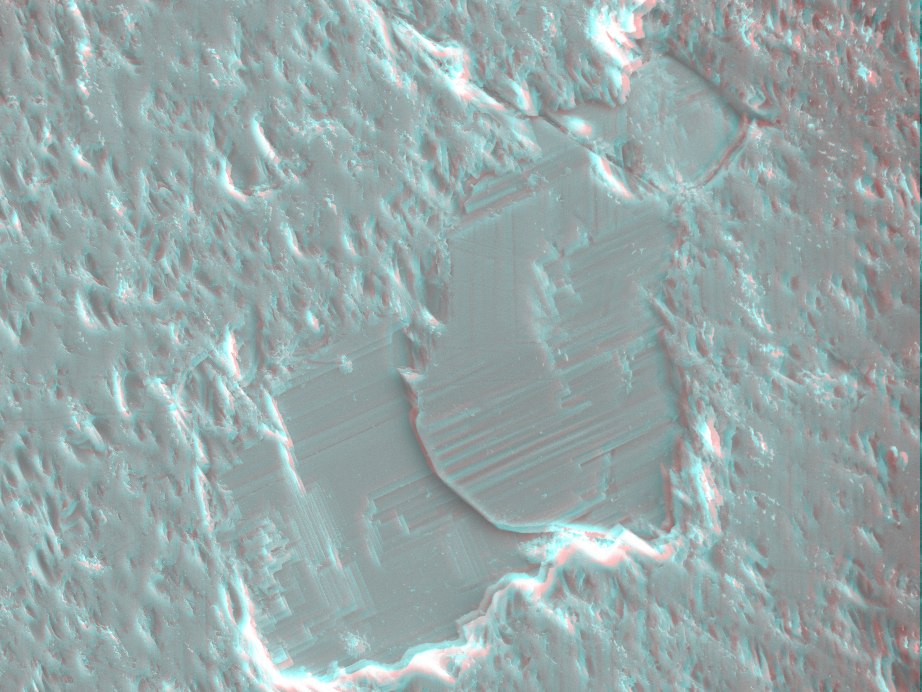
Figure 3a: This was a backscatter image of T4-2 collected with the SEM. This anaglyph is not tilted, and is just two different images compiled on top of one another to give a 3D perspective of the mineral.
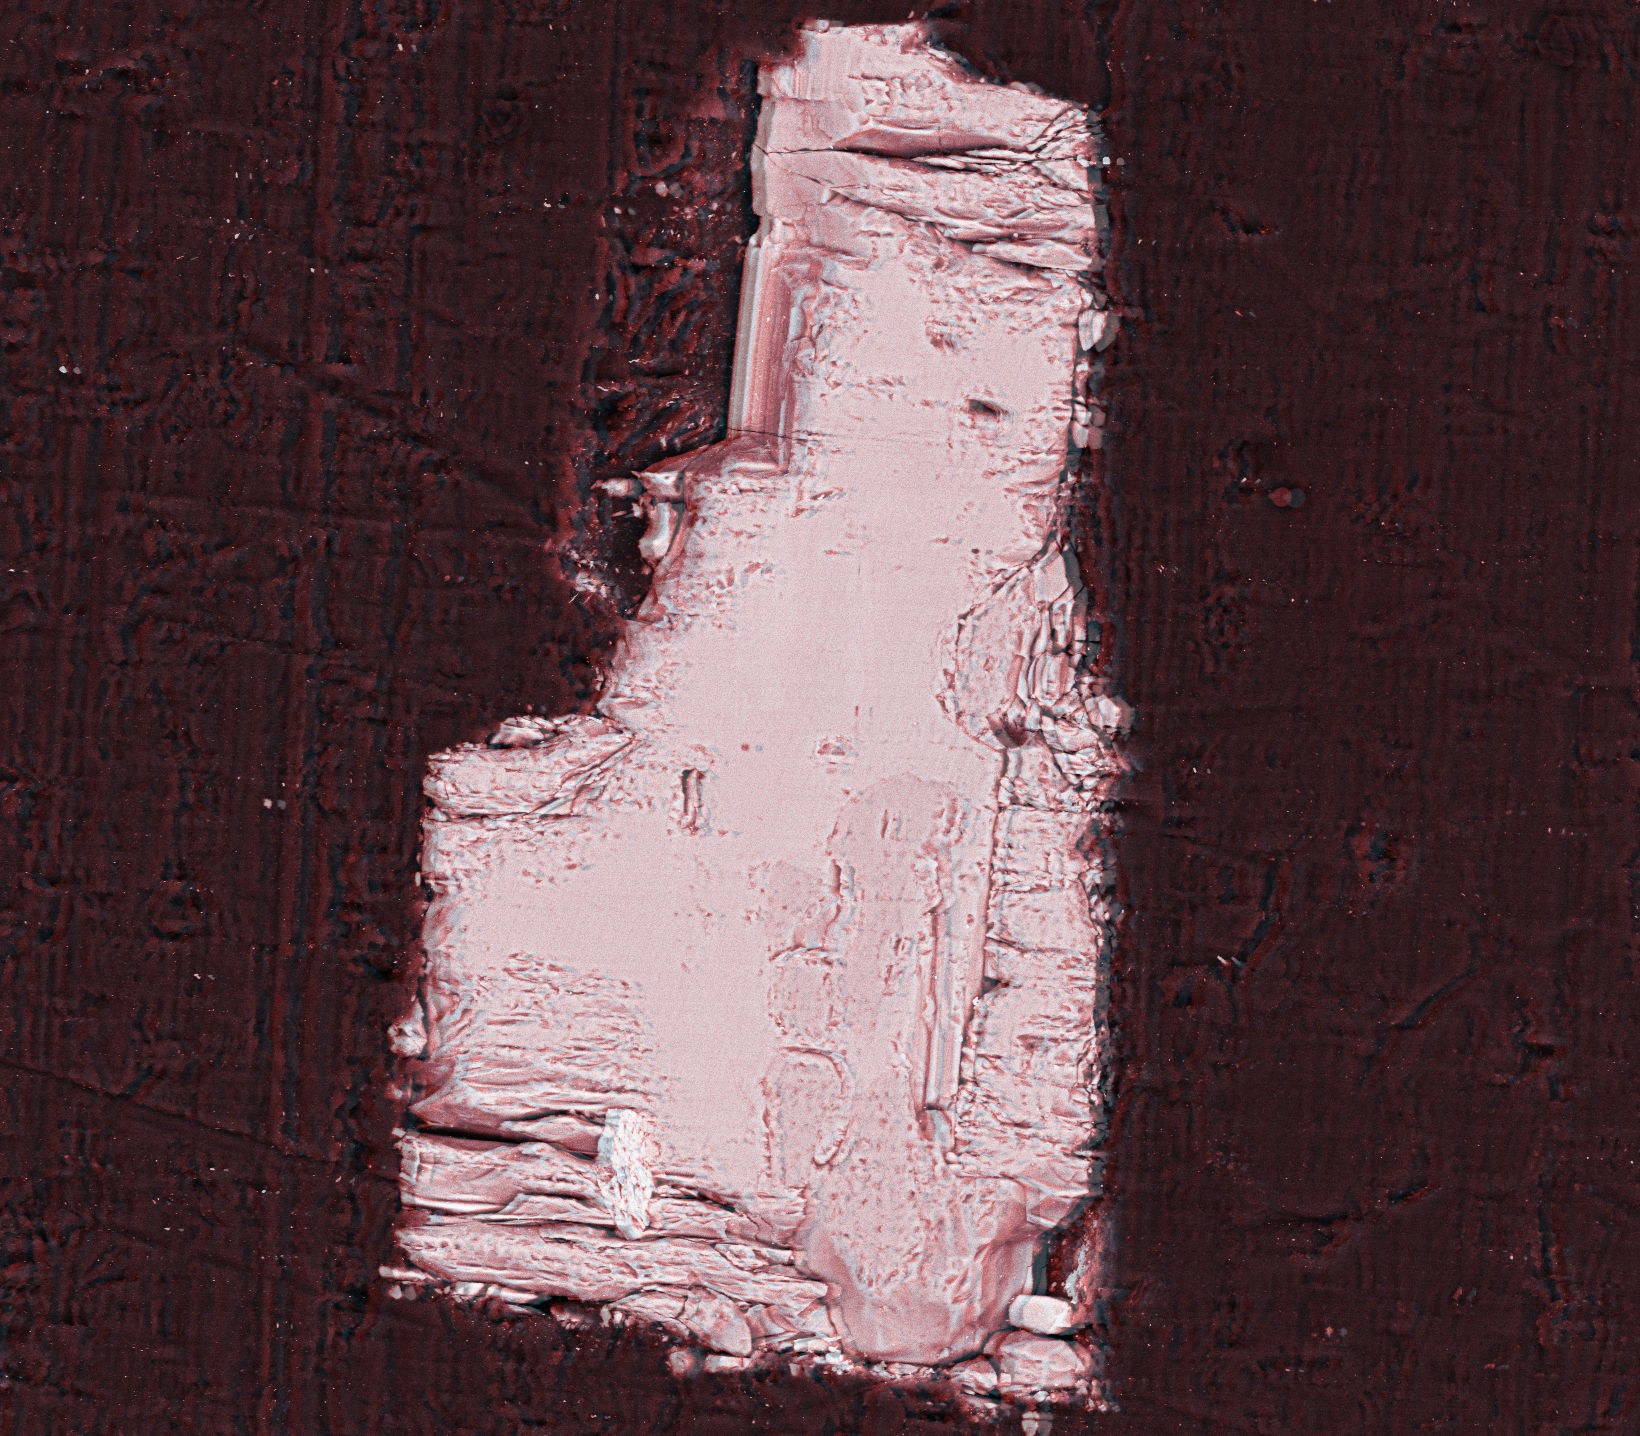
Figure 3b: This was two different secondary electron images compiled on top of one another with a slight tilt to give a 3D effect. One image was tilted ~4 degrees more than the other one.
Secondary electron images were collected and showed the topography of the minerals. Overall, the topography indicates some rough surfaces over the tourmaline specimens. There were also some slight charges at the edges of the tourmaline sample emplaced in the epoxy, which indicates a poor conduction. There were also fractures that could be seen in certain areas of specimens due to polishing. Zoomed images provide a better idea of the overall shape of the surface. Some contaminants can be seen on the surface of the specimens, which can sometimes disrupt the charge density of the electron beam.
a) T4-1
b) T4-3

c) T4-4
d) T4-5
e) T2-3
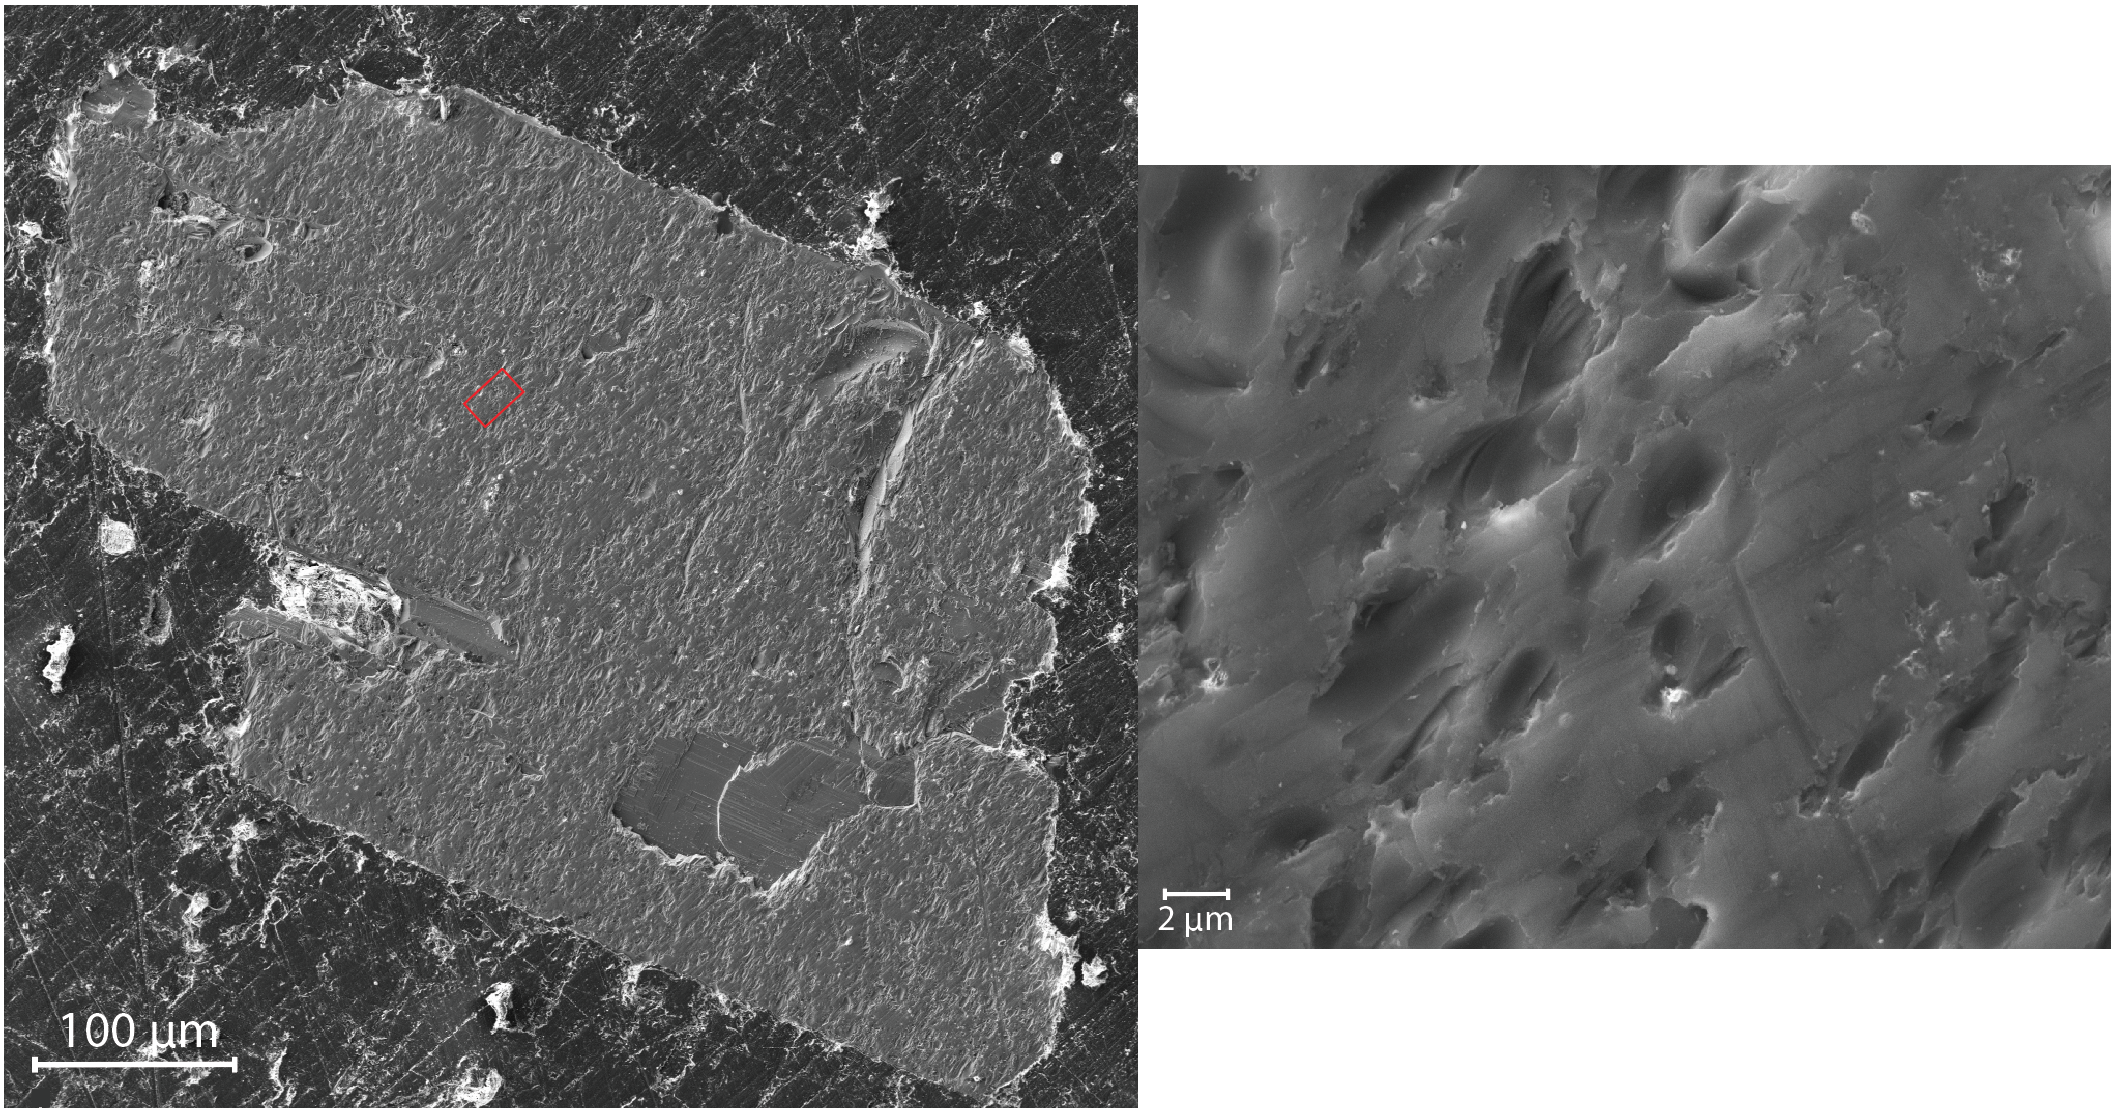
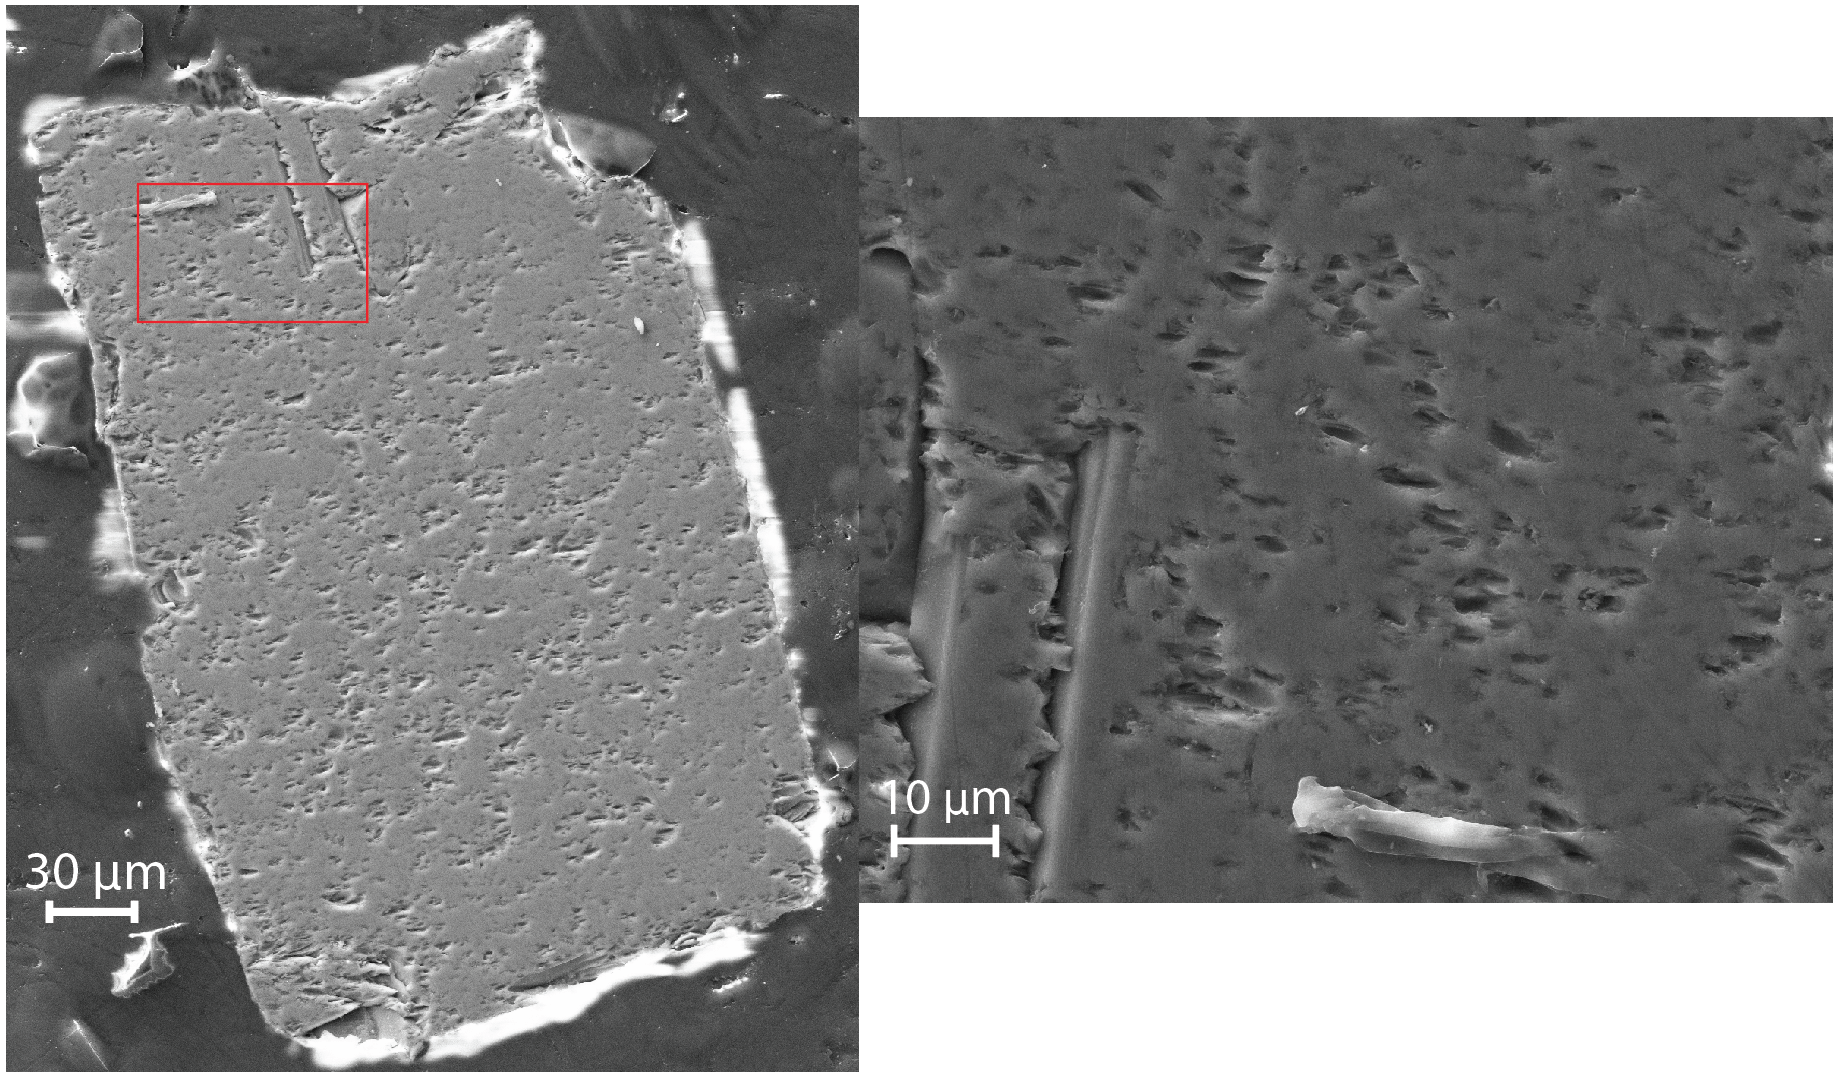
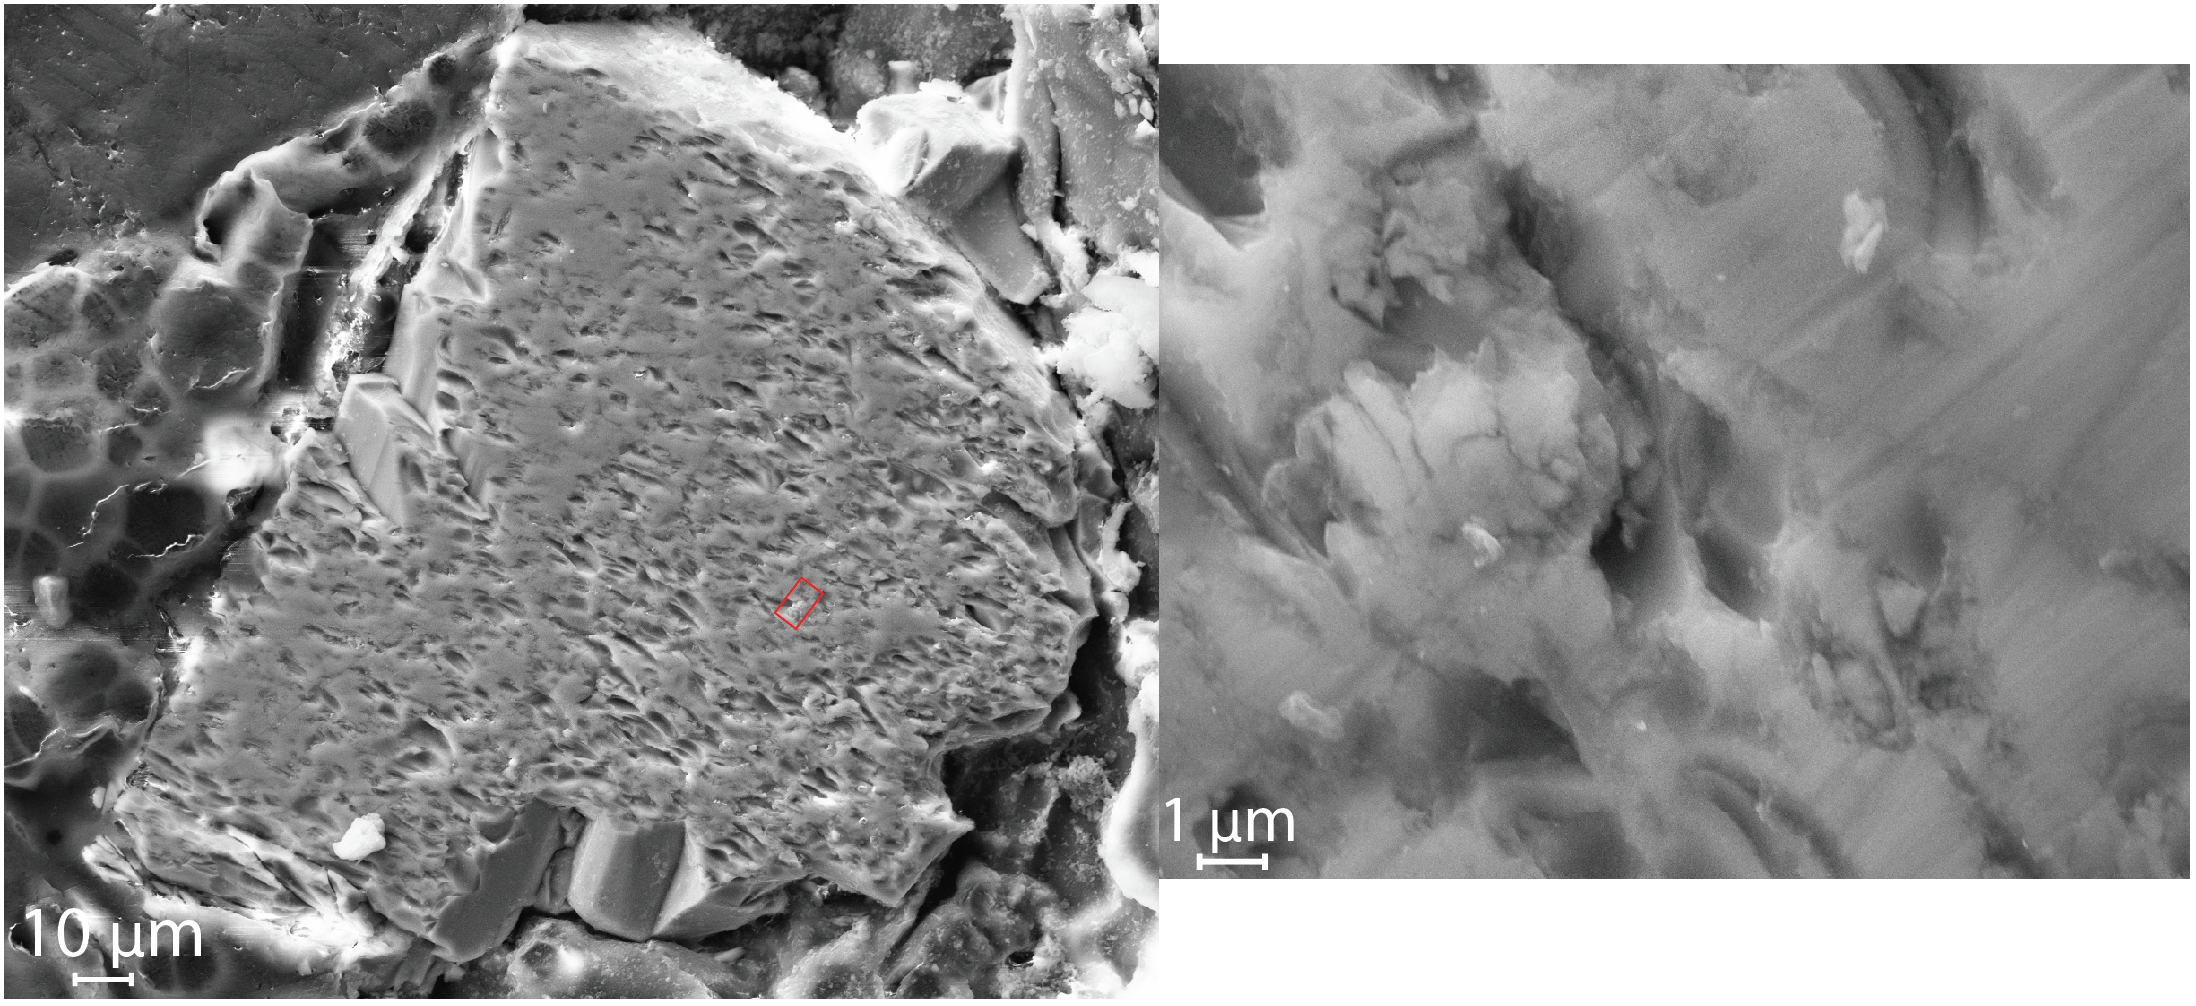
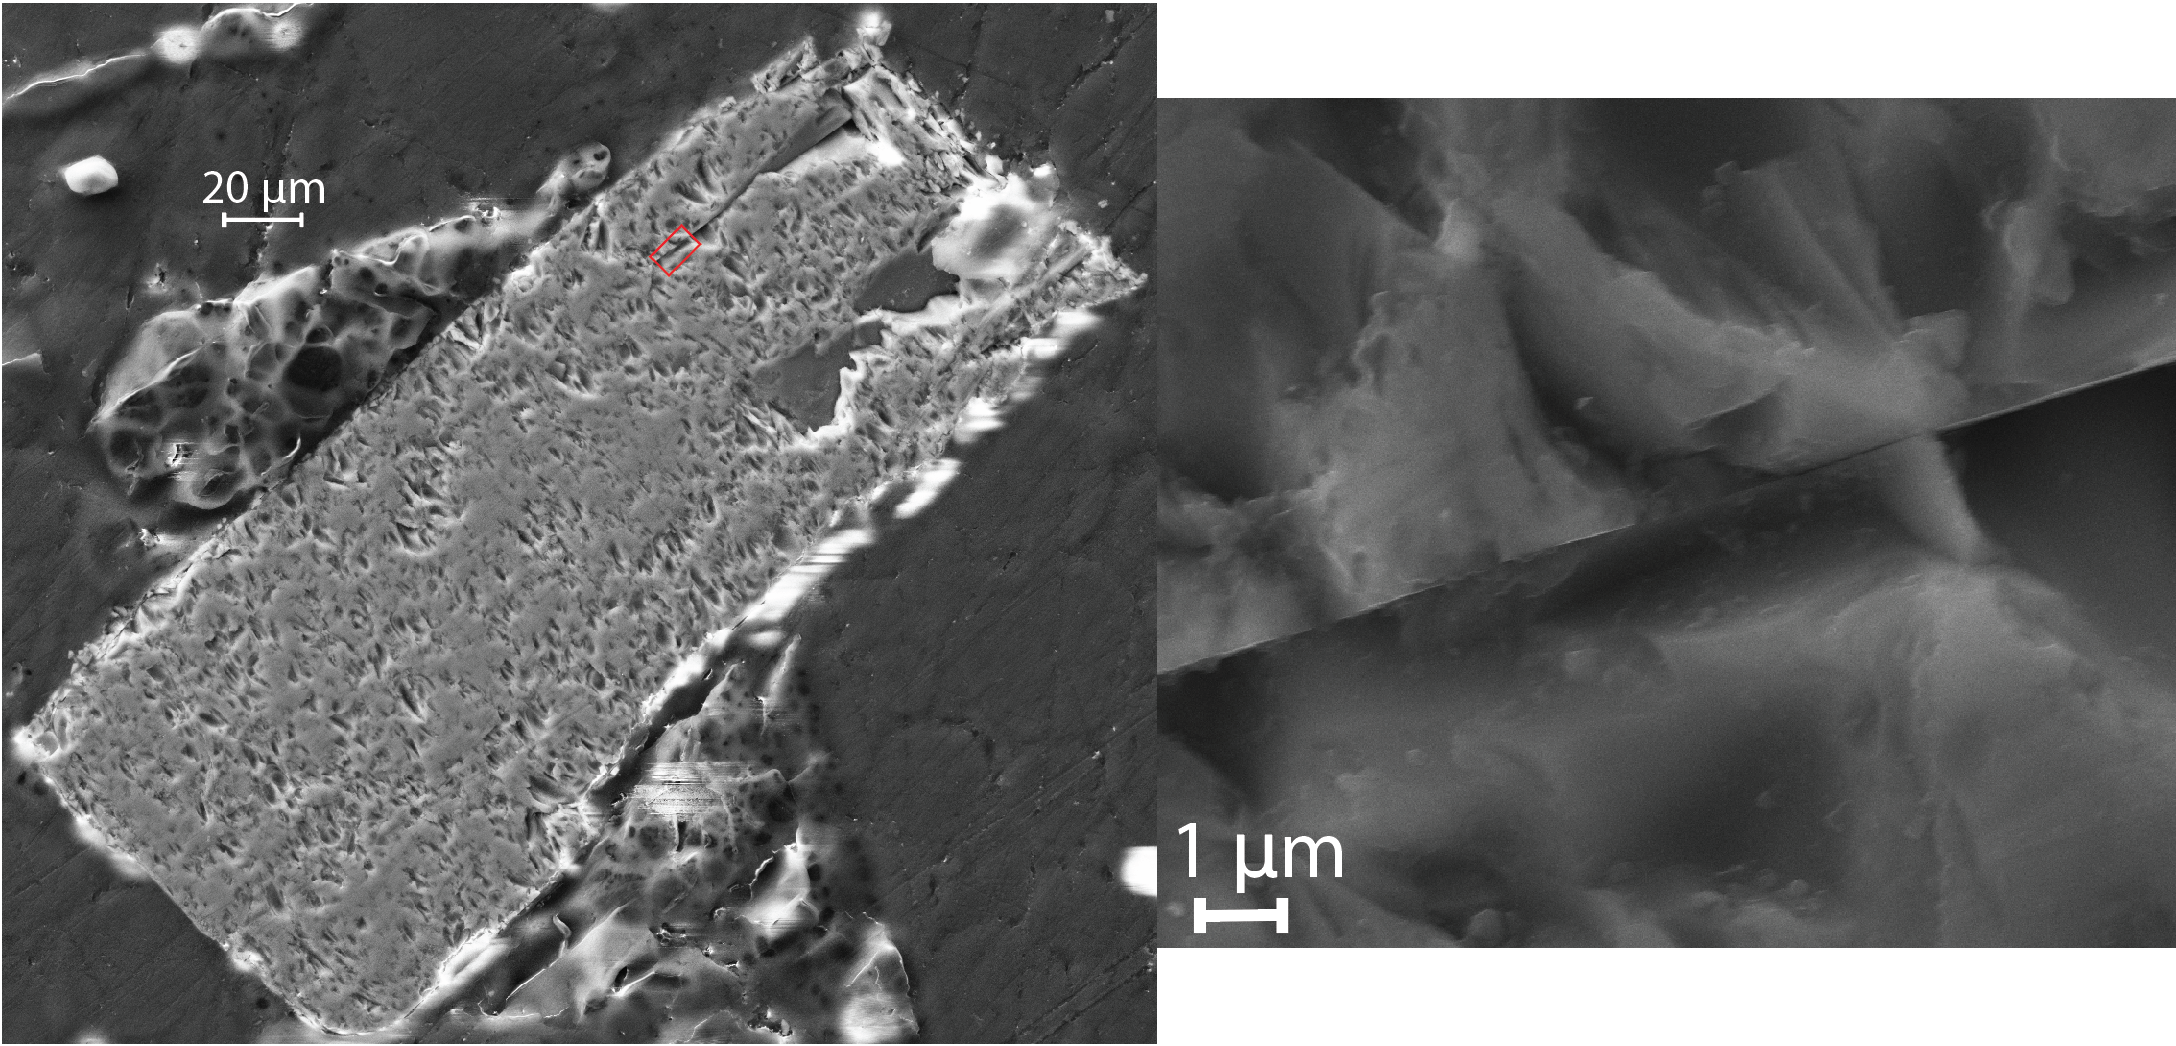
Figure 4: Specimens (a-e) all show charging around the edges, indicating a disruption in the charge on the surface provided by the electron beam. Specimens b and e show a great example of cracking and shifting the face of specimen during polishing. All the specimens seen have a close up image of the surface located next to the large scale image. This is the text thats going to be white.
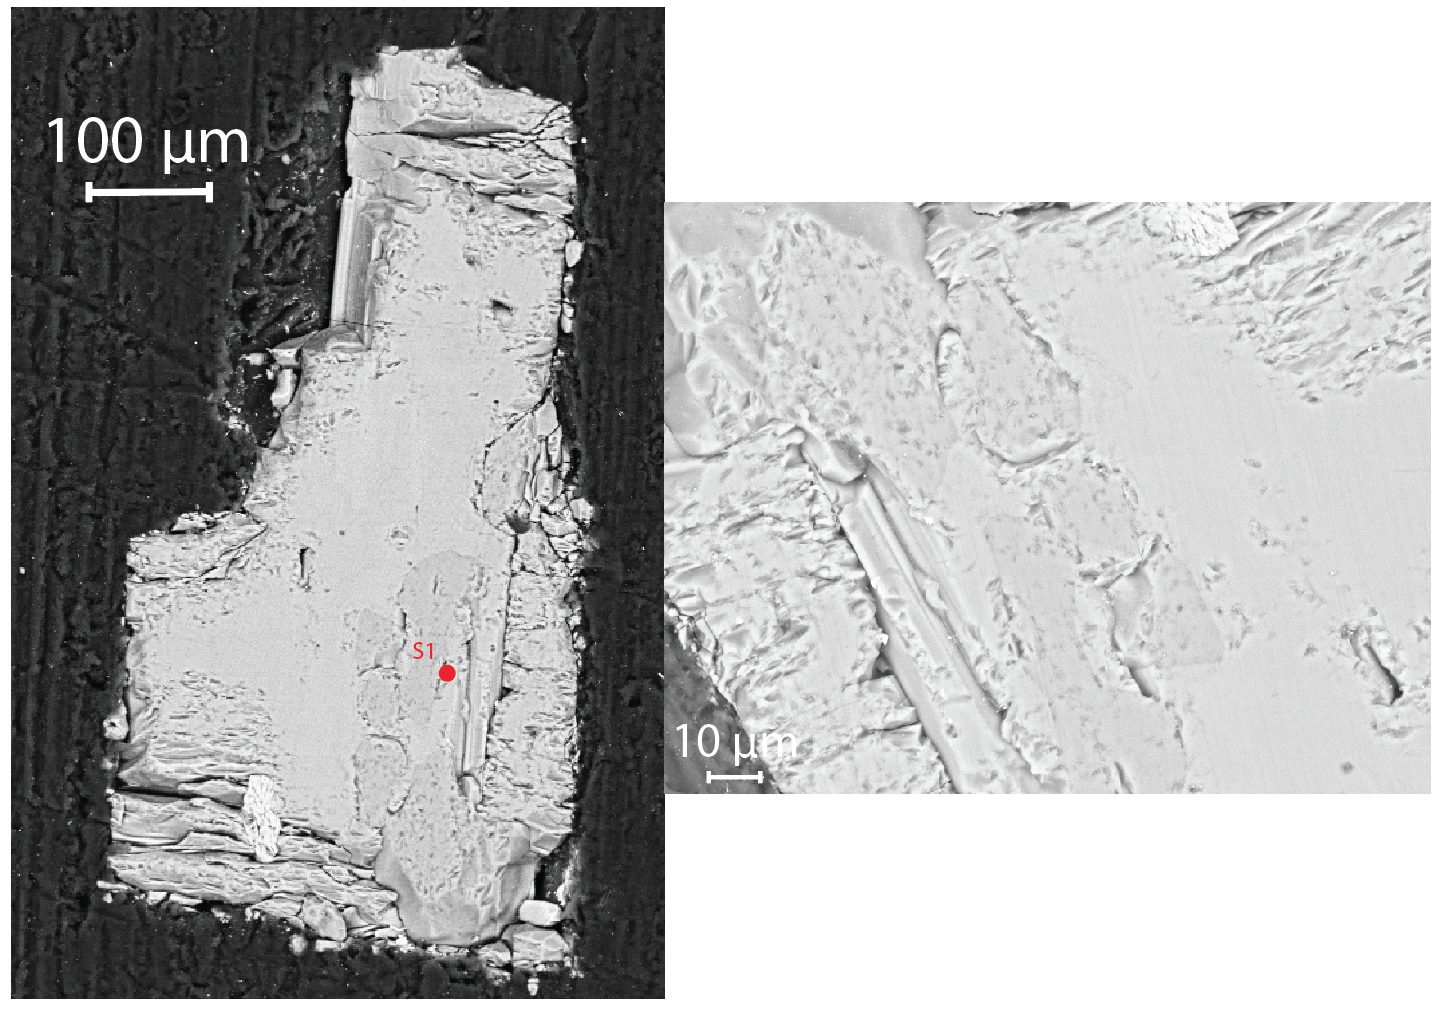
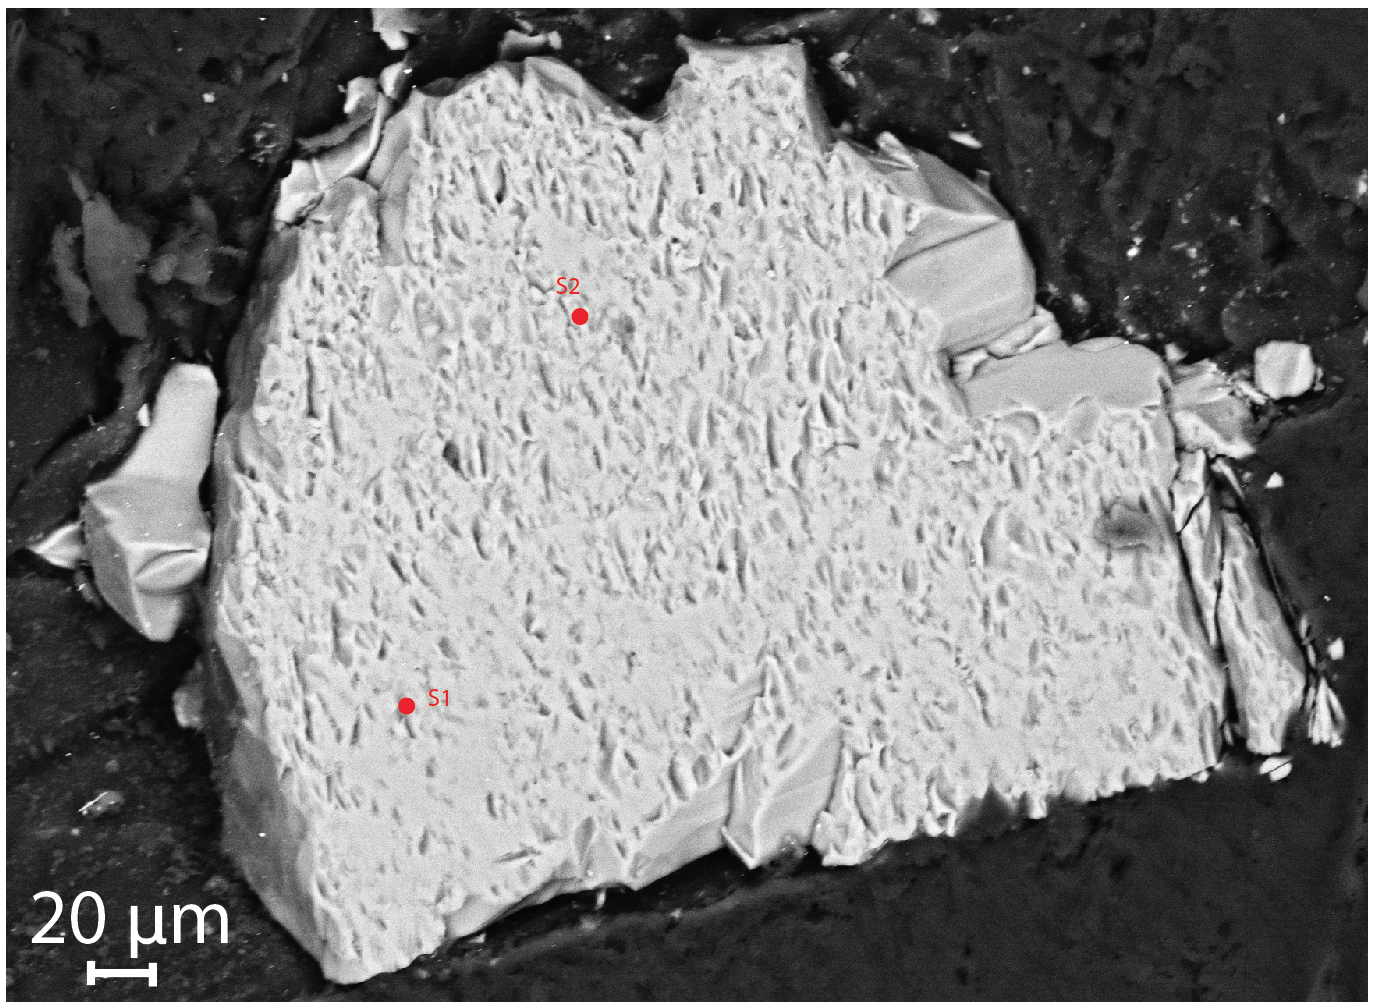
The backscatter images show that the composition of the tourmalines was very homogeneous, since the darker spots were holes on the polished face of the specimen. The elemental composition of the mineral is high compared to the carbon coating. Overall, it was found that the heaviest element found in the specimens using x-ray spectrometry was iron.
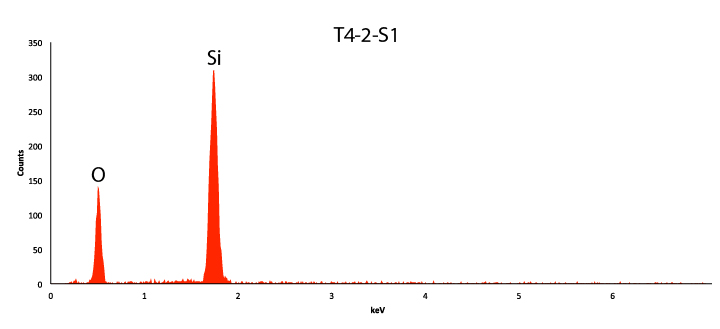
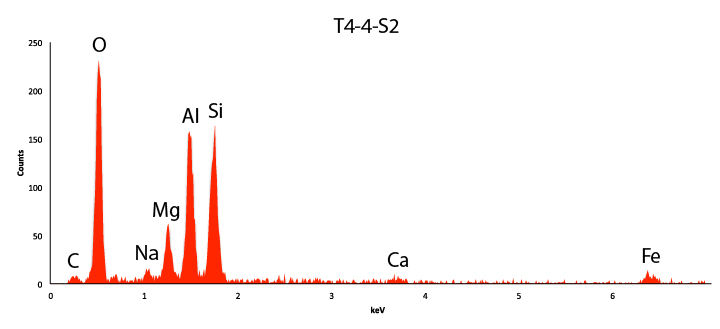
Four different specimens underwent x-ray analysis using an EDAX x-ray spectrometer system. Spots were selected on each area of the mineral to gather data for an overall idea of the composition. Different spots showed small amounts of isolated quartz as well as trace amounts of iron and calcium in other areas. Another observation was that the silicon and oxygen peaks were seen on every x-ray analysis.
a) T4-2
b) T4-4
c) T4-5
d) T2-3
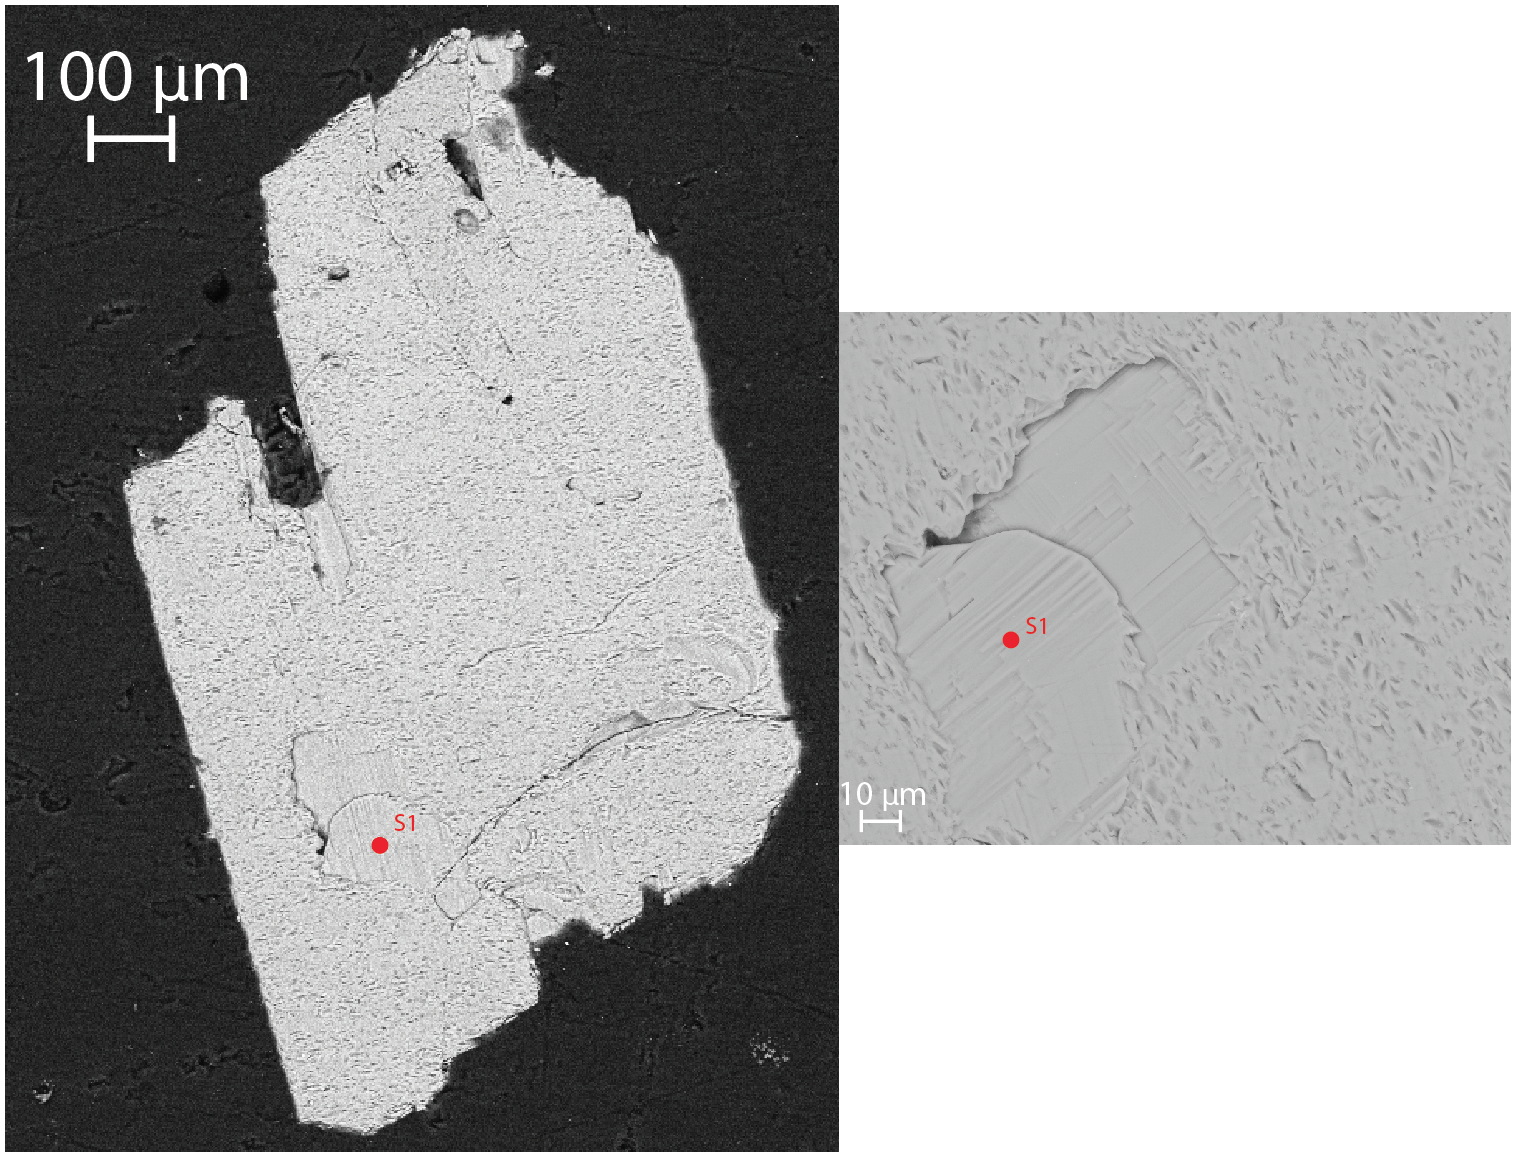
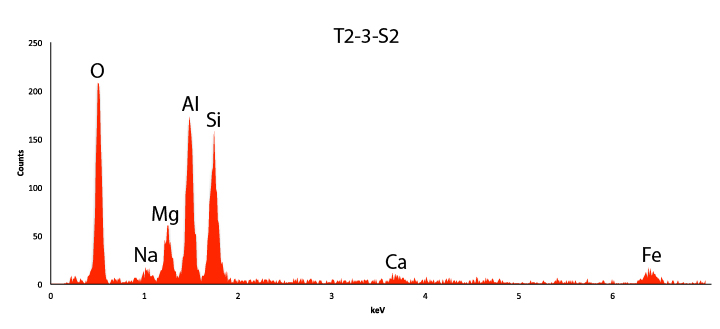
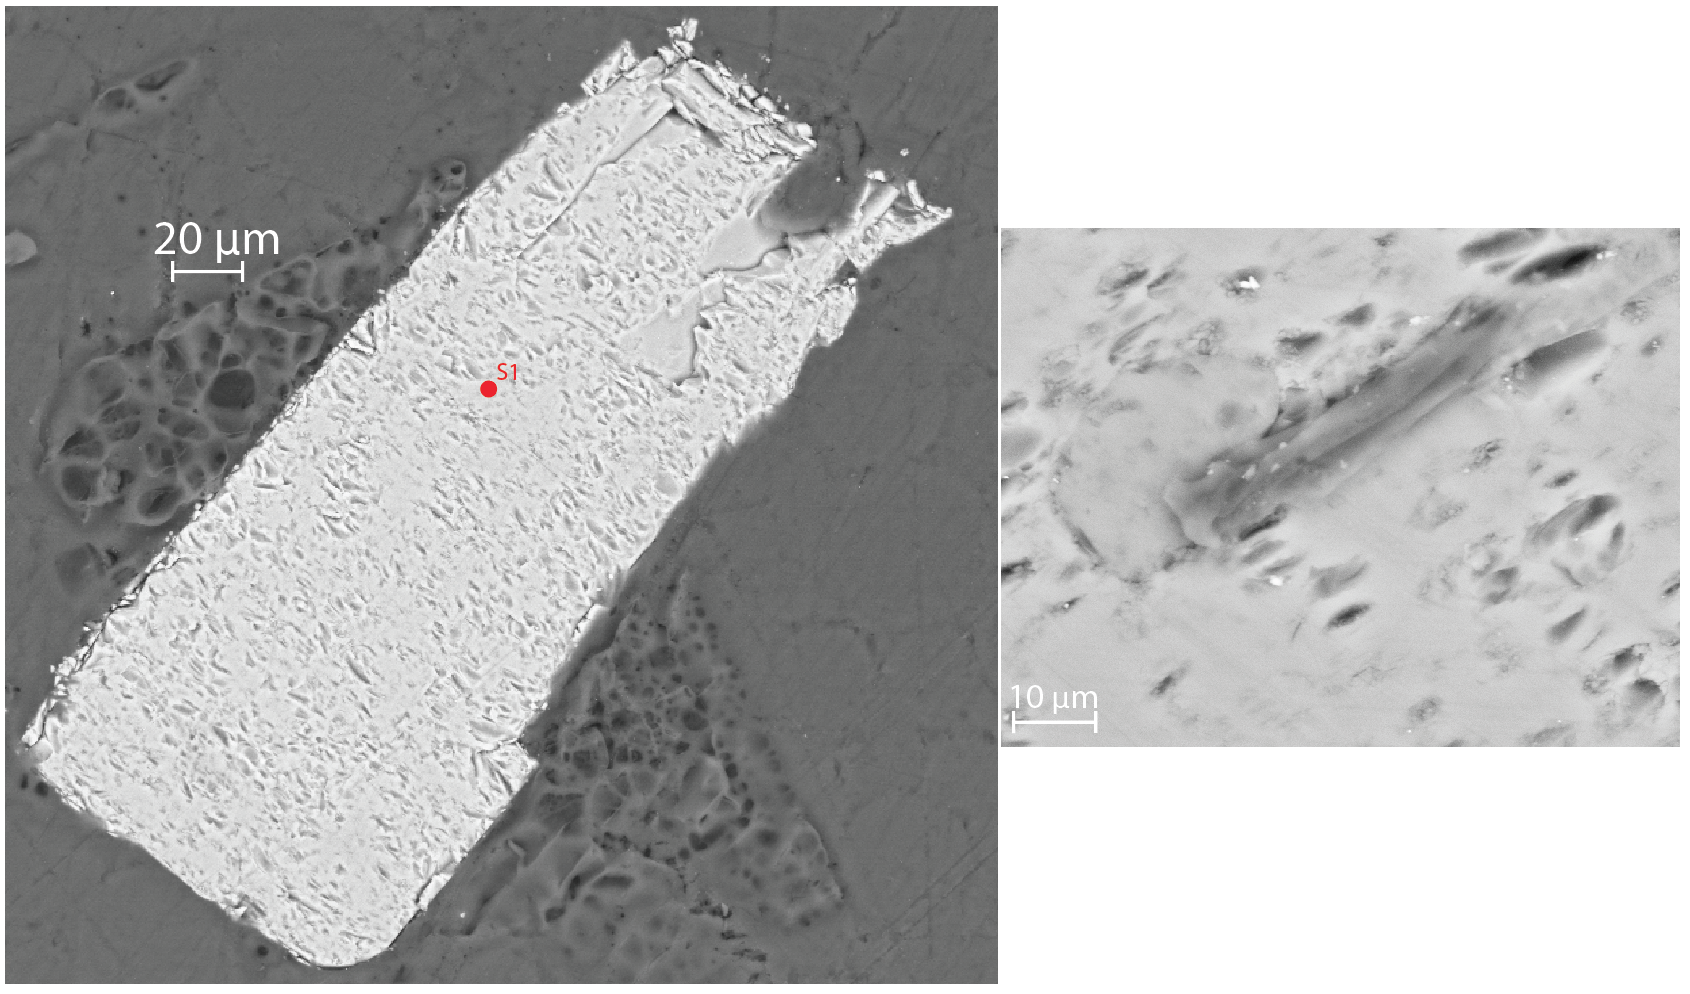
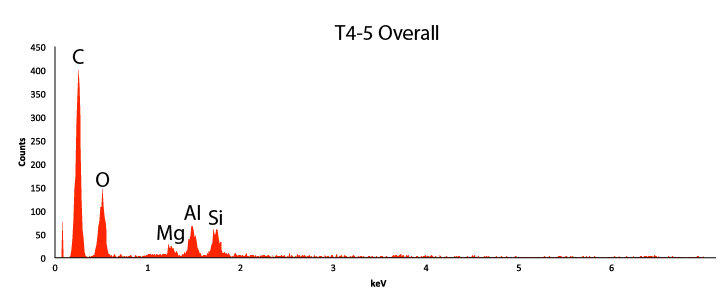
Figure 5(a-d): All of the images seen have corresponding x-ray spectra located between the pictures. The locations of the spectra analysed on the face of the specimen are marked as red circles on the backscatter image. Specimen (b) had two different spots analyzed while specimen (c) had a sample analyzed and the whole specimen itself was analyzed, as seen by the large carbon peak.
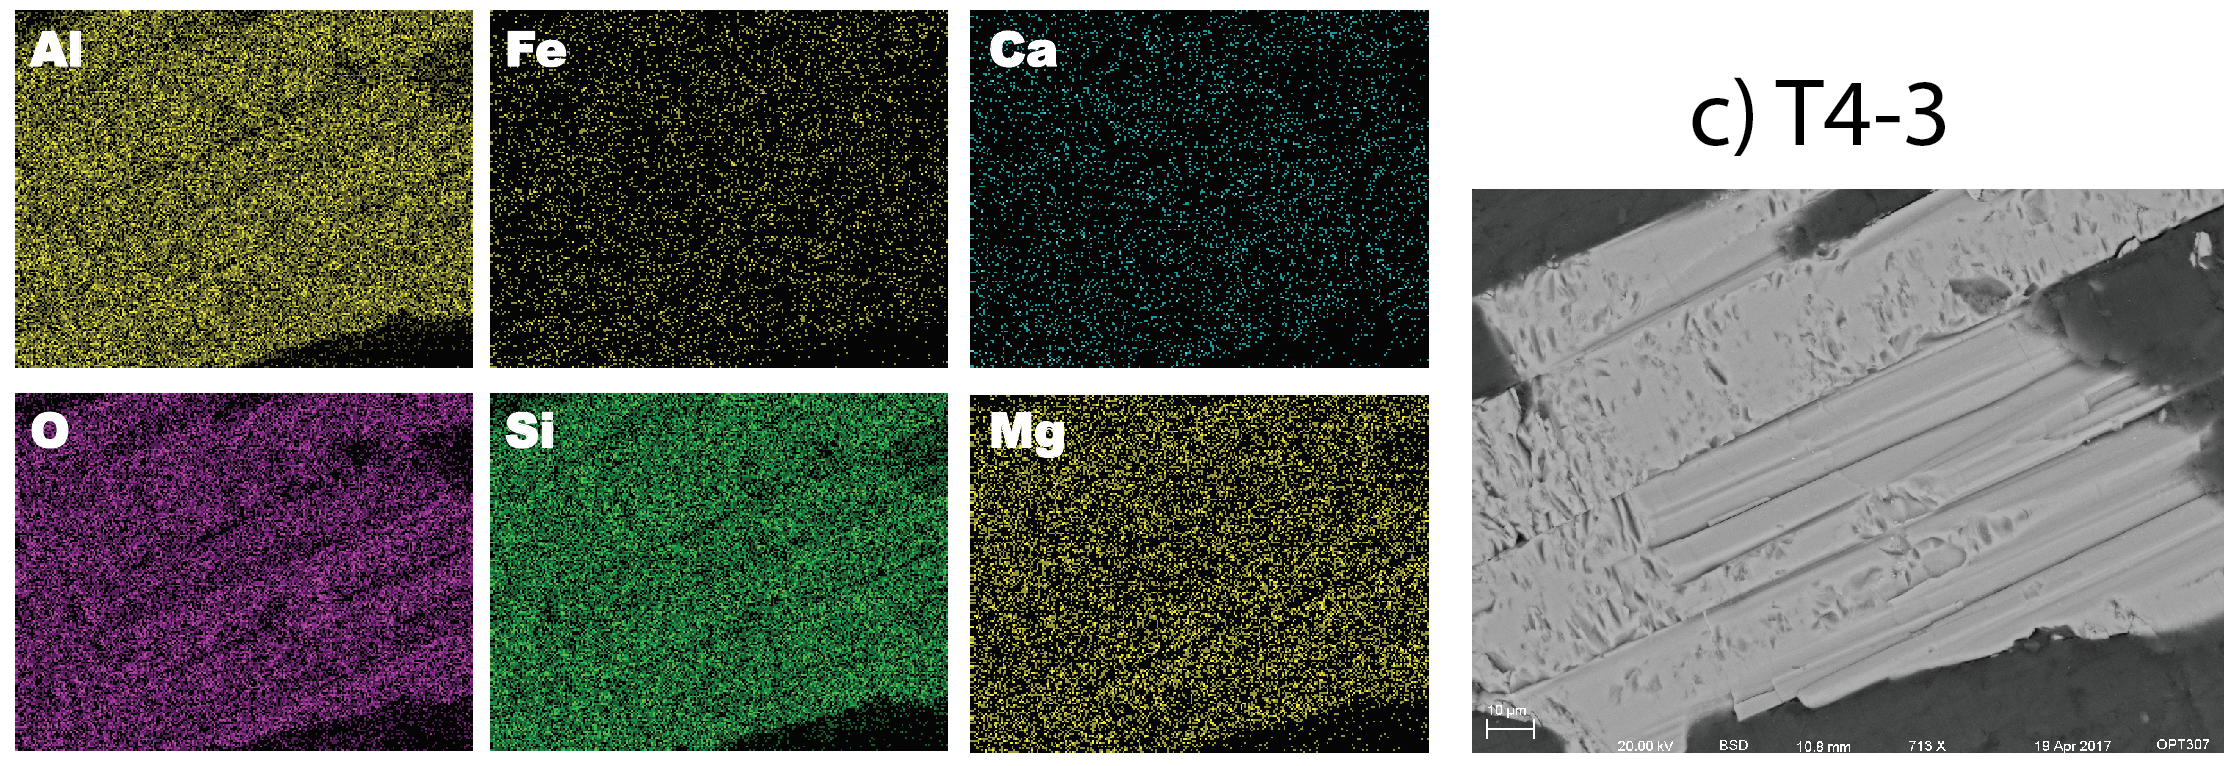
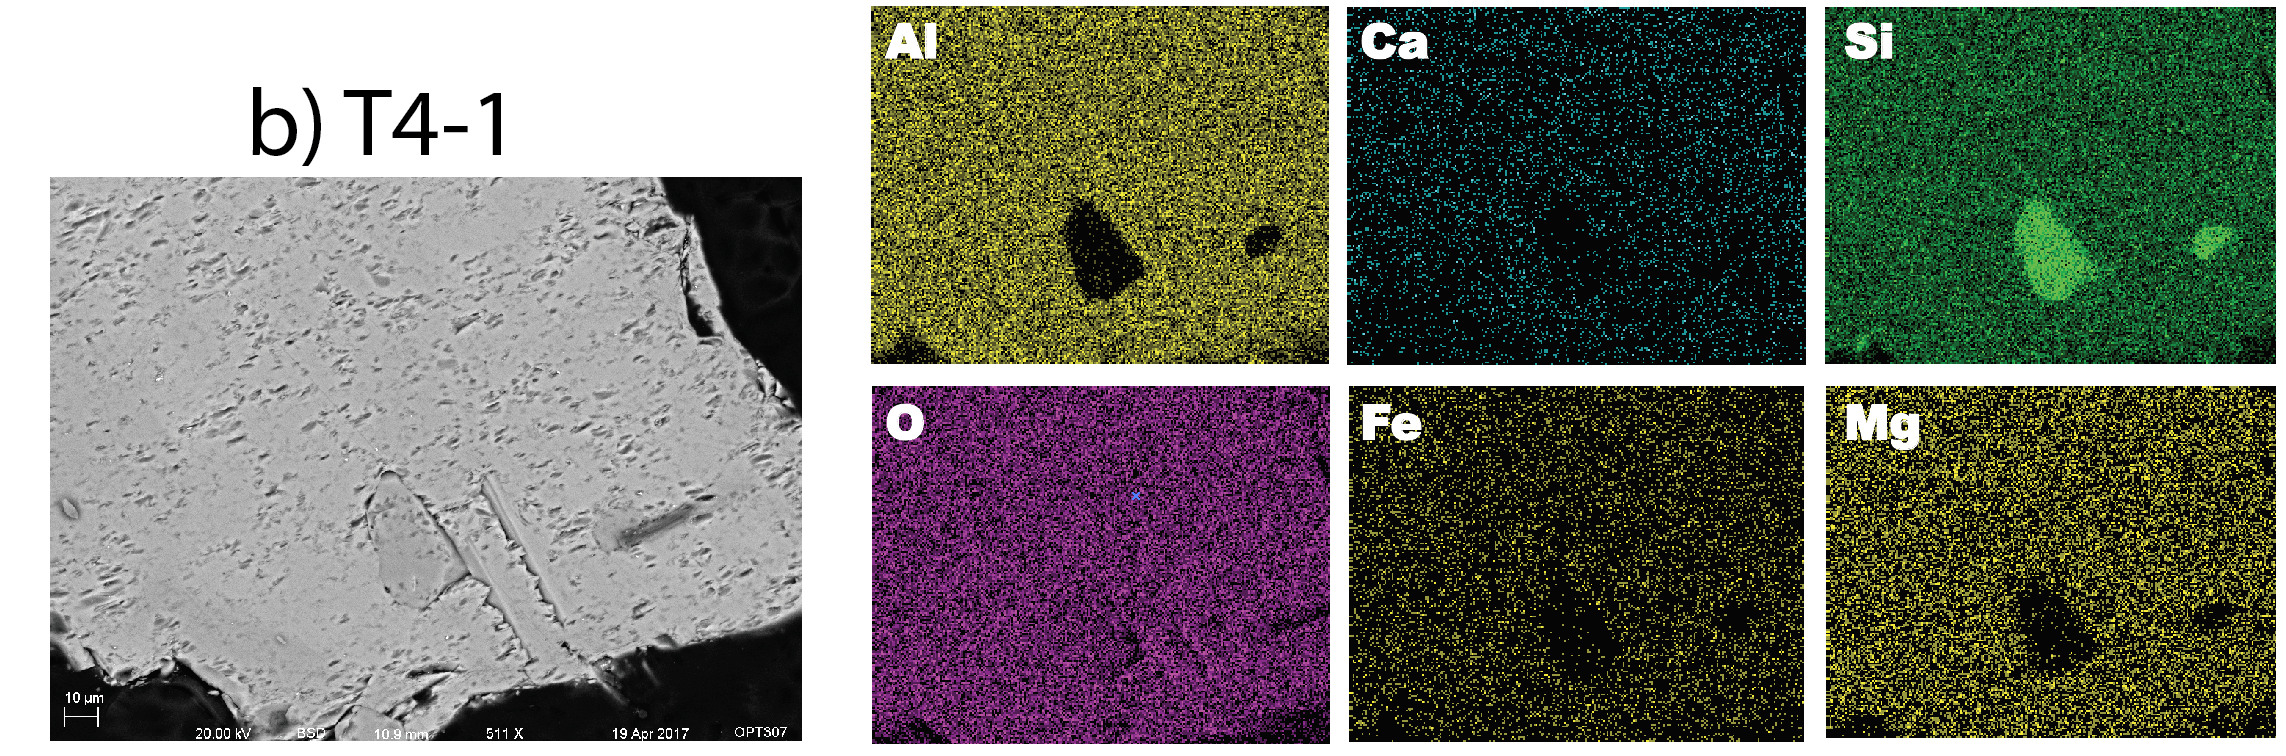
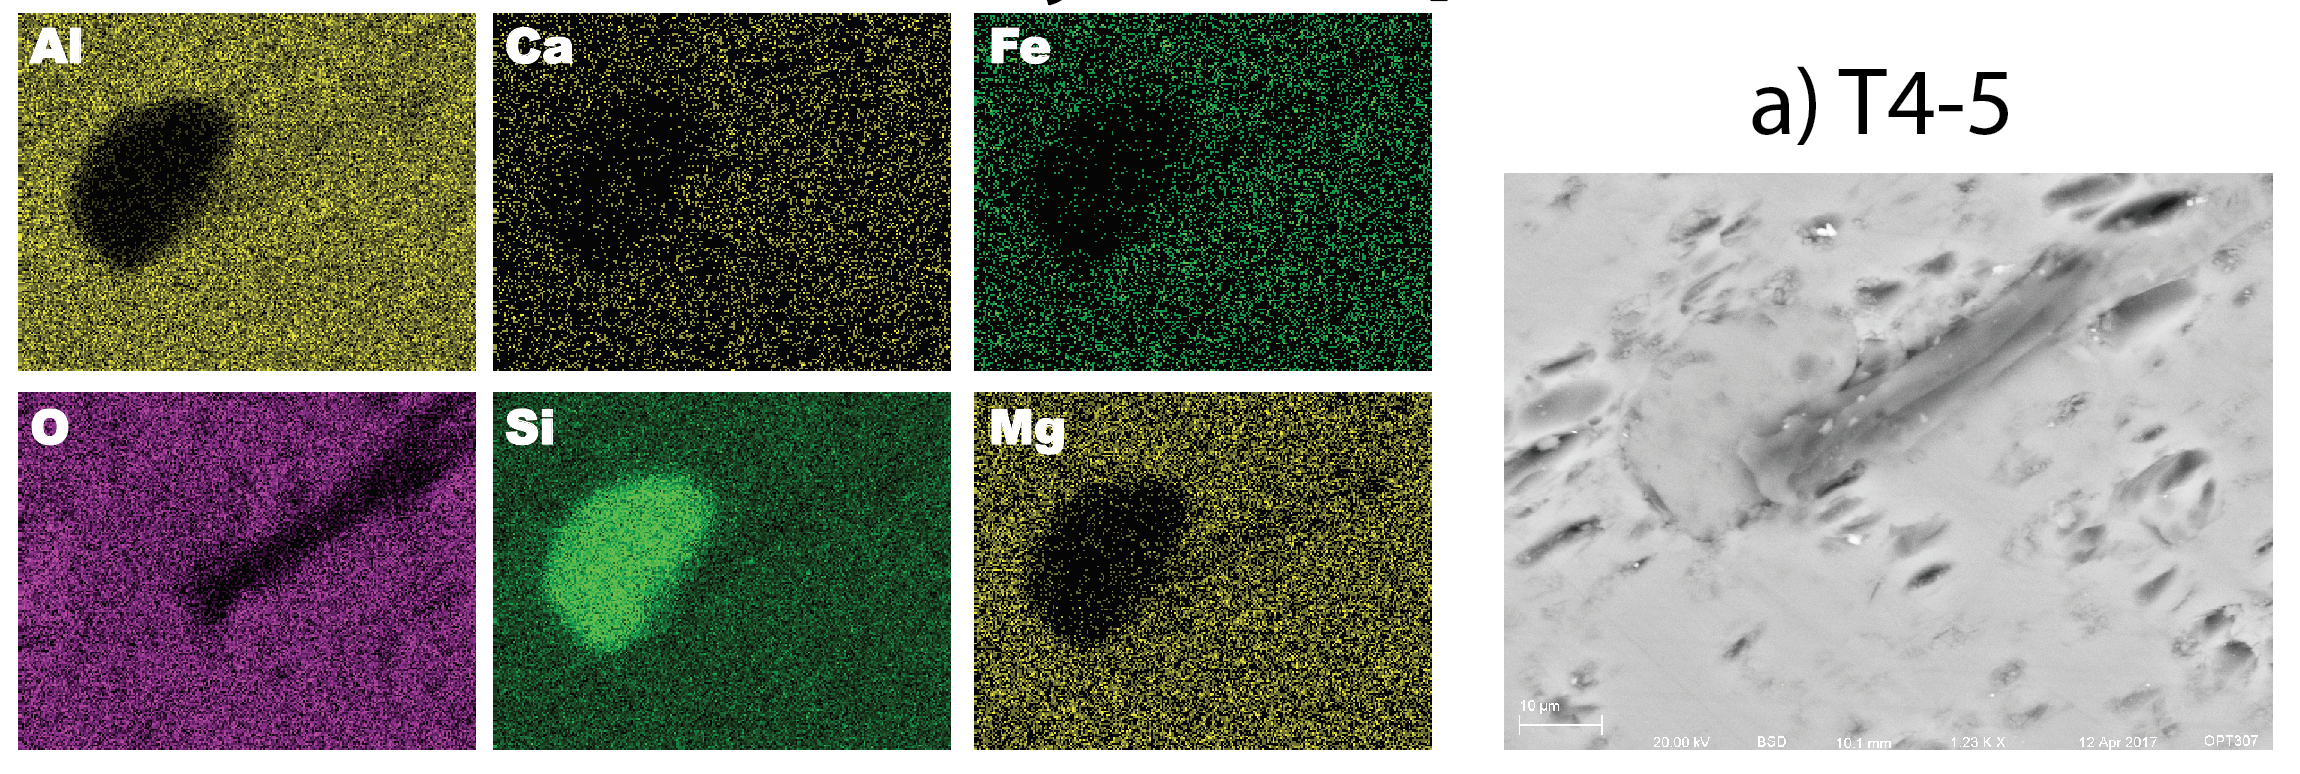
Figure 6 (a-c): Three different specimens were analyzed using x-ray spectrometer to form maps of different elemental compositions. X-Ray maps of several different regions were found to contain silicon, oxygen, aluminum, and magnesium. Trace amounts of sodium, calcium, and iron were also found in most of the specimens. These maps suggest there could also be small pockets of quartz found throughout each specimen, as there are areas with high densities of oxygen and silicon found in the maps. The trace amounts of iron and magnesium suggest that there could possibly a magnetic carrier in the specimens found. Paleointensity experiments will be needed for further analysis of different specimens found in the granite.
1. The tourmalines sampled in the area have silicon, oxygen, and aluminum, along with trace amounts of iron, sodium, and calcium found during x-ray maps and x-ray spectrometry.
2. The secondary electron images collected by the SEM show that there was some charging that occurred in areas between the epoxy resin and the tourmaline fragments, indicating an uneven charge density for the specimens.
3. The backscatter images suggest that the samples are very homogeneous, as the images show that there is no major disparity in elemental composition.
4. Further paleomagnetic analysis is needed to determine the magnetic remanence carriers found in the tourmaline specimens.
5. Further analysis under the SEM should be conducted with thin sections if the specimens prove to have a viable remanence carrier.
6. Areas of high silicon and oxygen composition suggest that quartz could be spread around in each sample, and cause some possible diamagnetic readings in paleomagnetic experimentation.
First, I would like to thank the Unversity of Rochester paleomagnetism lab for letting me analyze some of their specimens. I would like to thank Tim O’Brein for his assistance in mounting the specimens in the cold setting epoxy resin sample. I would also like to give a huge thank you to Brian McIntyre, a professor who helped me greatly through the project, and taught me basically everything I know about microscopy, whether its the TEM or the SEM.
Sinadinovski, C., Edwards, M., Corby, N., and White J. (2005). Earthquake Risk. Geoscience Australia. 143-208. Retrieved April 28, 2017, from https://www.researchgate.net/publication/274955580_Earthquake_Risk.
Joann E. Welton, (1984), SEM Petrology Atlas, Tulsa, Oklahoma: The American Association of Petroleum Geologists