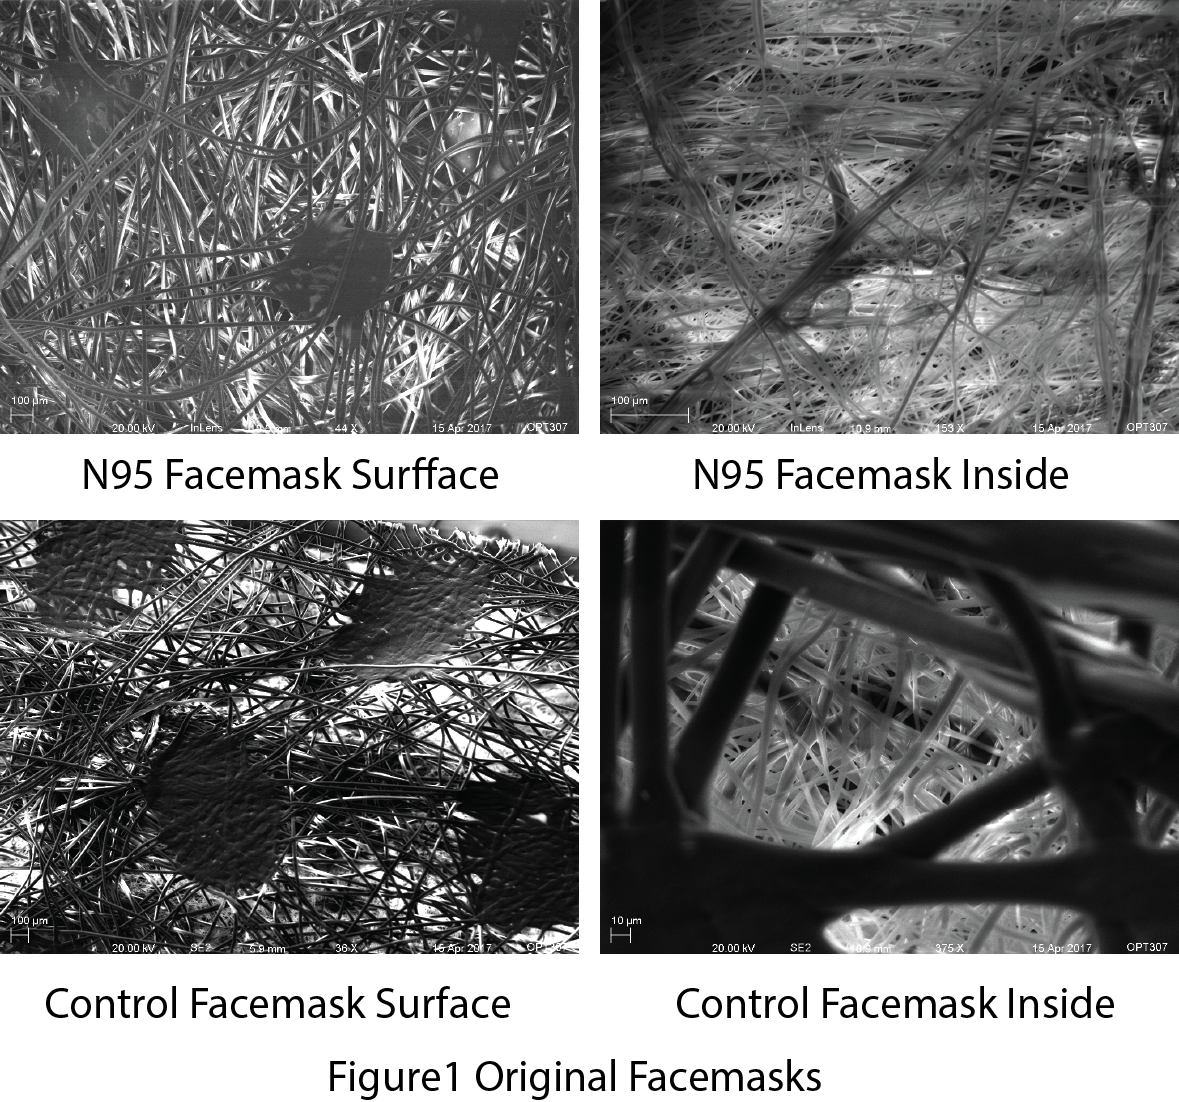
In this Section, I'm going to show the SE2, Inlens and BSD images for both N95 and Control facemasks. In Figure1, two different facemasks were detected by the SE2 and Inlens detectors. There are several layers in both facemasks and all the layers are made of carbon fiber which was compressed together.
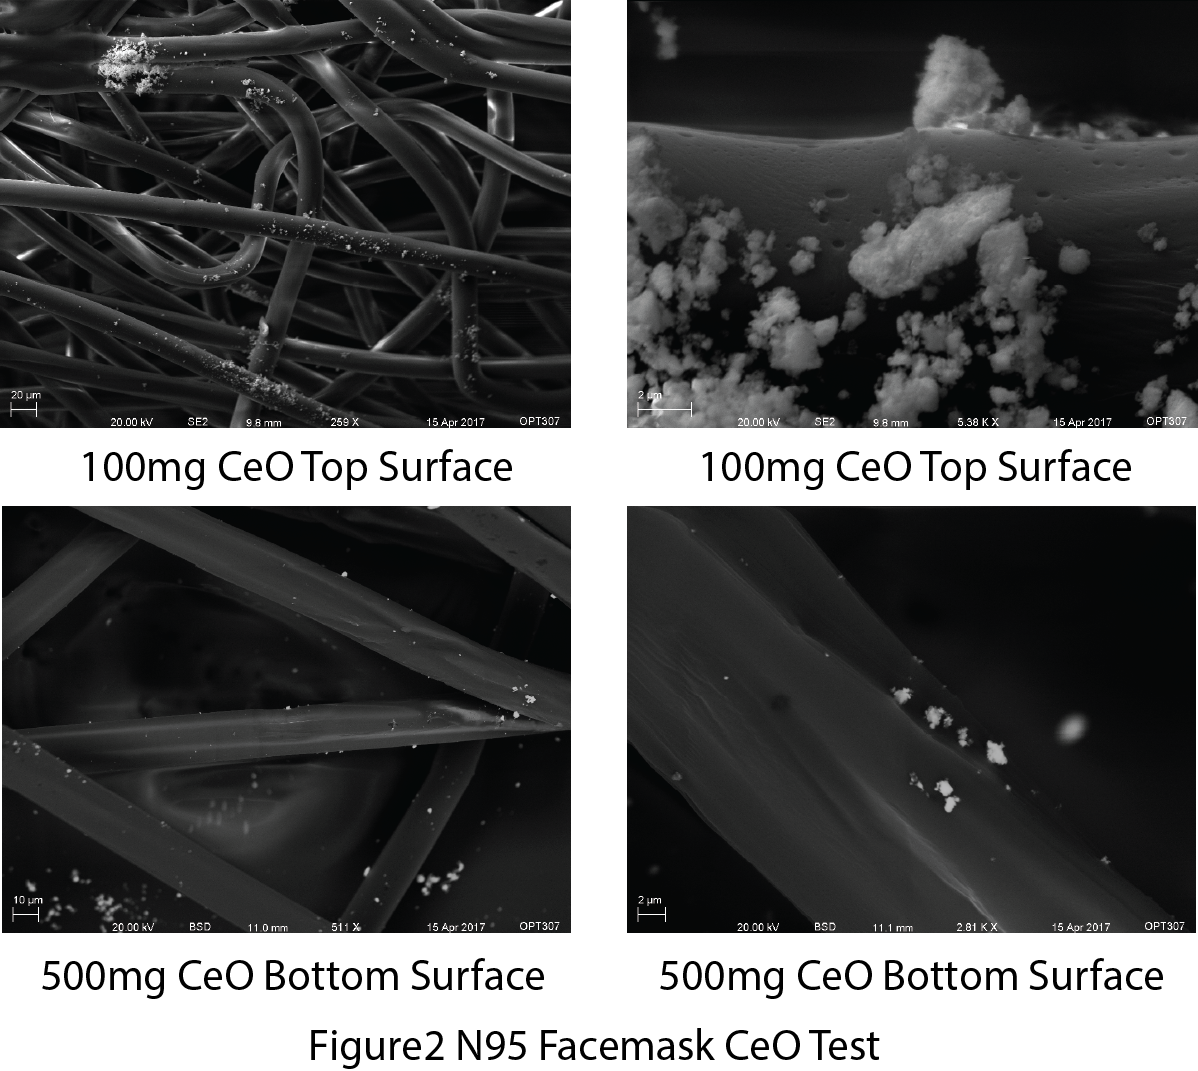
After the CeO test on the facemasks, the BSD detector together with the SE2 were used for testing the CeO particles on and inside the facemasks. Figure2 showed the N95 facemask after 100mg and 500mg CeO test. The top surface means the side of facemask directly attached to the CeO particles and bottom surface will be the side that attached to the vacuum line. Under the BSD detector, it is clear that the particles went through the N95 facemask but the size of the particle is not 2.5um which has been calculated through the ImageJ program. The average area of the particle in 500mg CeO bottom surface is 0.057um2 which is smaller than the 2.5um particle. The biggest one is about 0.698um2.
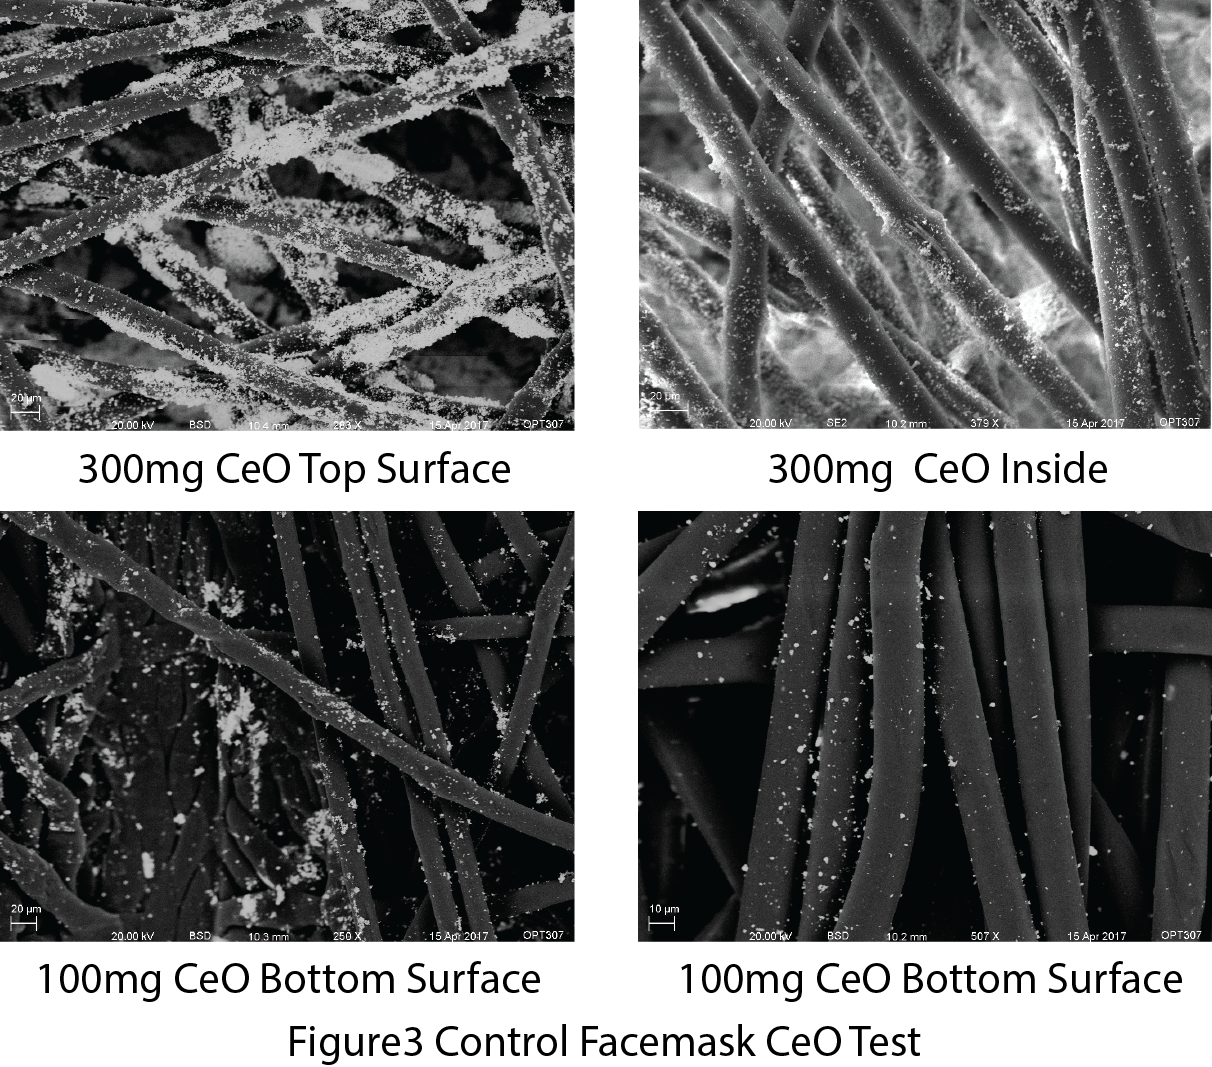
Next, the control facemask CeO particle test results is showed in Figure3. There are large amount of particle that attached both the top and bottom surface. The precisely number will perform through the EDAS test which will show in EDS Analyhsis section.
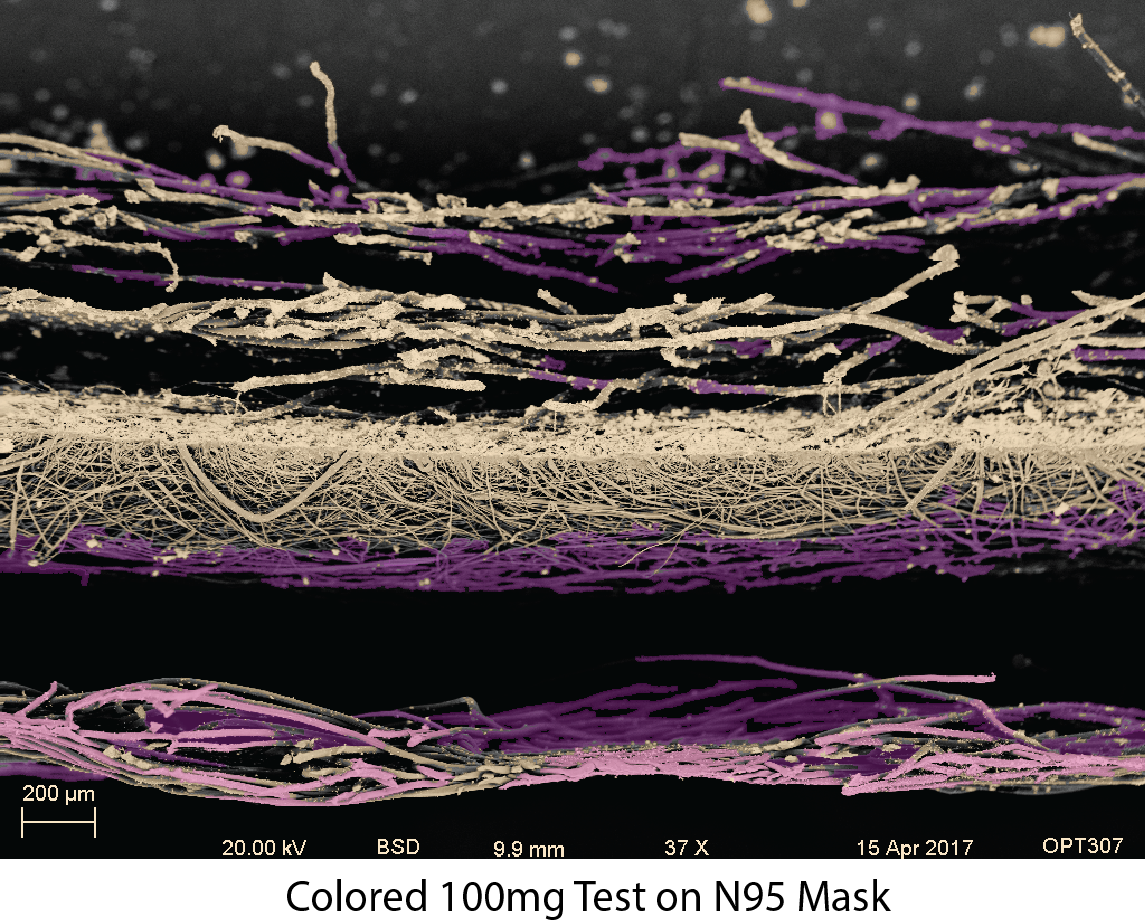
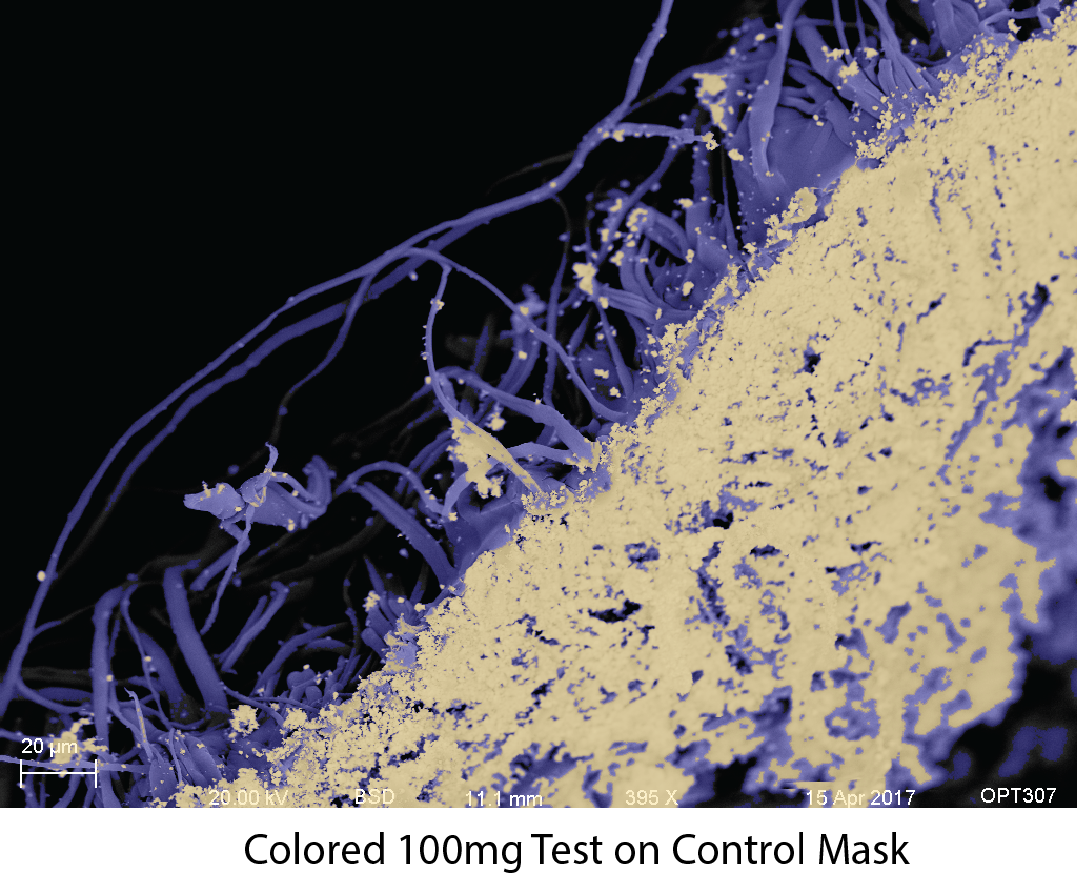
Last, in order to show the difference between the facemask and CeO particle, I used BSD detector to get the image of the cross section of the facemask and color the image with different color which showed in next two images. The yellow part will be the particle and the purple and blue parts are the carbon fiber in facemasks.