|
Introduction |
Ecperimental Setup and Results |
Conclusions |
Introduction
1. Human Samples
2. Project Purpose and Microscopy techniques
For this project, samples were collected from students of diverse backgrounds and different nationalities. The point of our study was to explore, observe and note any interesting similarities and open the door for any potential long-term research based on this project's initial findings. Besides observing hair and fingerprints through light microscopy, other imaging and microscopy methods are implemented such as: Secondary Electron Microscopy (SEM), Back-Scatter Electron Microscopy (BSM) and Electron Dispersive Spectroscopy (EDS).
Second Electron and Back Scatter Electron Microscopy Modes allow us to observe surface characteristics such as interesting features on the fringerprint traces as well as surface damage, composition, cross-section structure, etc. of hair samples. By conducting characteristic X-Ray analysis (EDS), elements present on a fingerprint sample surface such as salts, skin cells can be identified We also use ImageJ to count the number of small particles on one of the fingerprint sample traces.
Experimental Setup and Results
1. Sample Prepation
First, all participants were asked to provide samples as is (no prior alteration to behavior such as hair or hand wash or specific instructions). The point is to conduct authentic analysis on samples to observe realistic results. wafers made of Silica and fused Silica were used for the fingerprints. Hair samples were observed both laterally and longitudinally to provide surface and cross-sectional information. A stub was altered to allow the vertical placement of hair strands in the microscope. As the samples are biological and electrically isolating, all samples were sputter coated with gold to solve the charging problem.
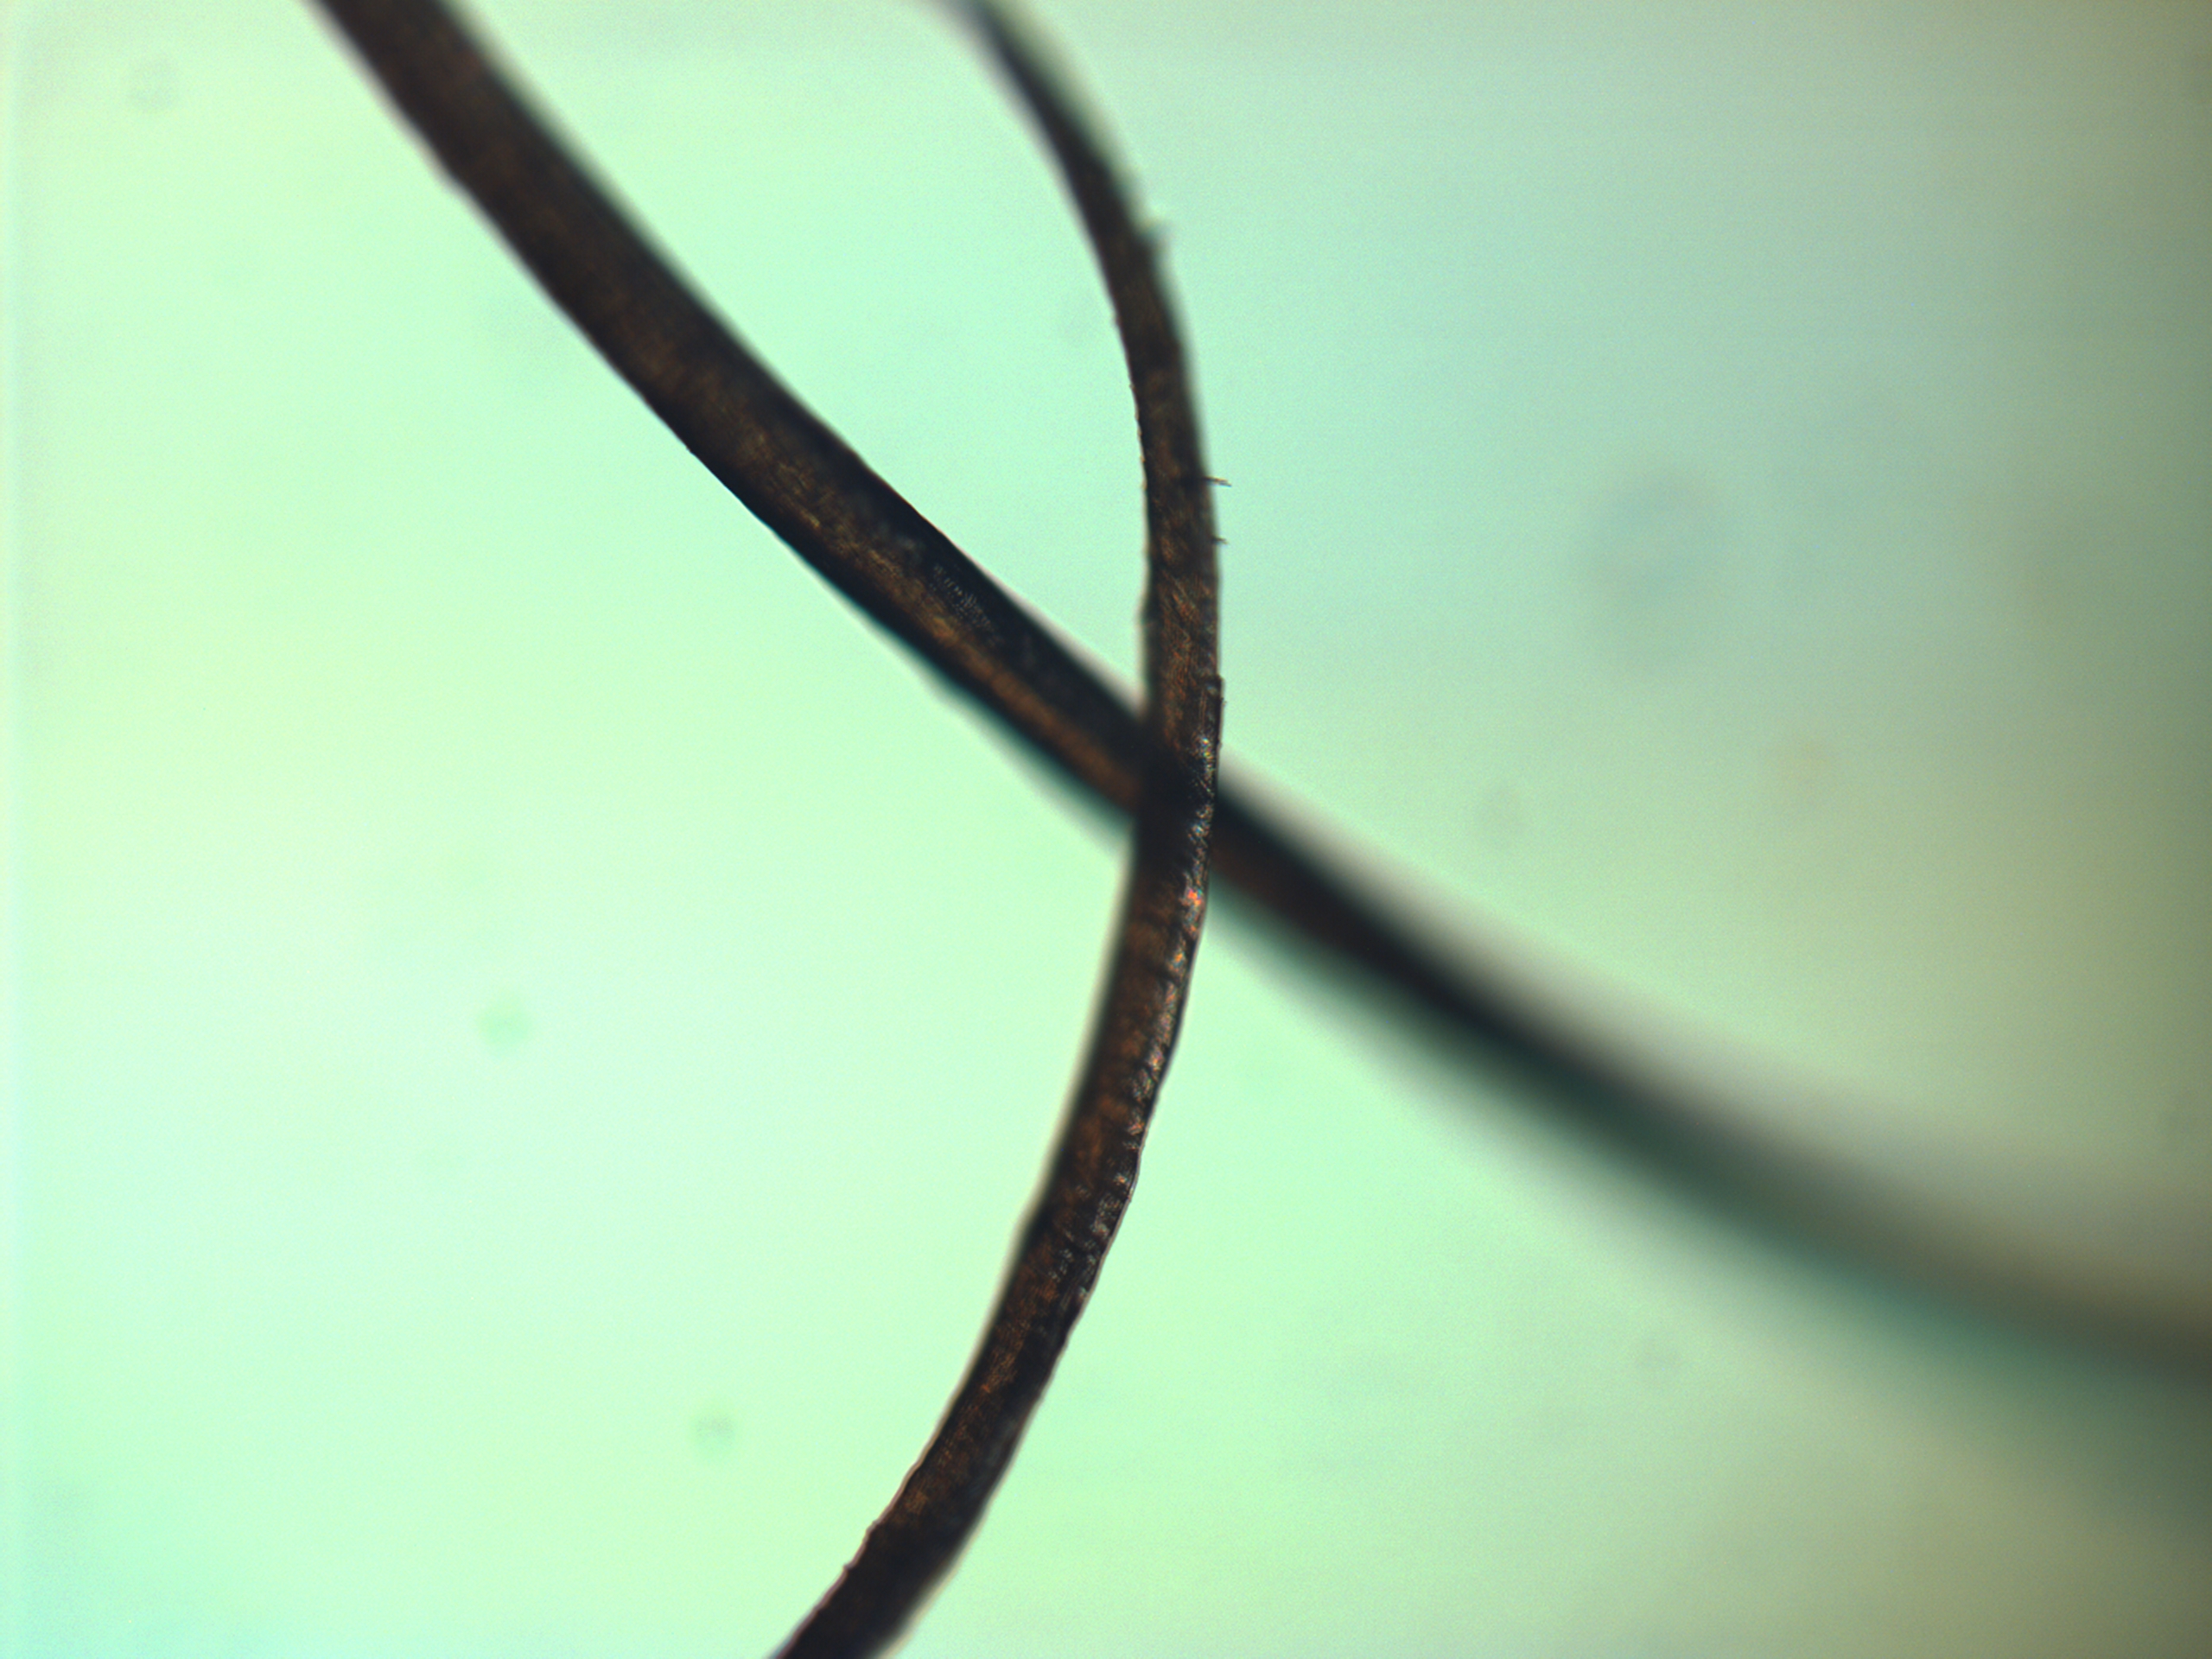
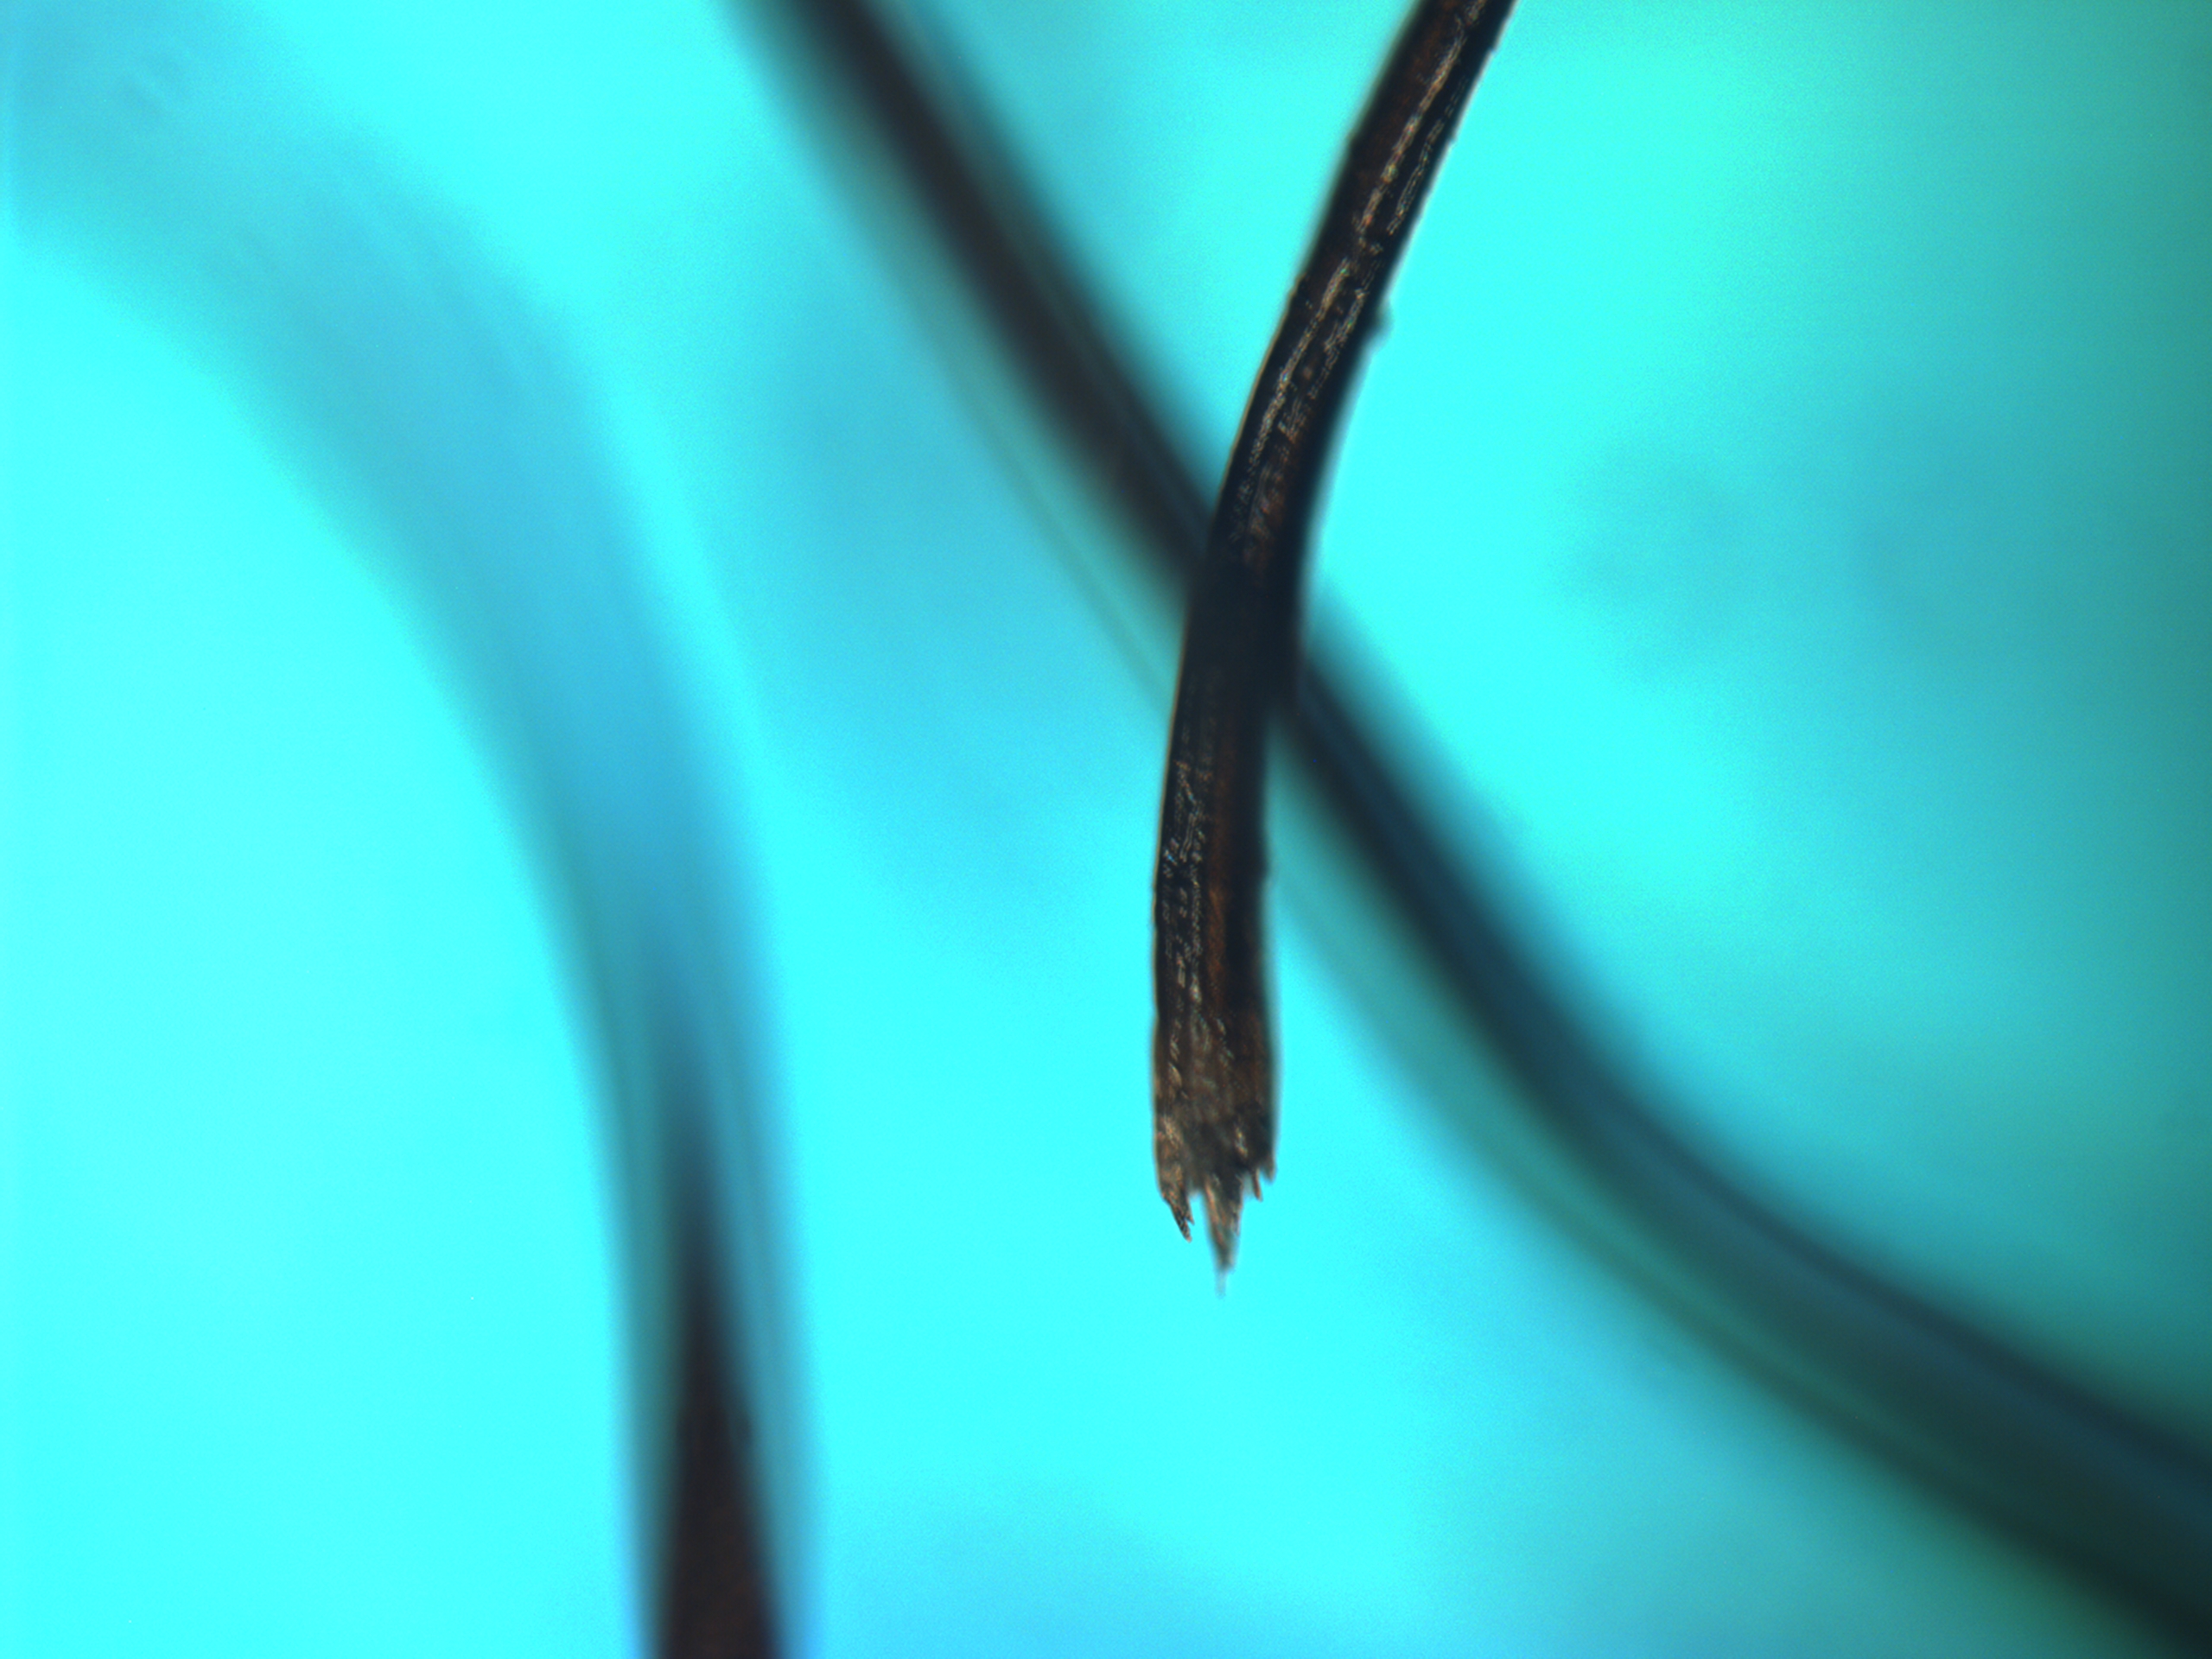
2. Light Microscopy
Select hair sample material were observed with a light microscope, uncoated. To provide data diversity, not the same samples were used for this step as the ones displayed in the later sections.
The figures below present the results as observed:
|
|
3. Secondary and Back Scatter Electron Microscopy
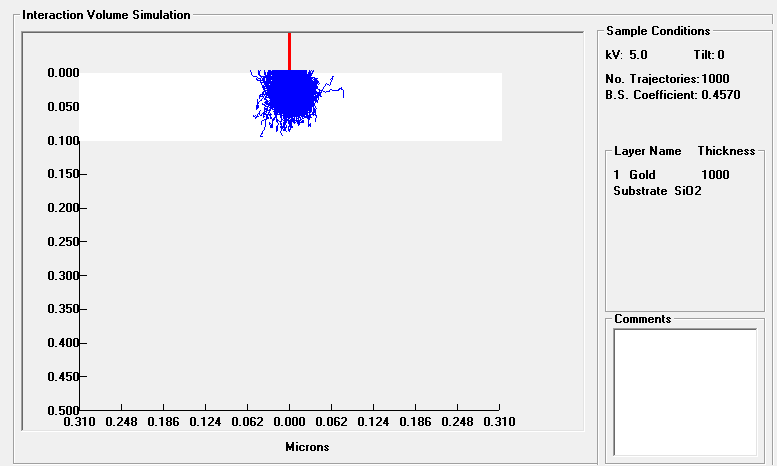
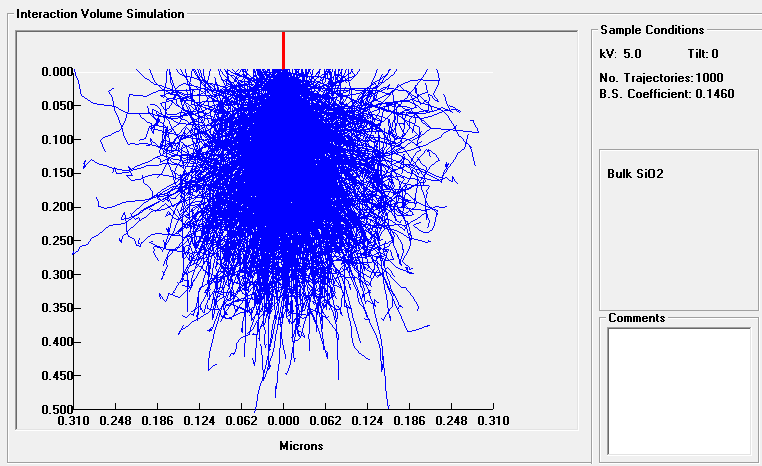
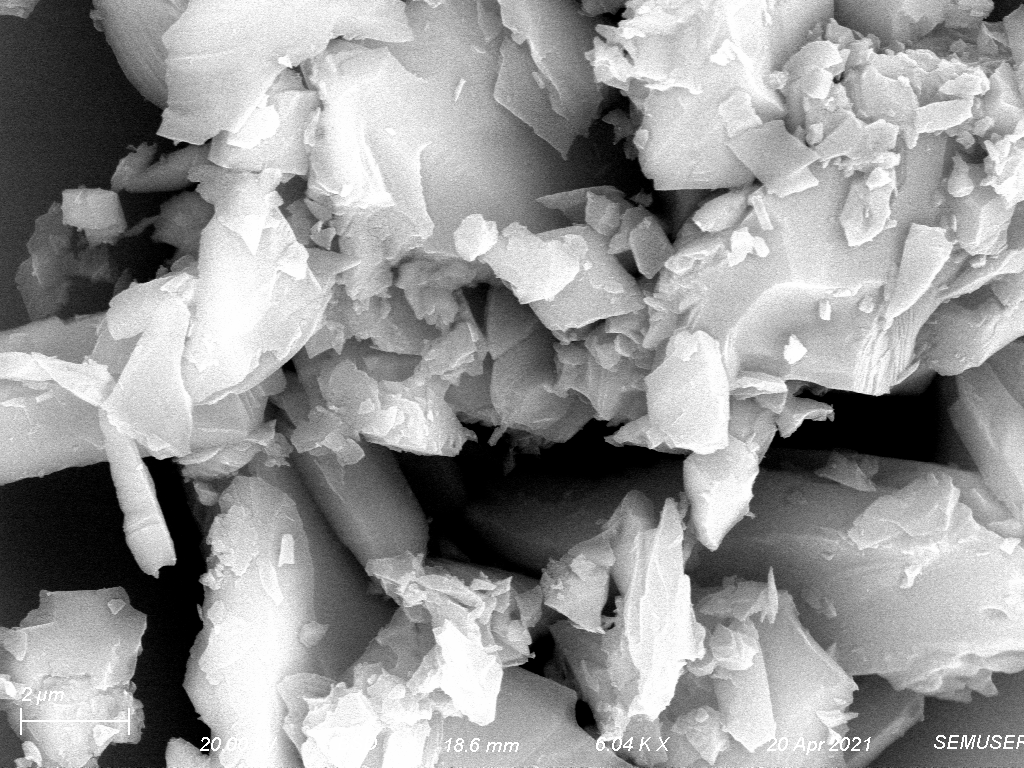
1. Interaction Volume
|
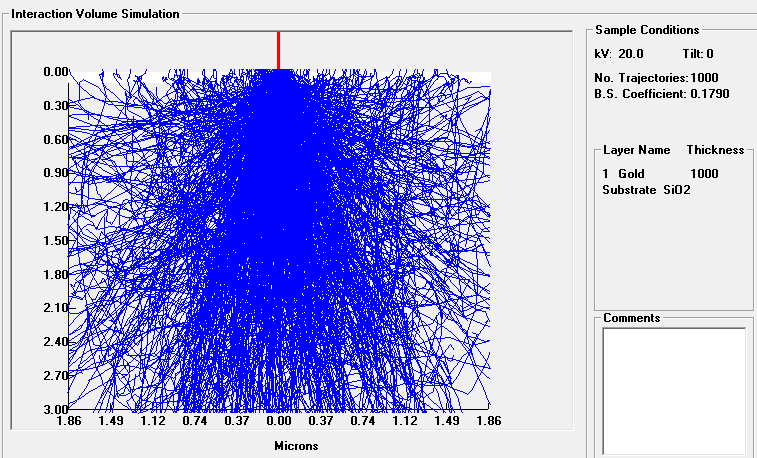
Figure 3.1: Comparison between the beam interaction volumes for low and high Acclerating Voltage (5 KV and 20 KV) on a fused silica sample when uncoated and coated with gold through the Electron Flight Simulator (EFS) software. Note the difference in interaction volume between the three situations.
|
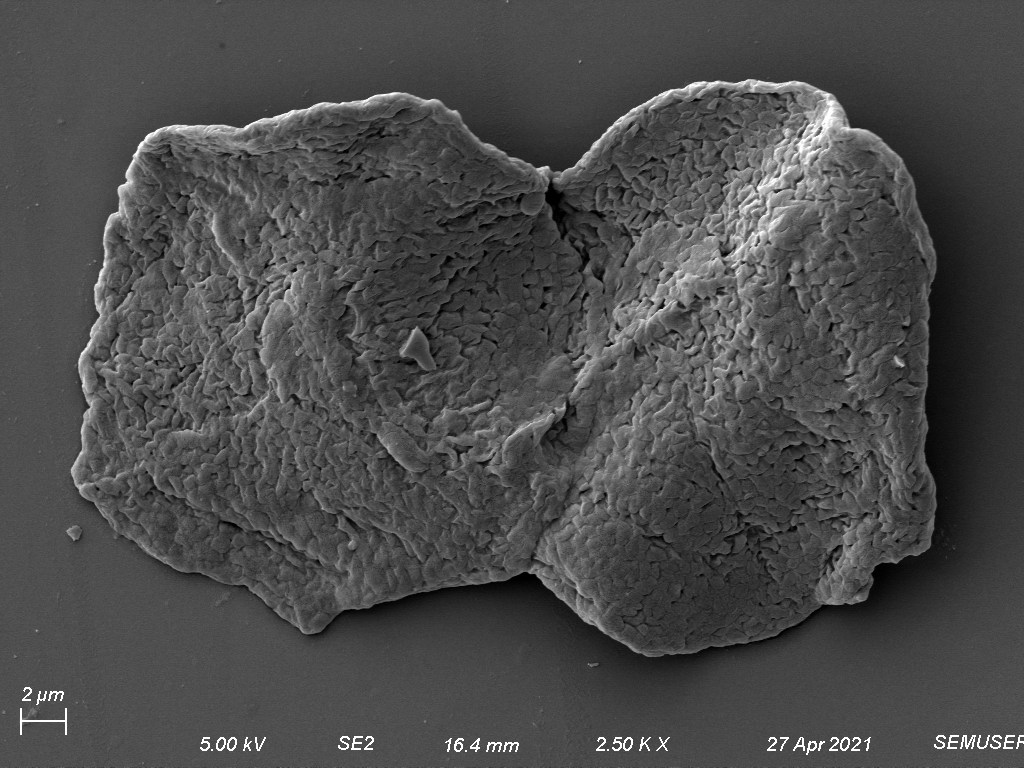
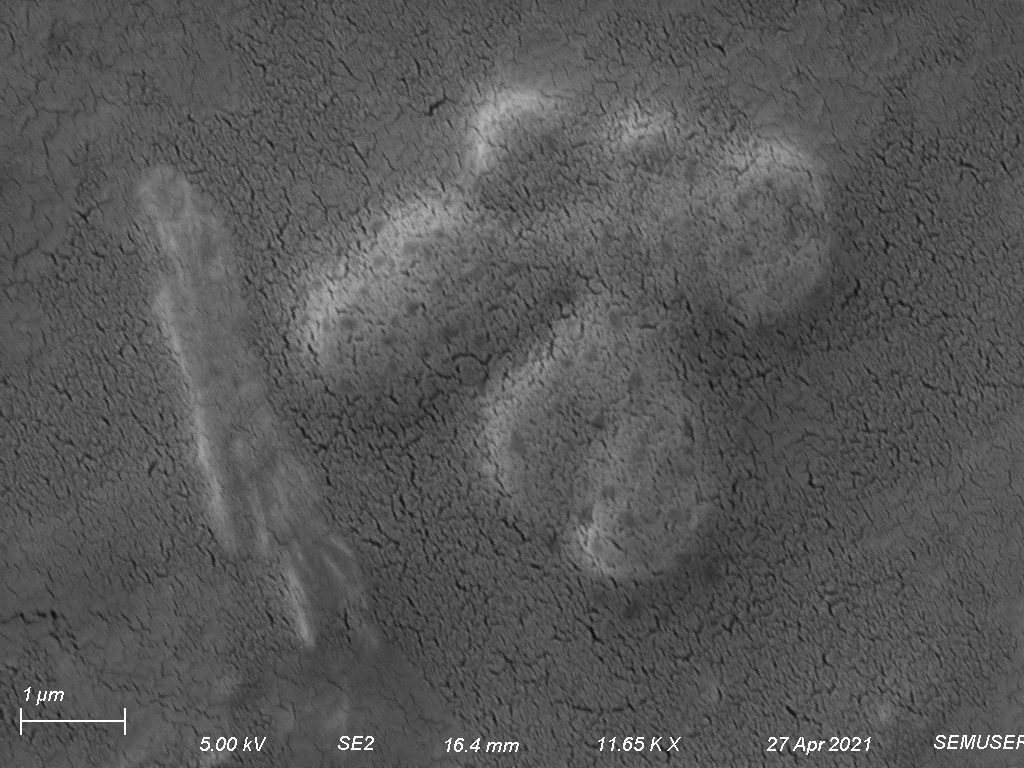
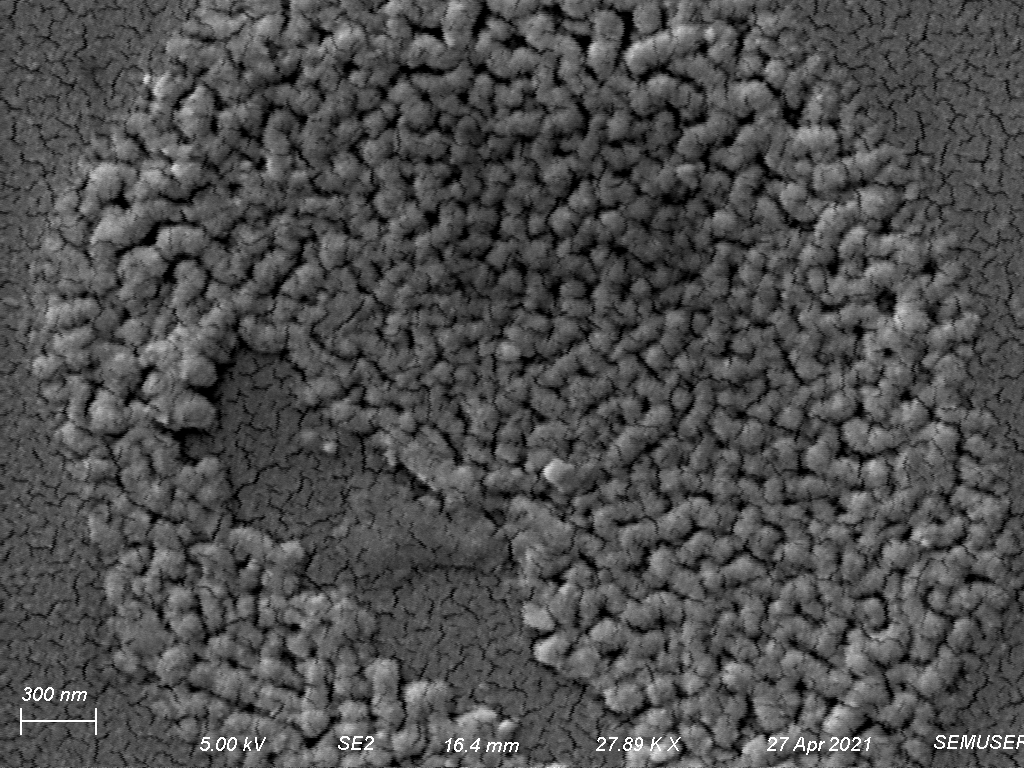
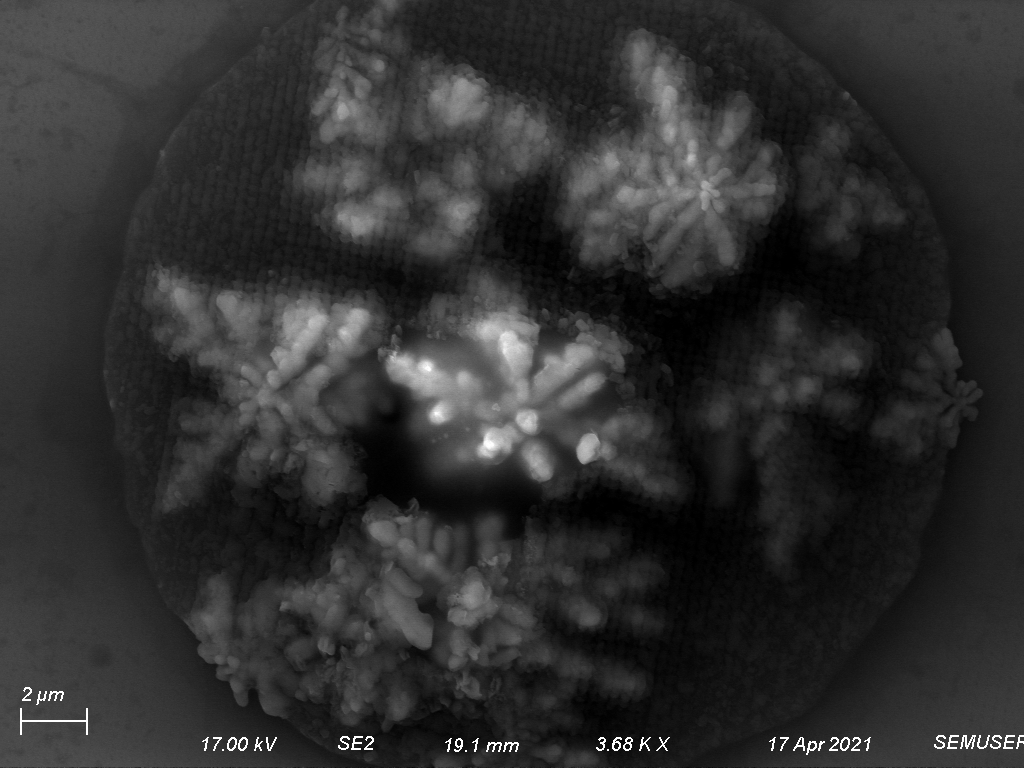
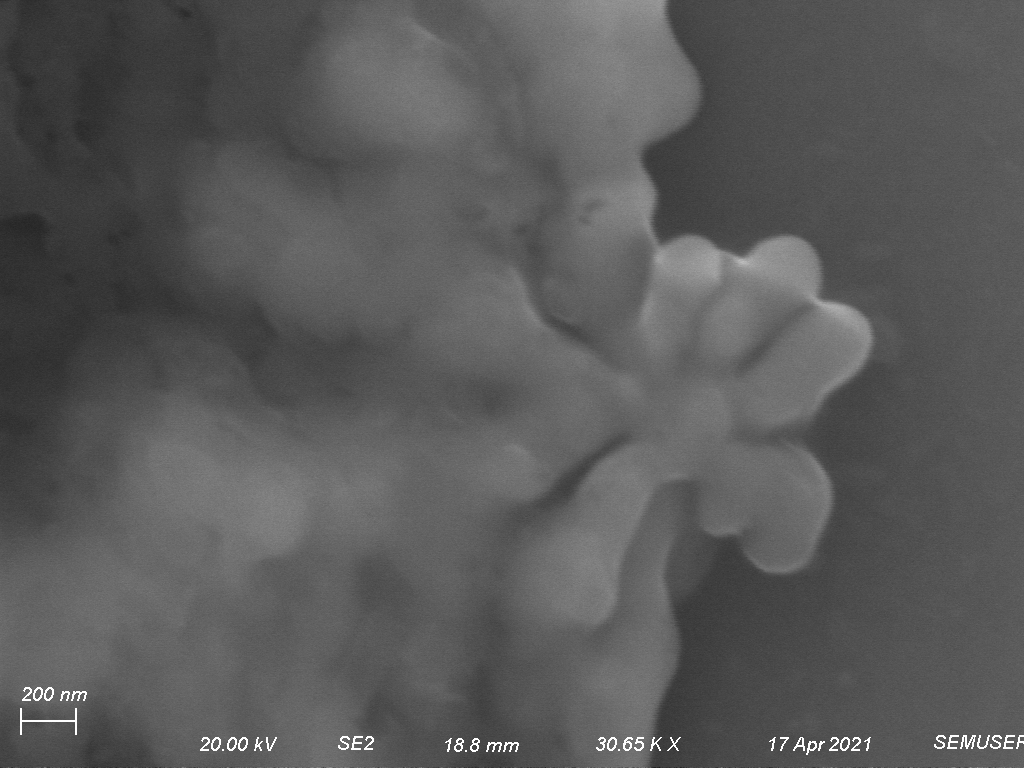
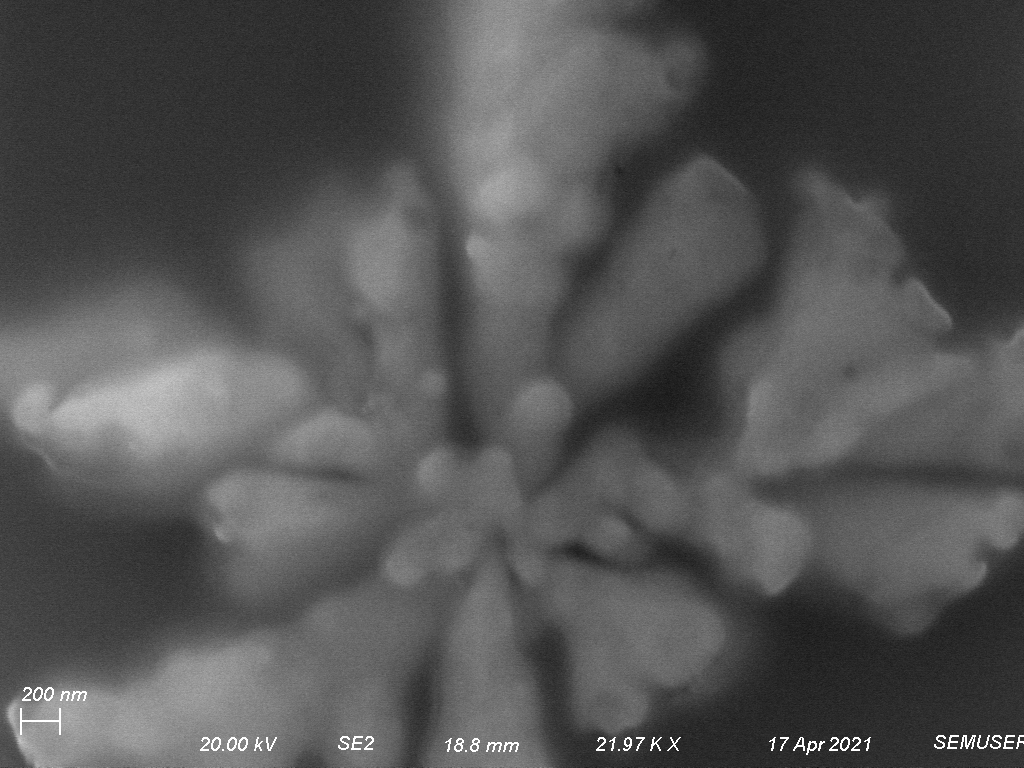
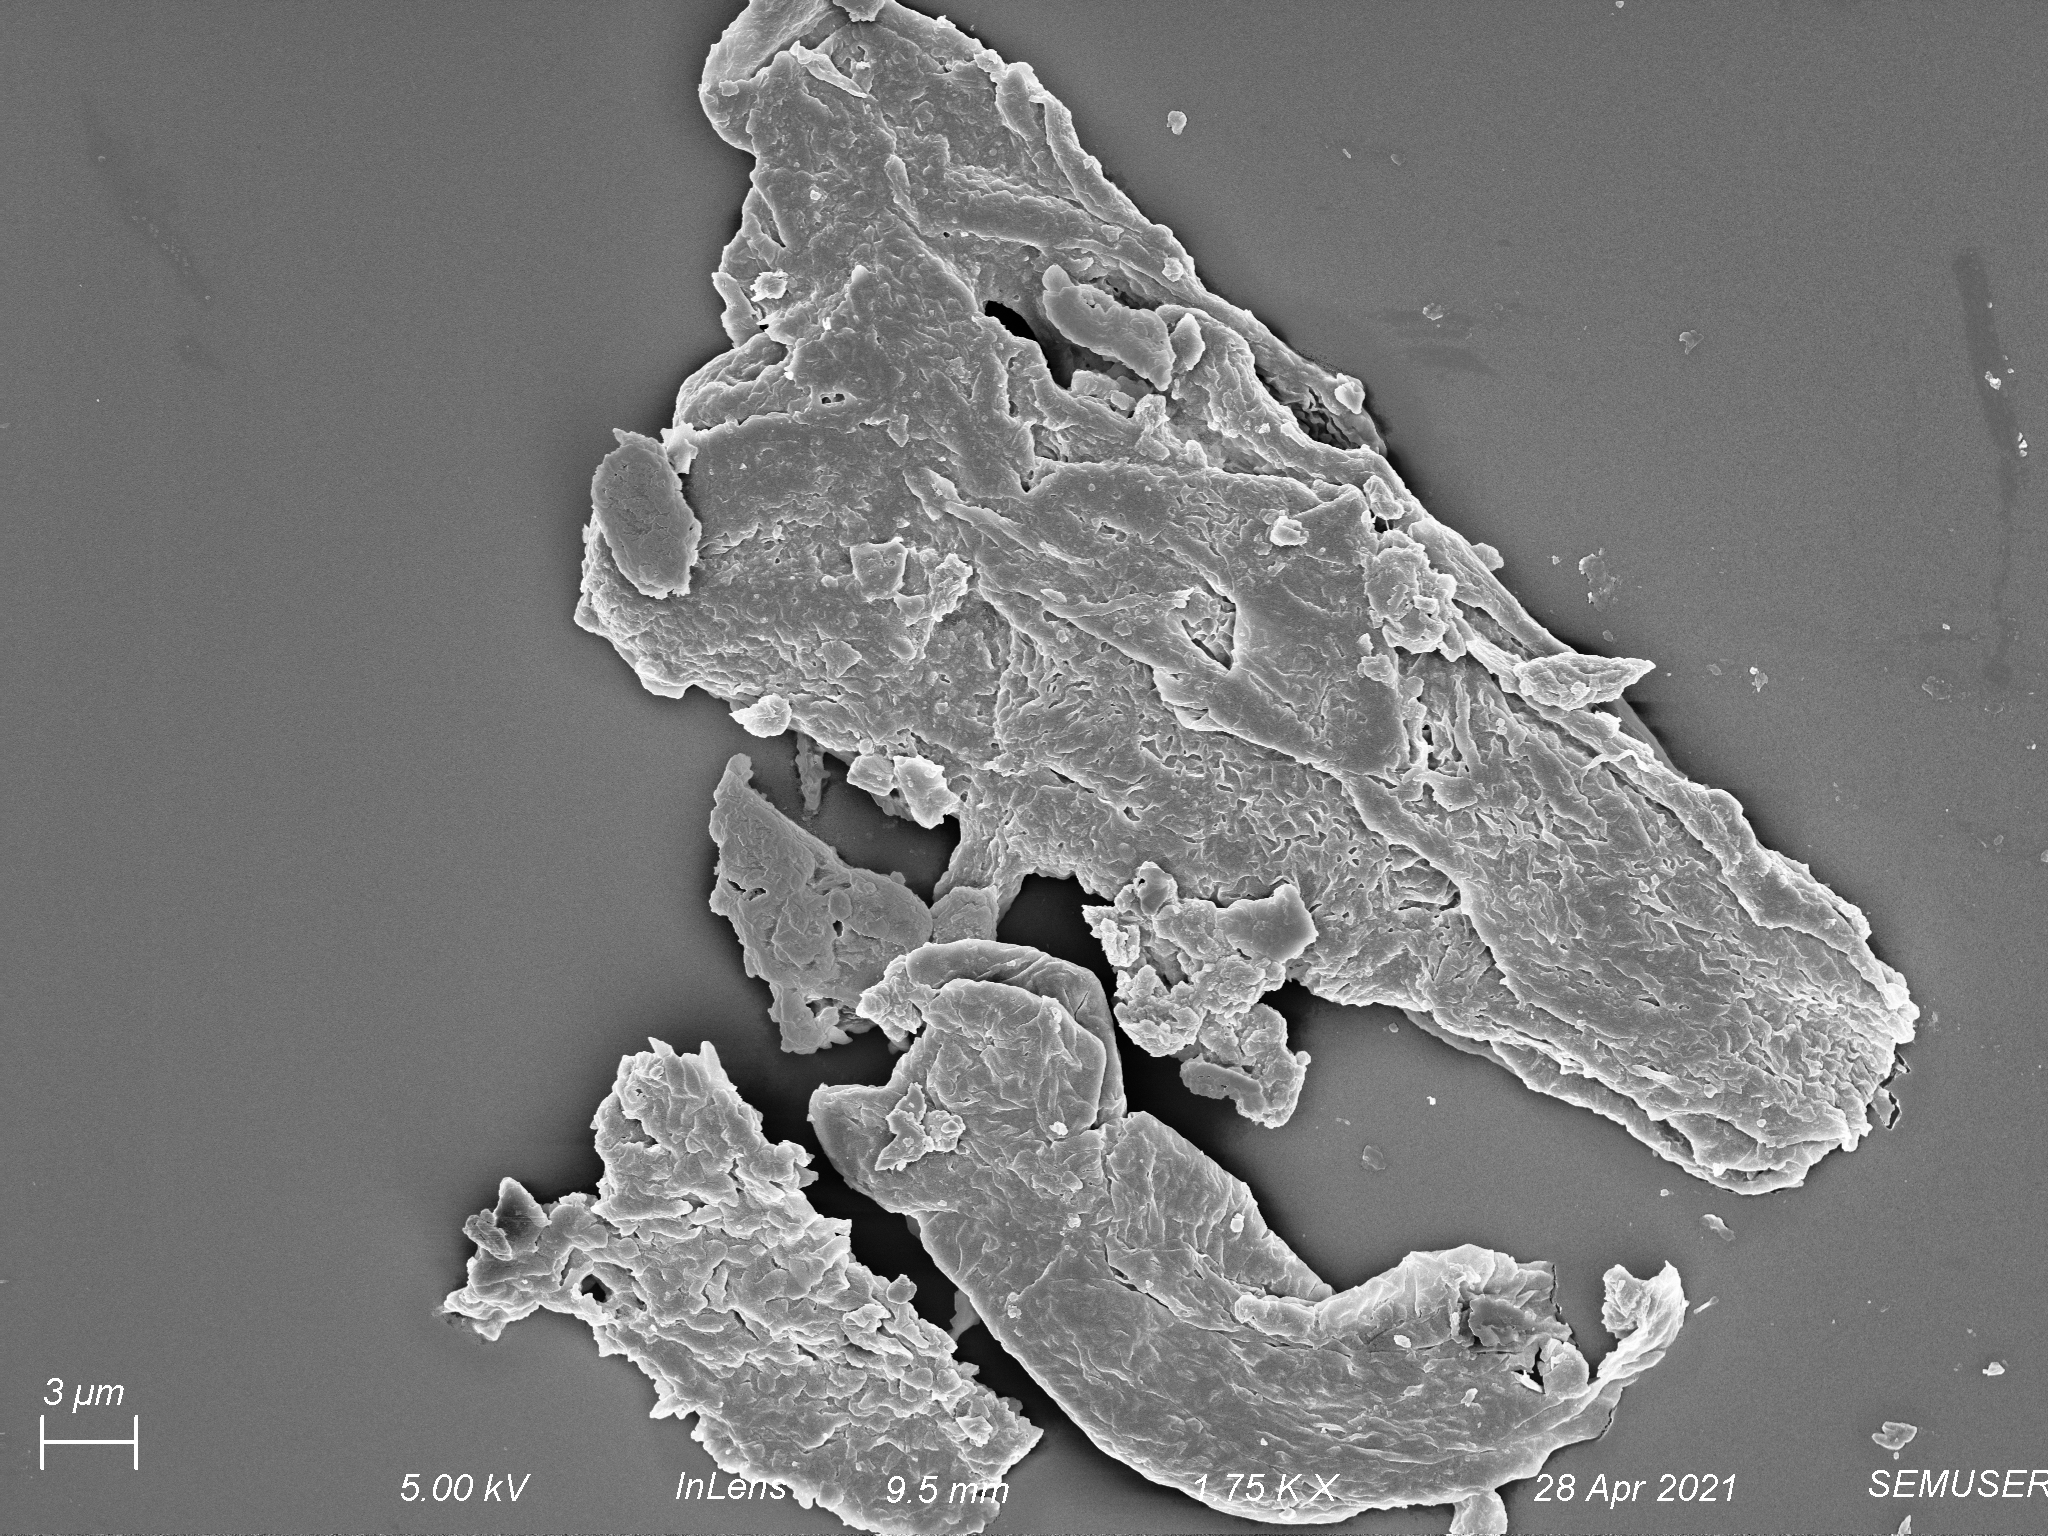
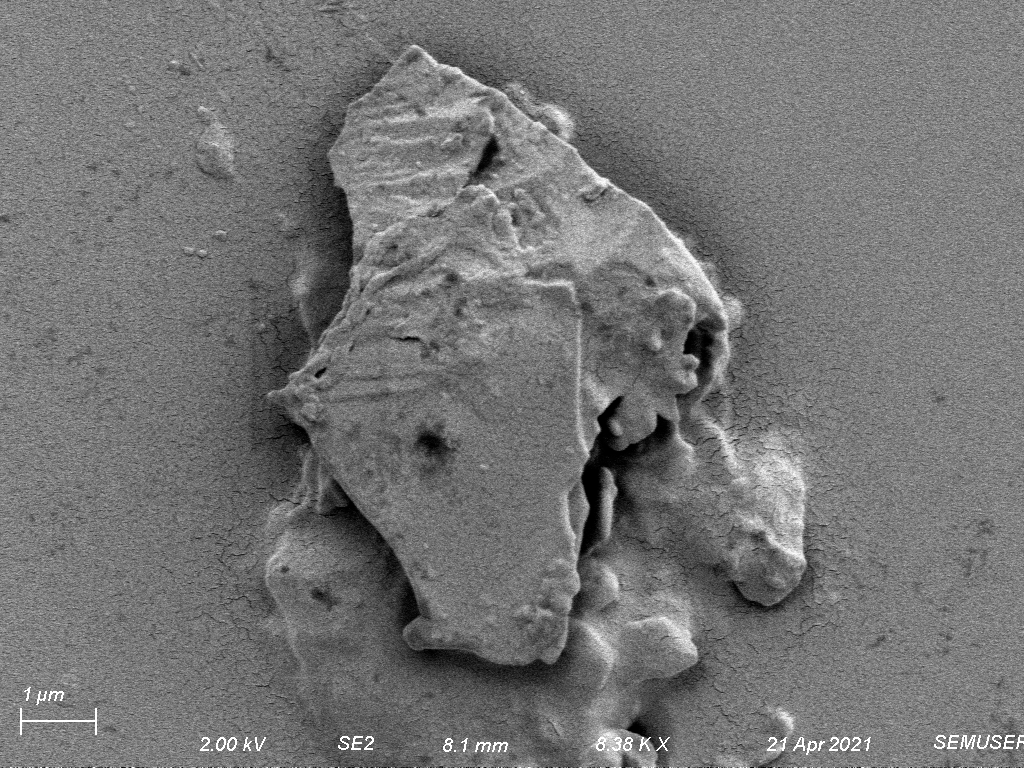
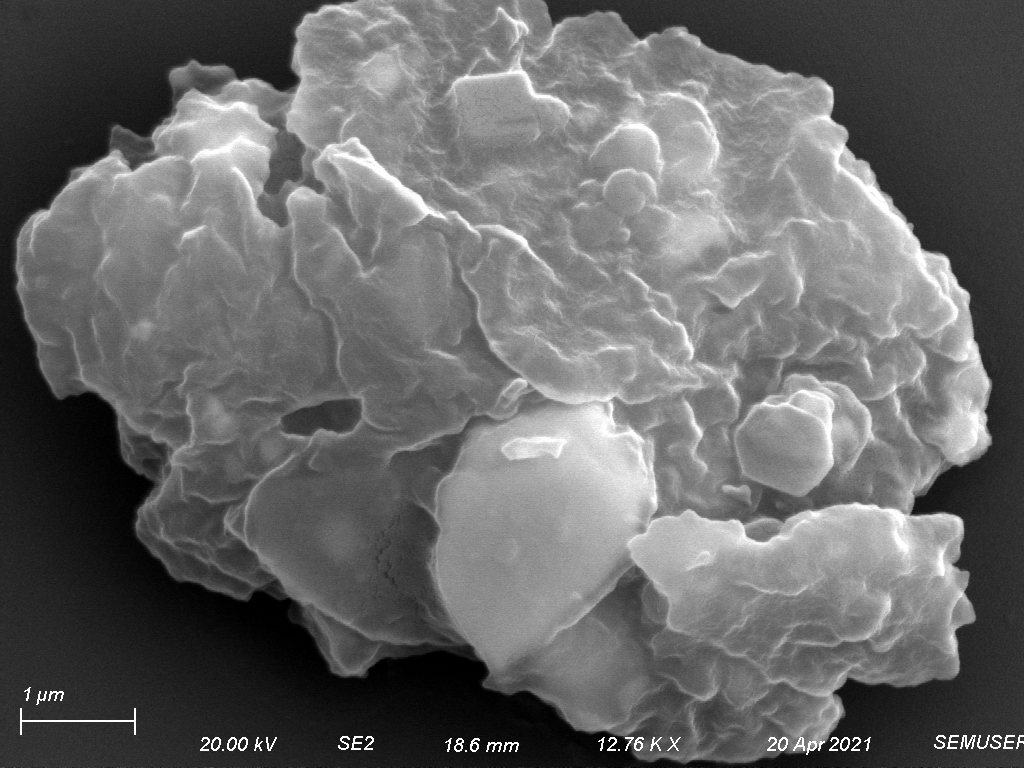
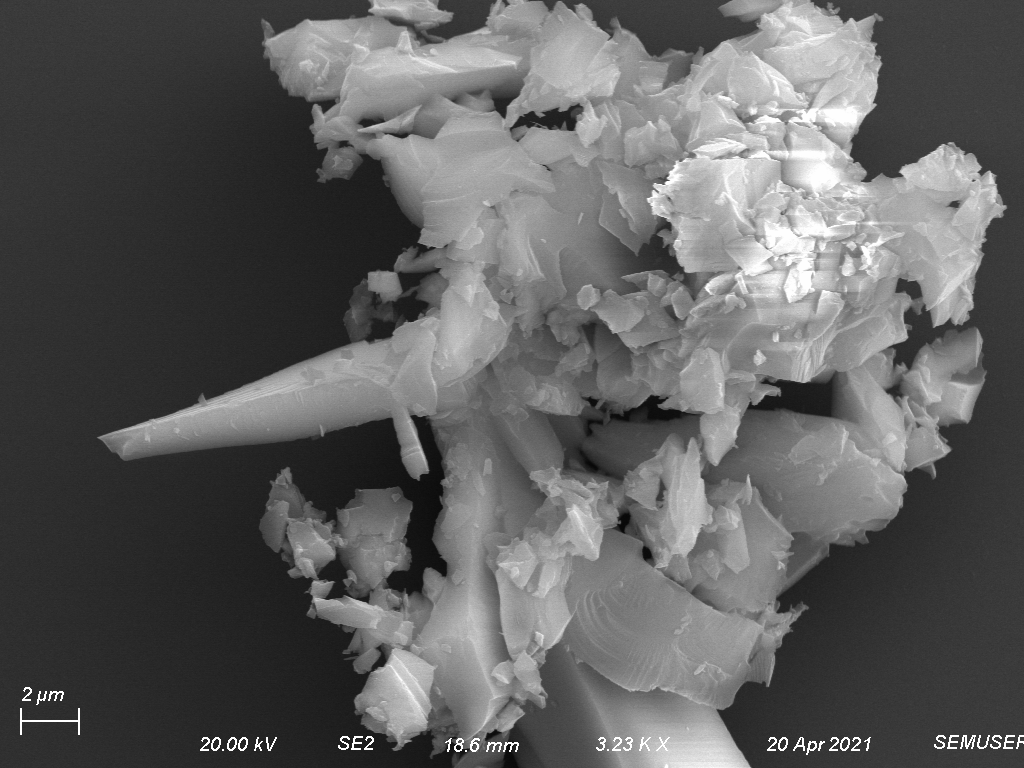
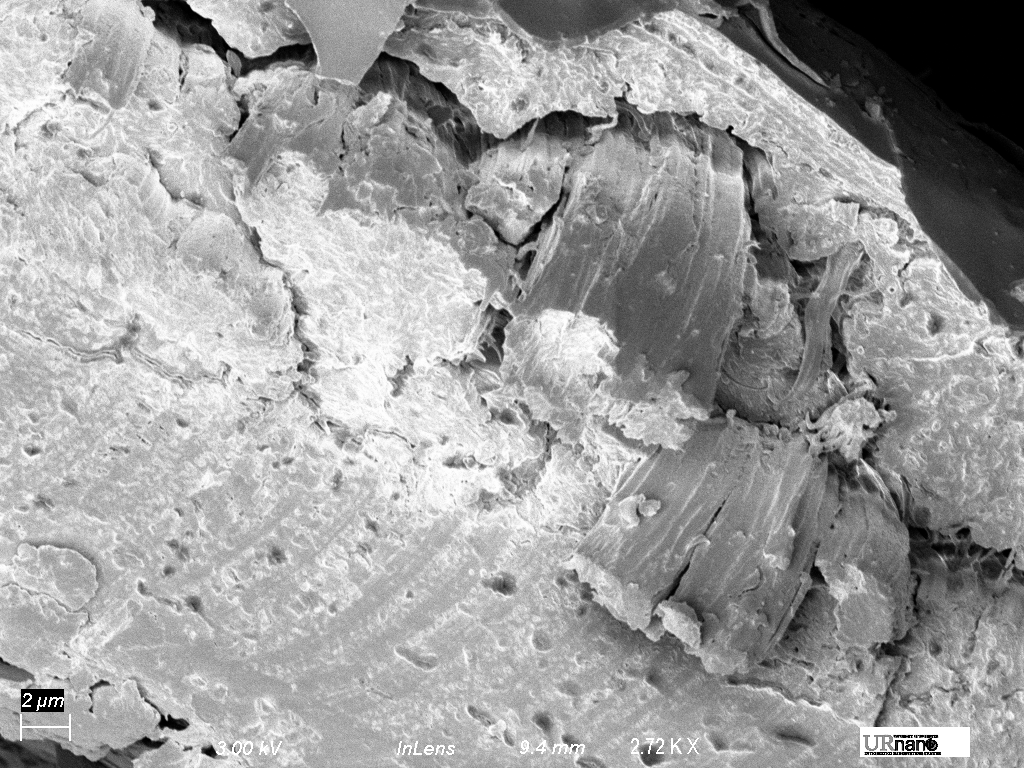
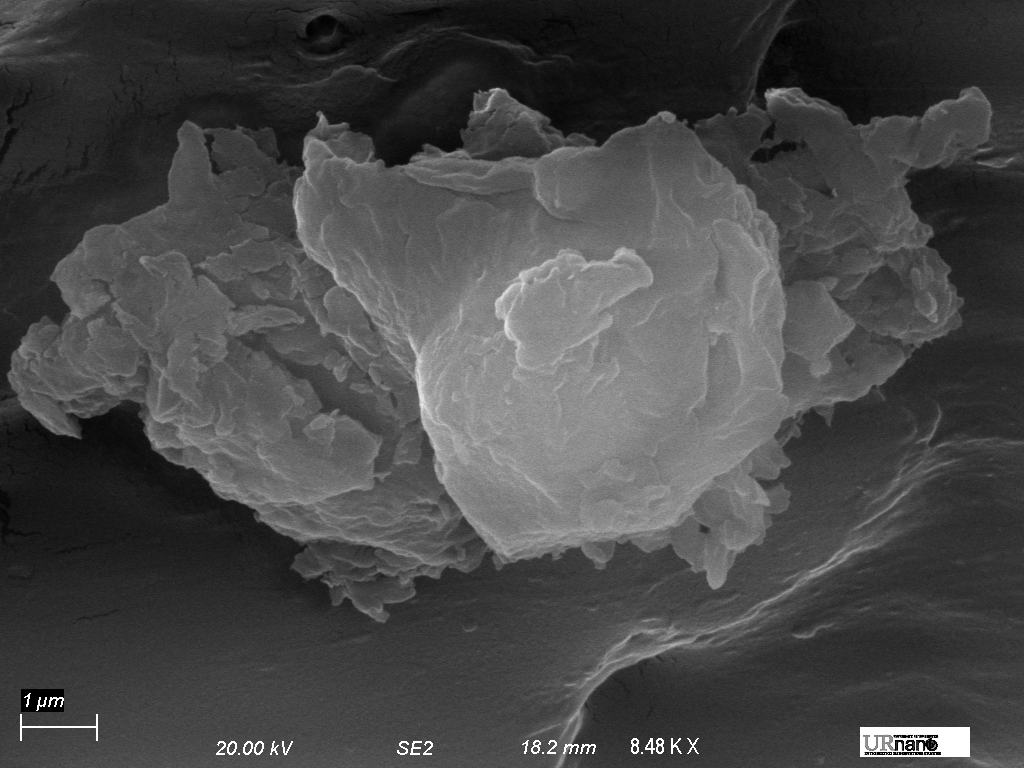
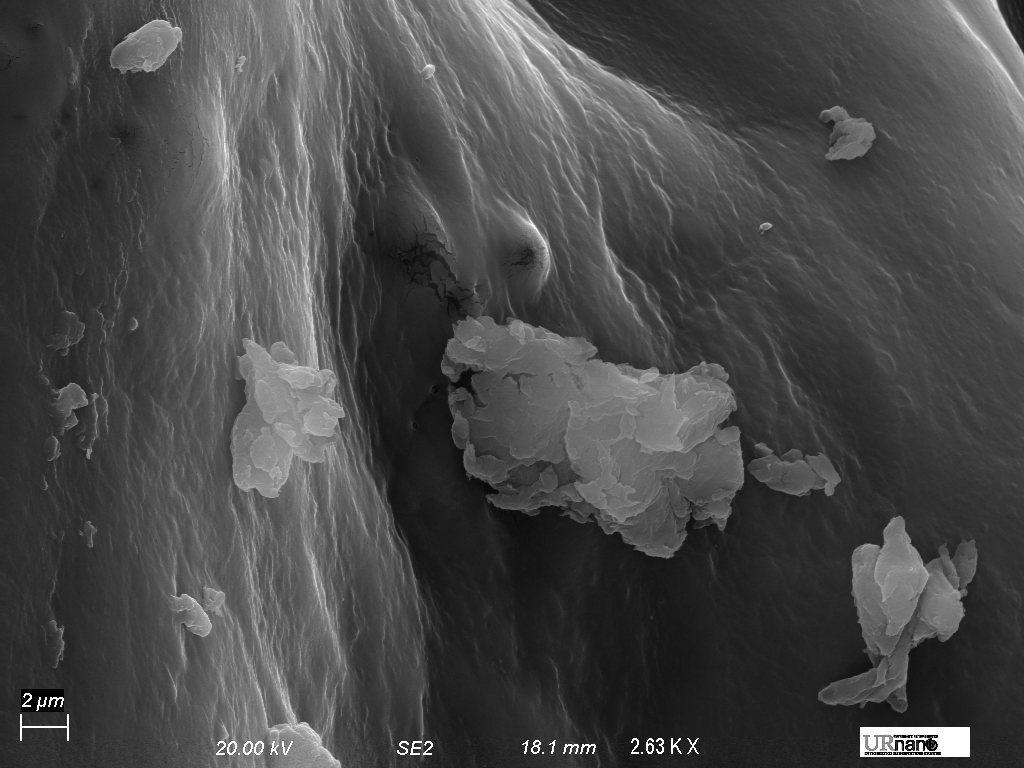
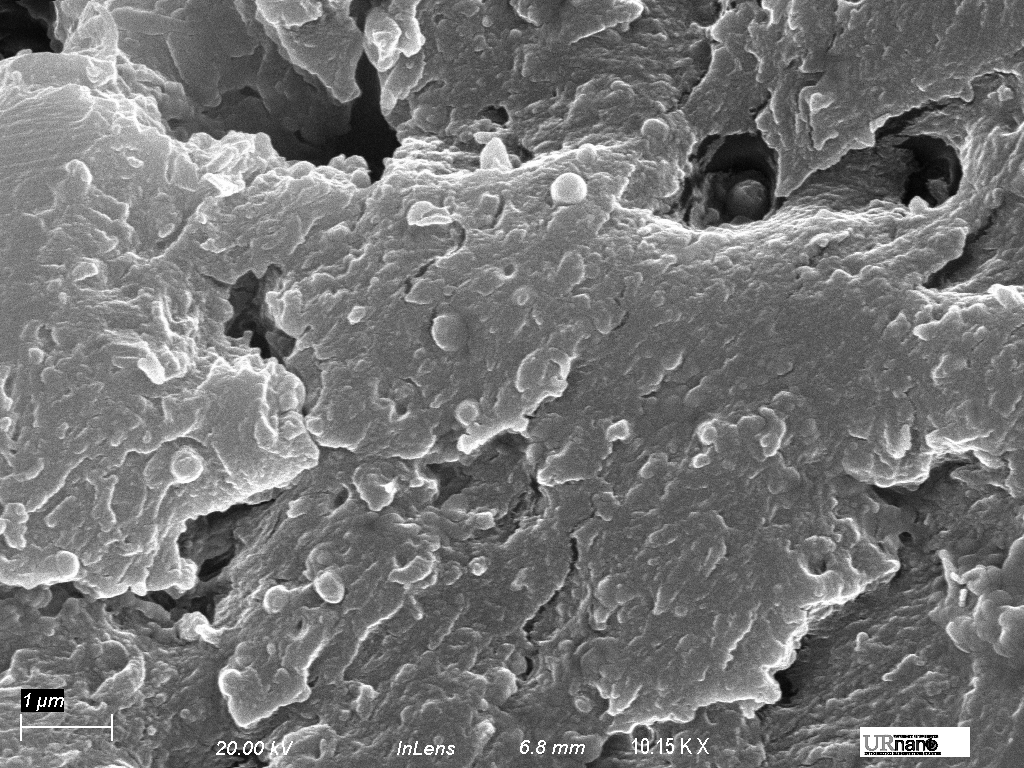
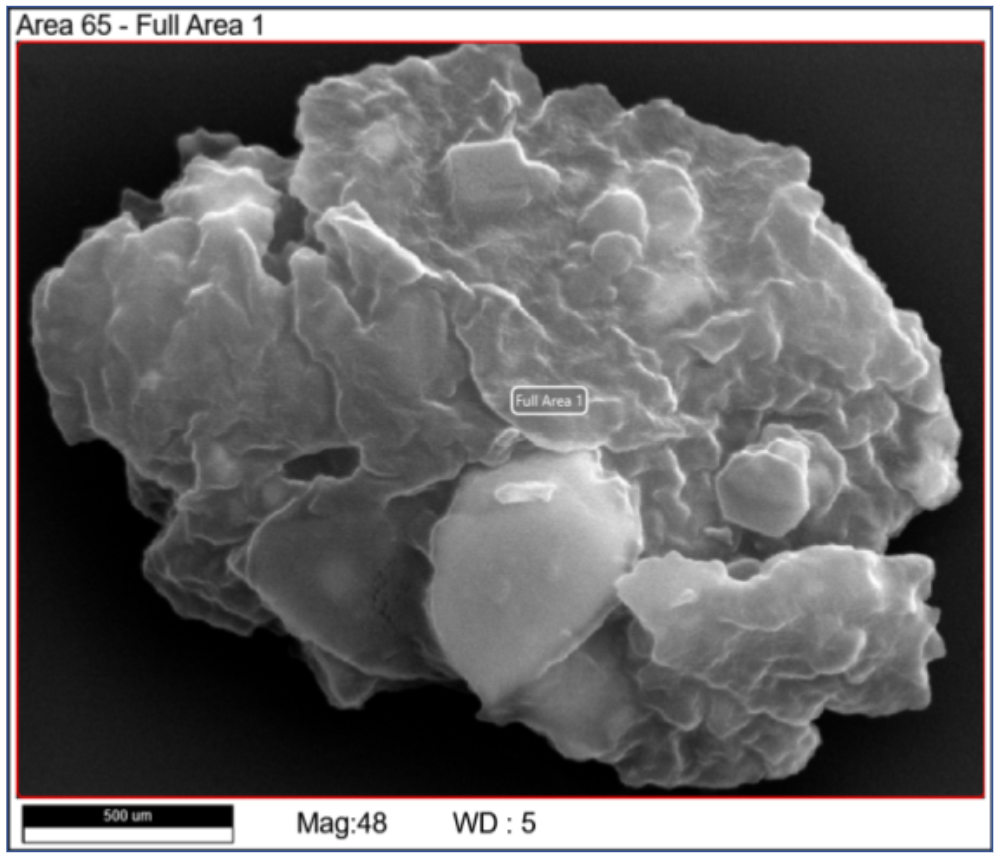
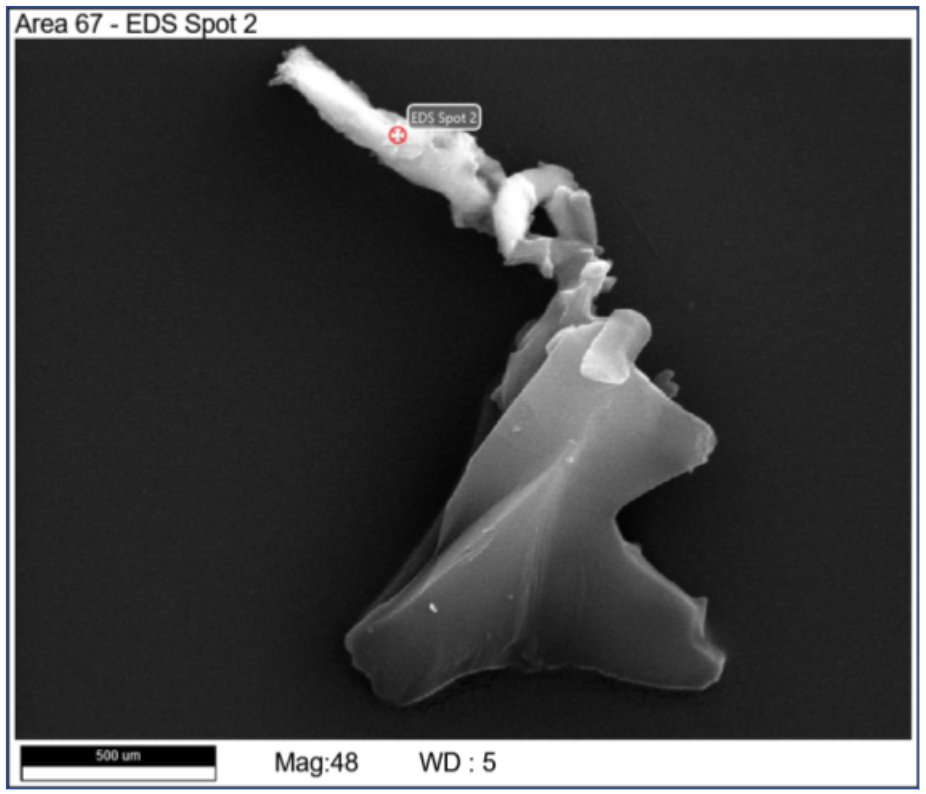
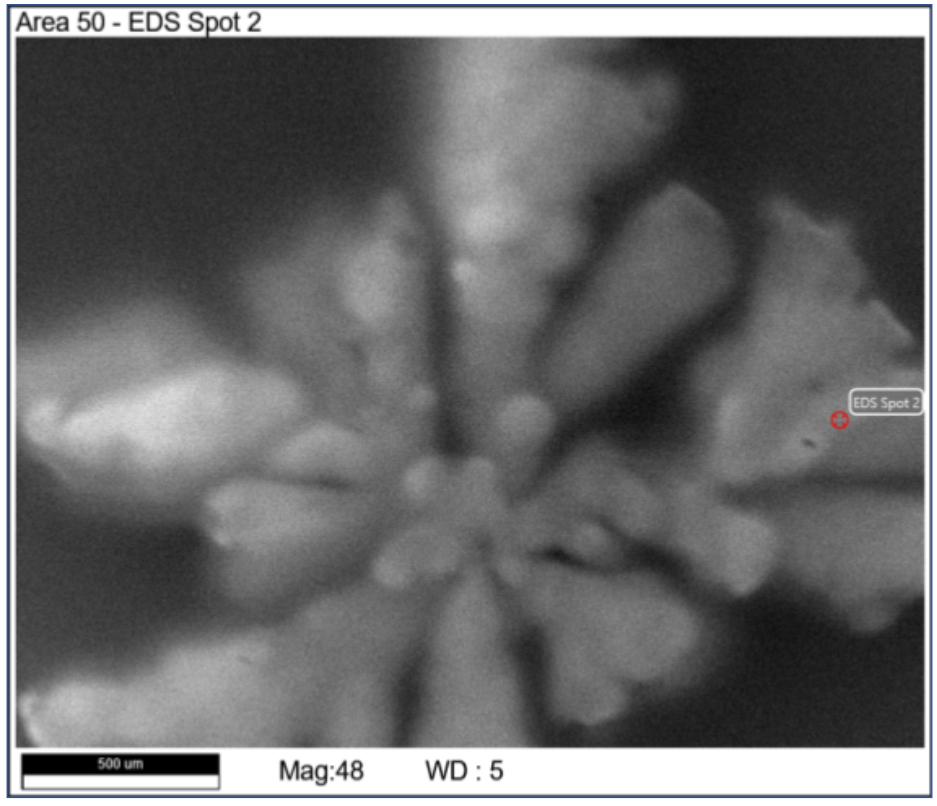
2. Fingerprints Visualization
|
|
|
|
|
|
|
|
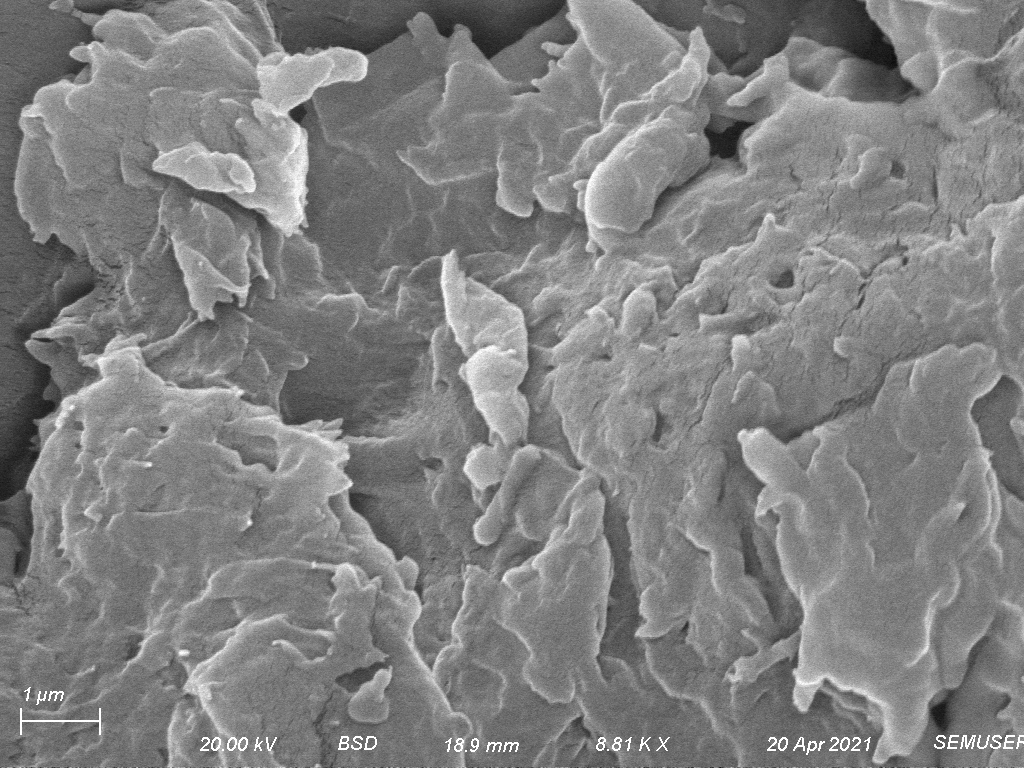
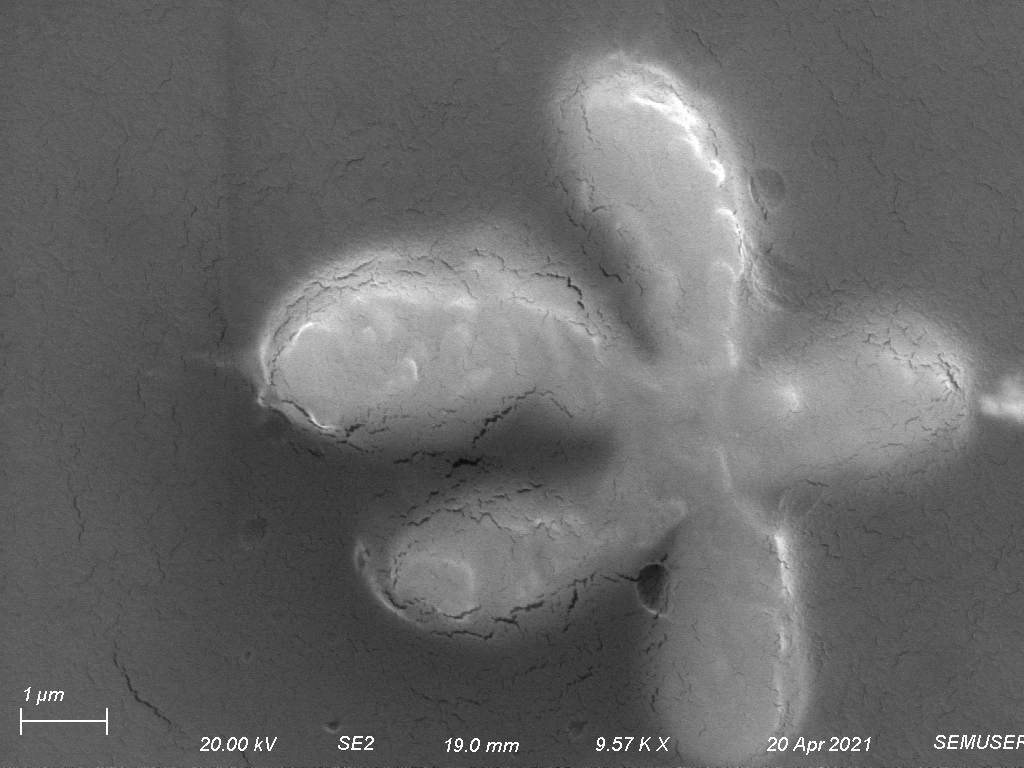
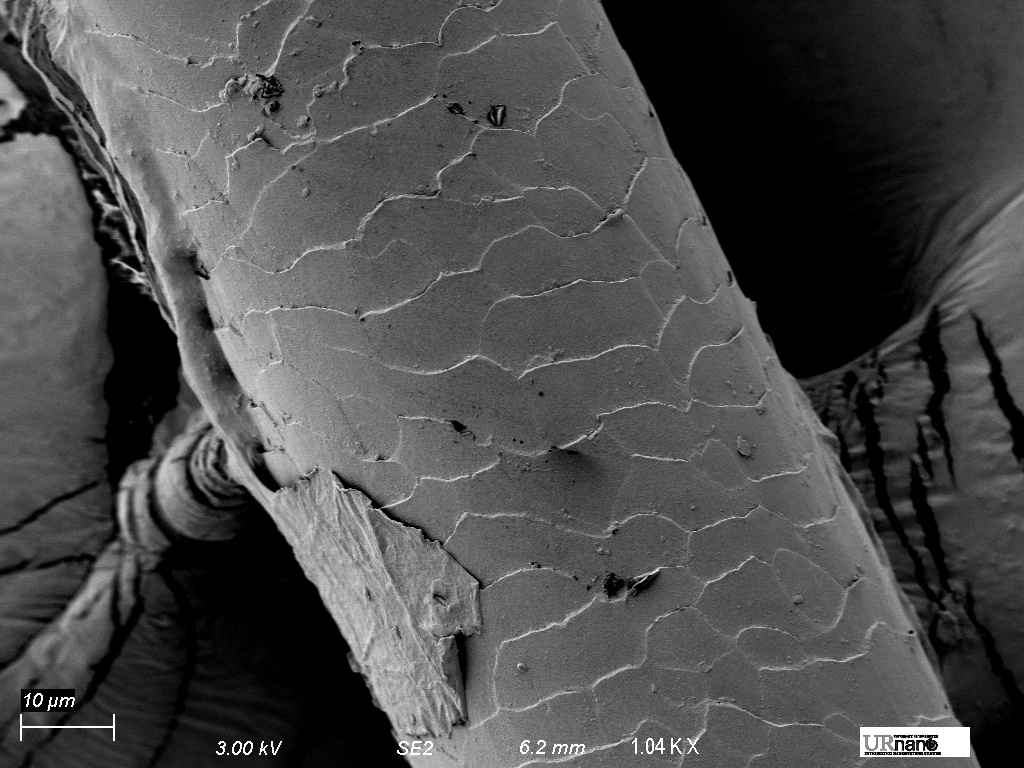
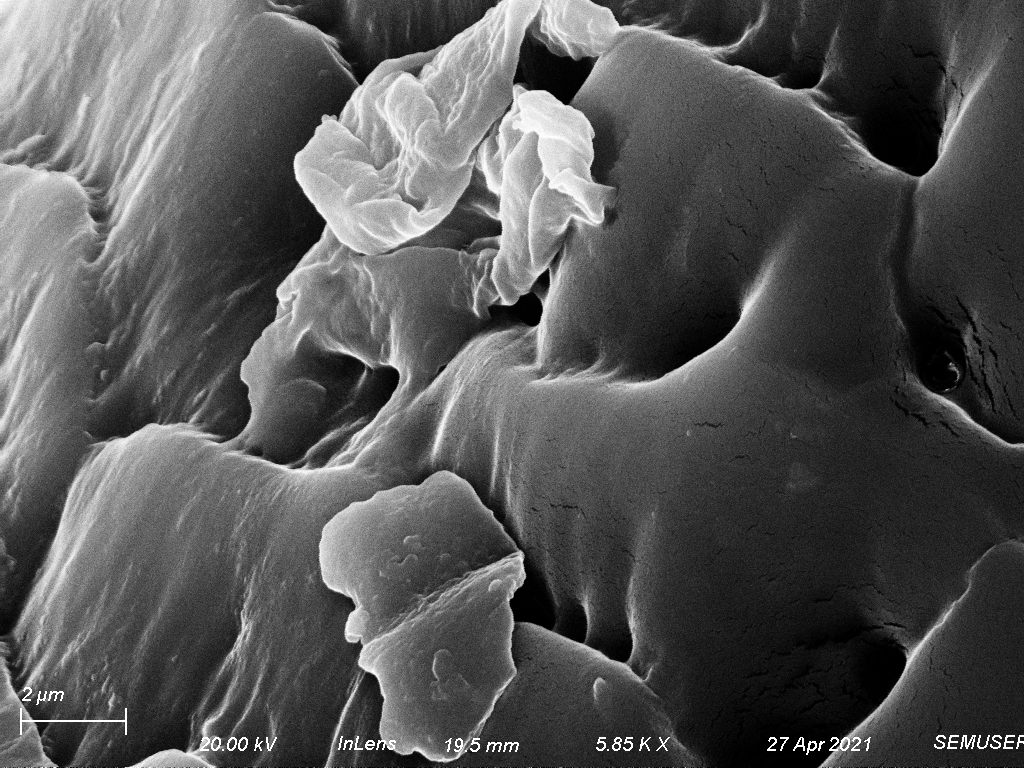
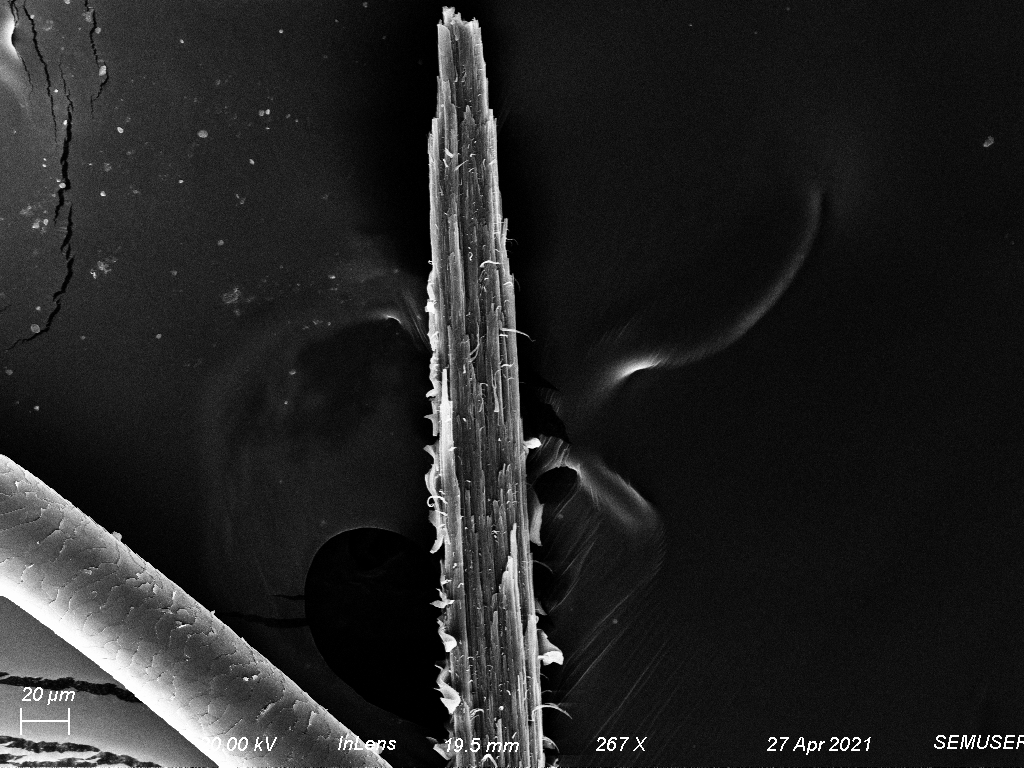
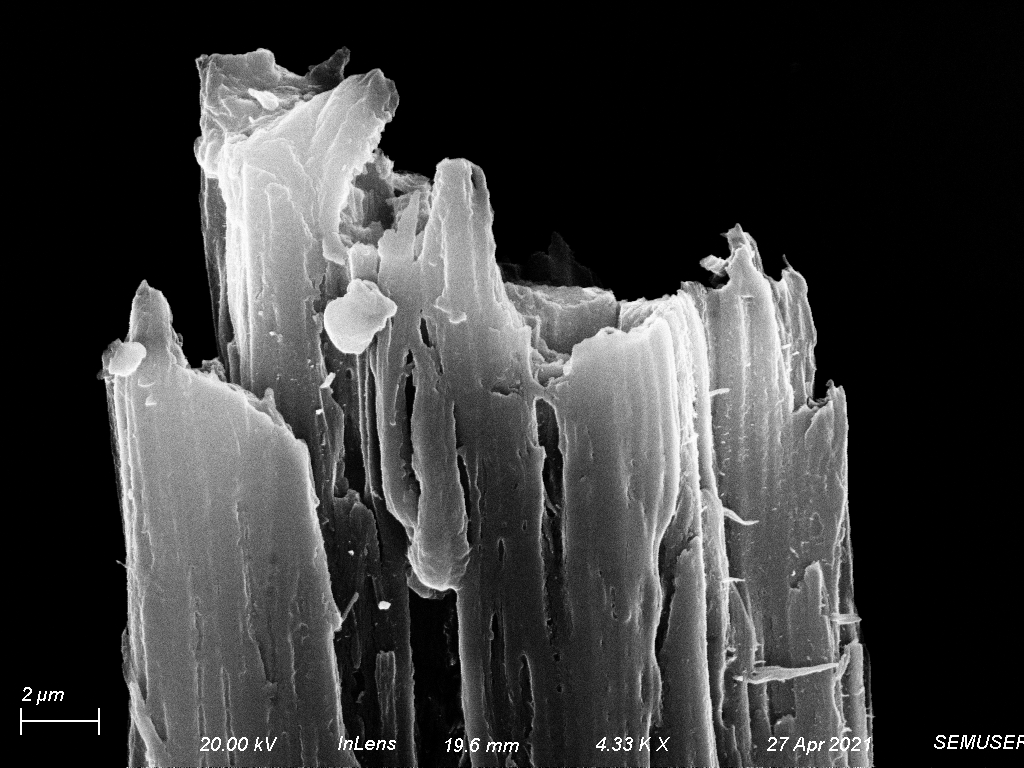
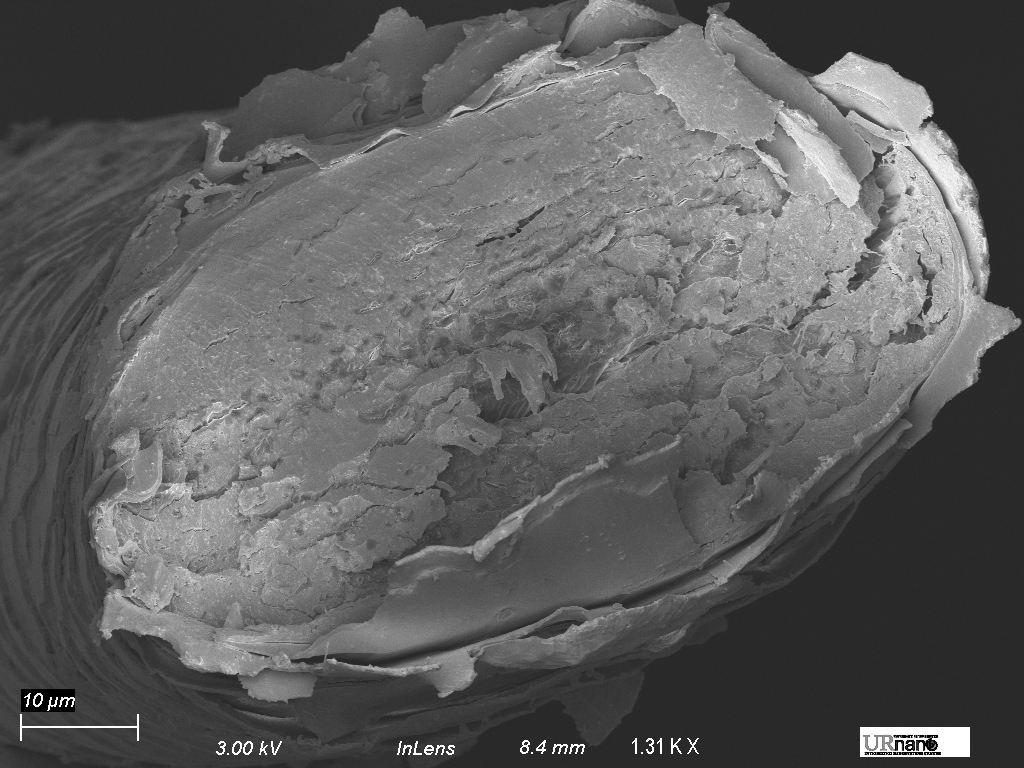
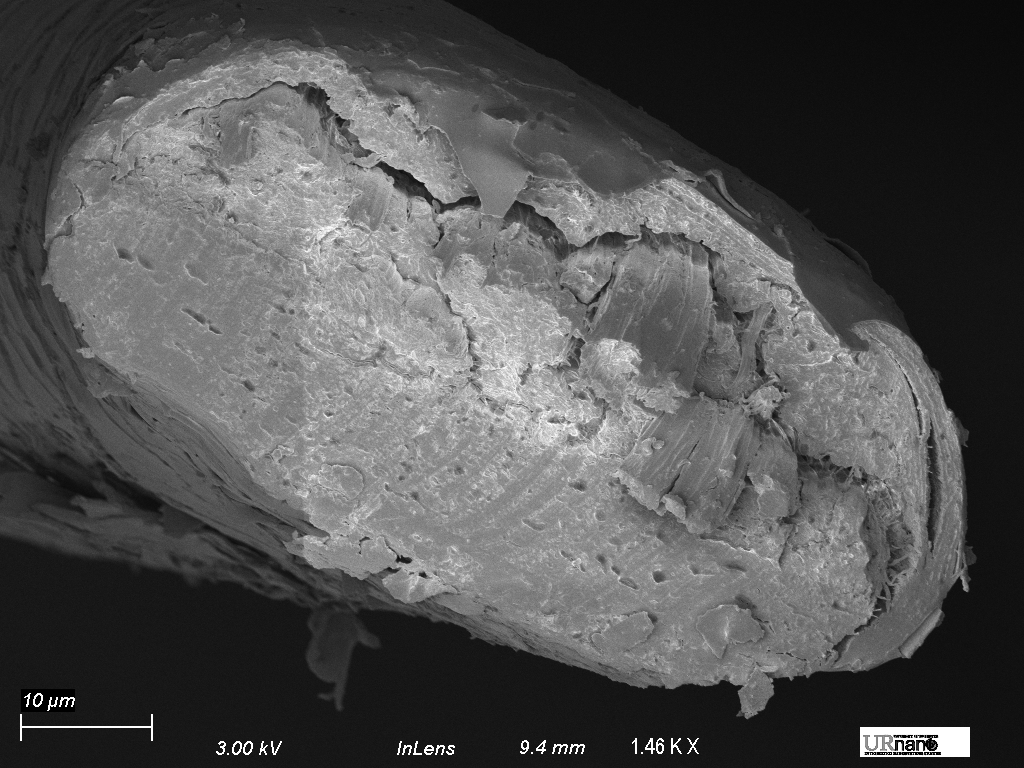
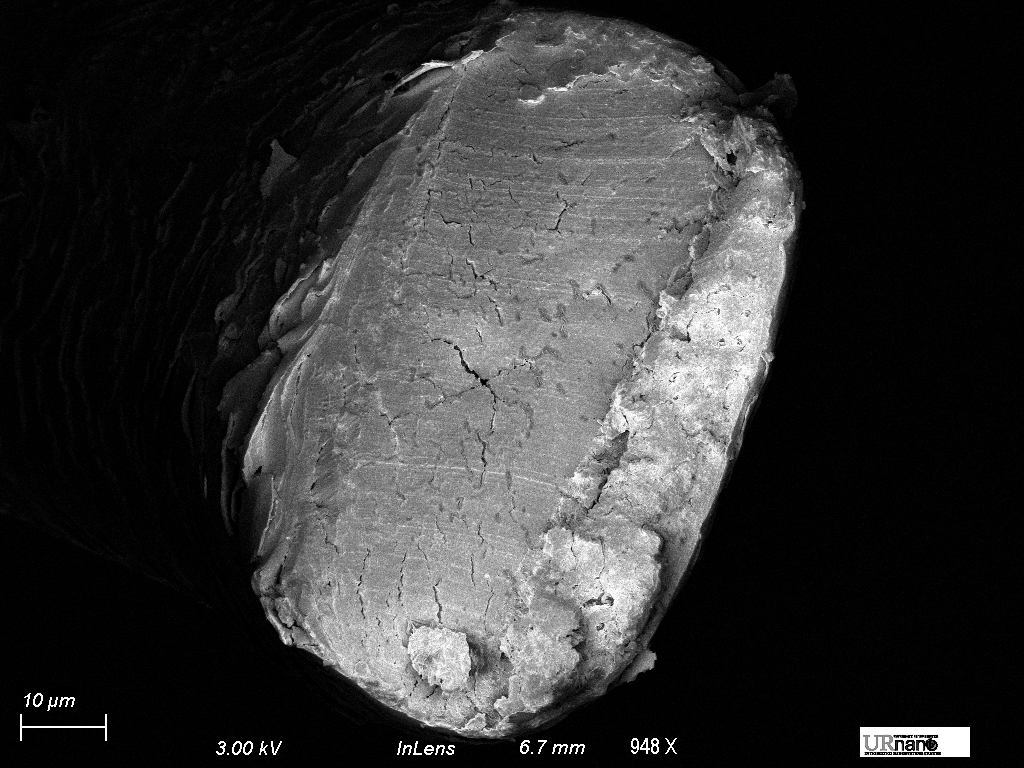
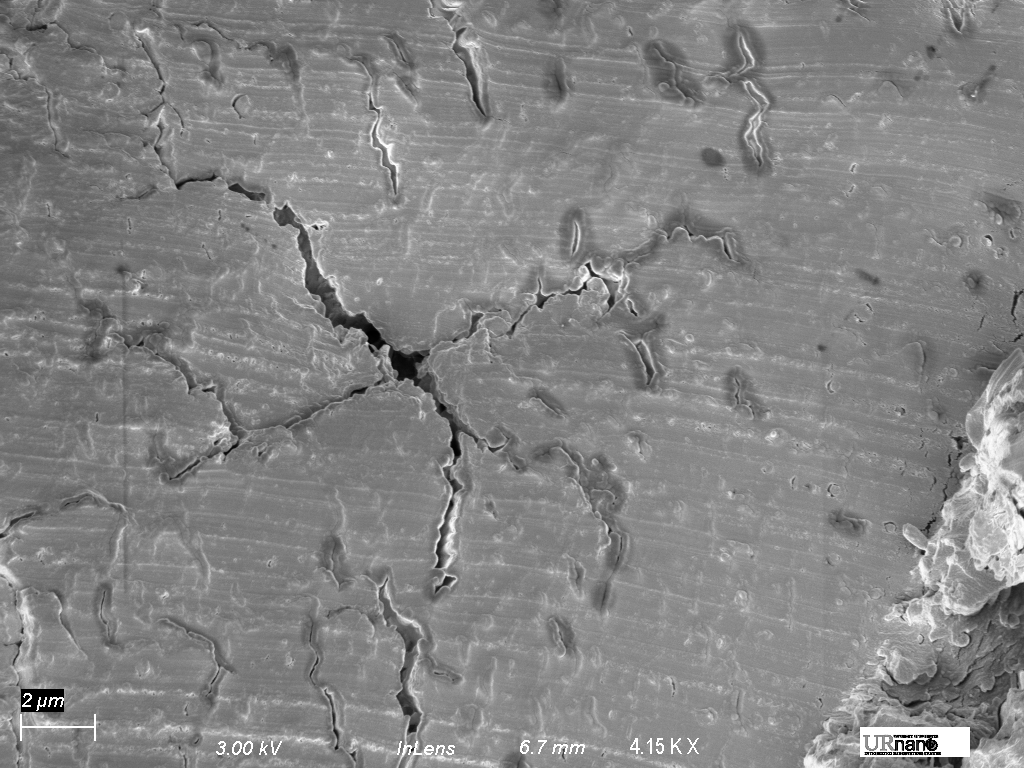
3. Hair Samples Visualization

|
|
|
|
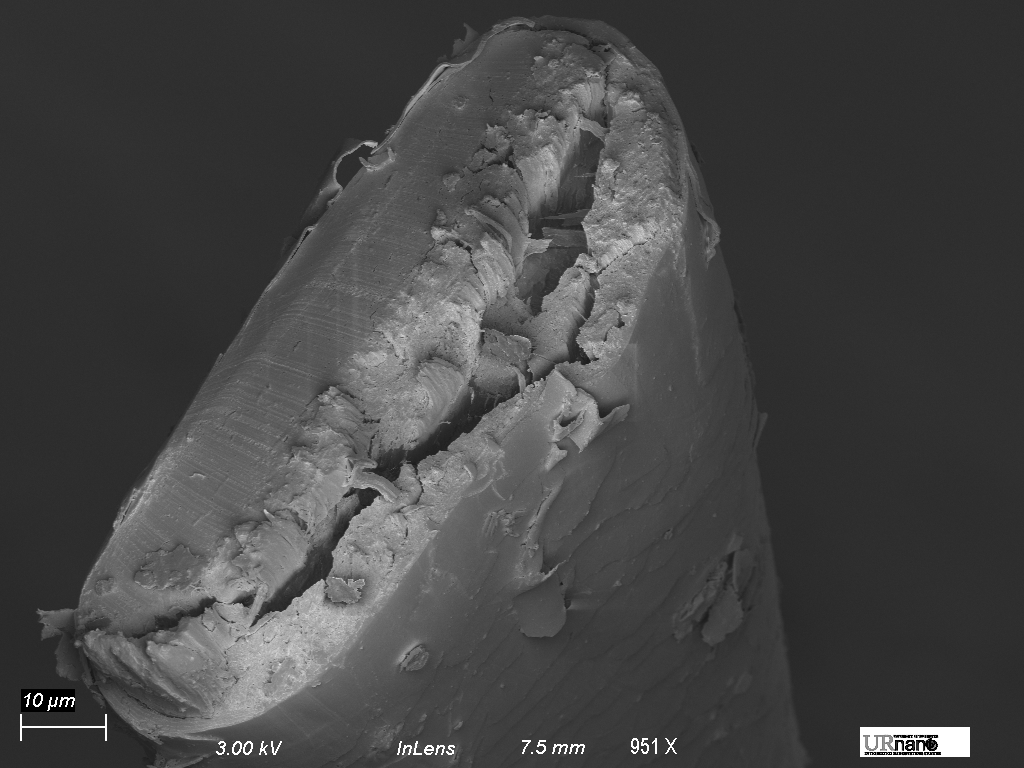
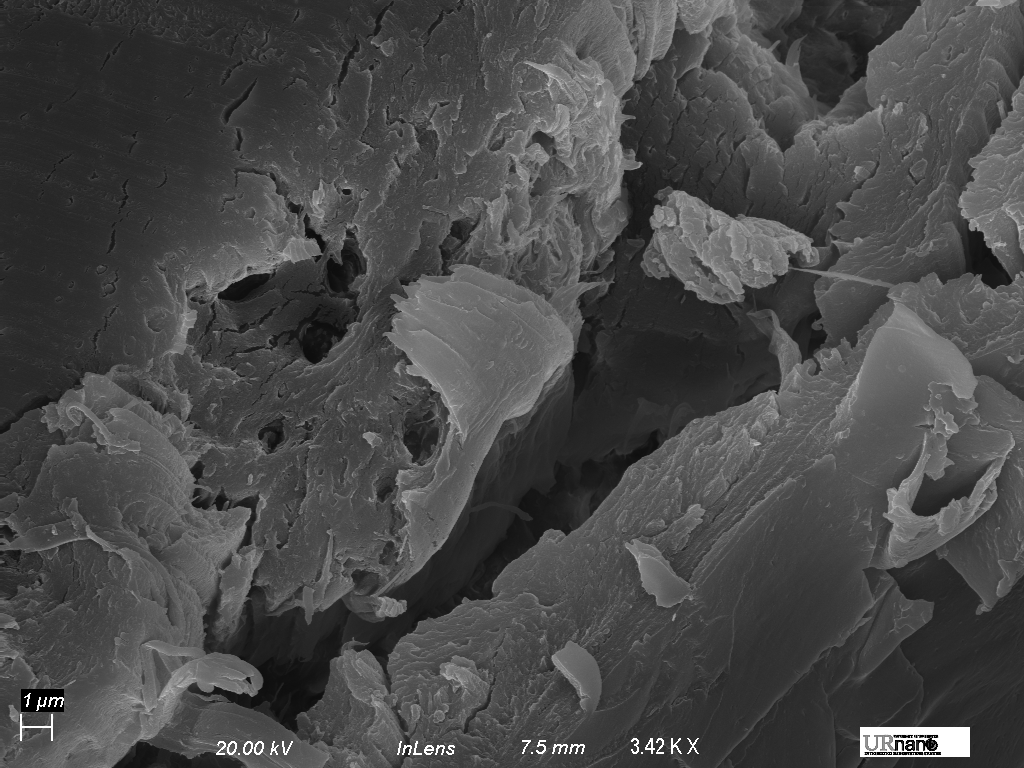
|
|
|
|
4. X-Ray Spectroscopy
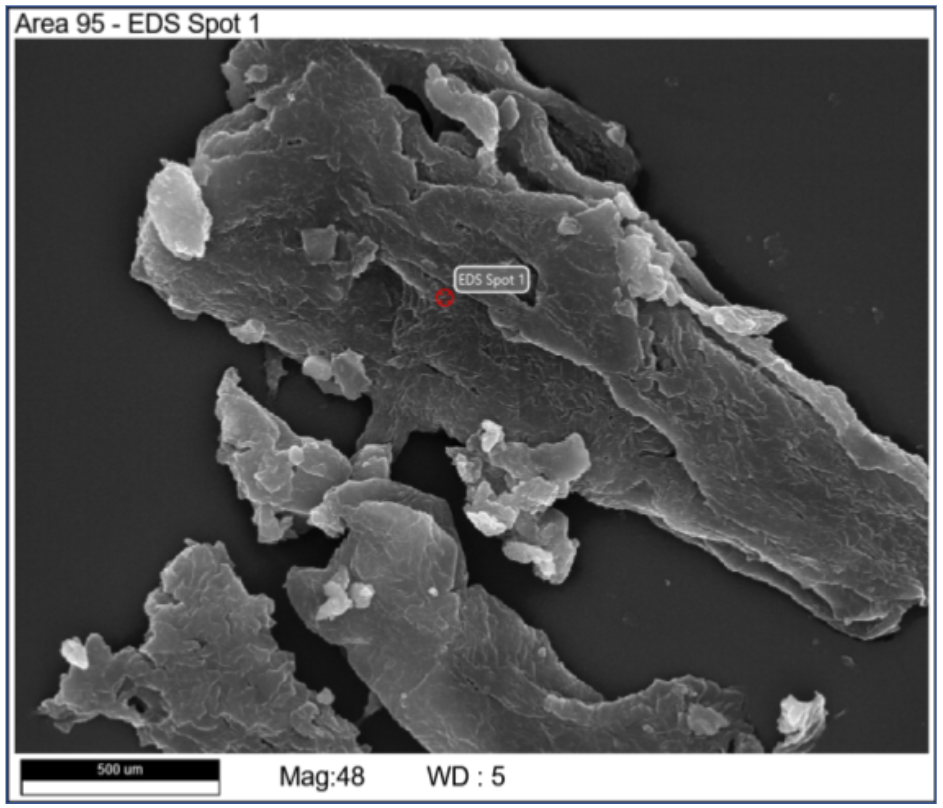
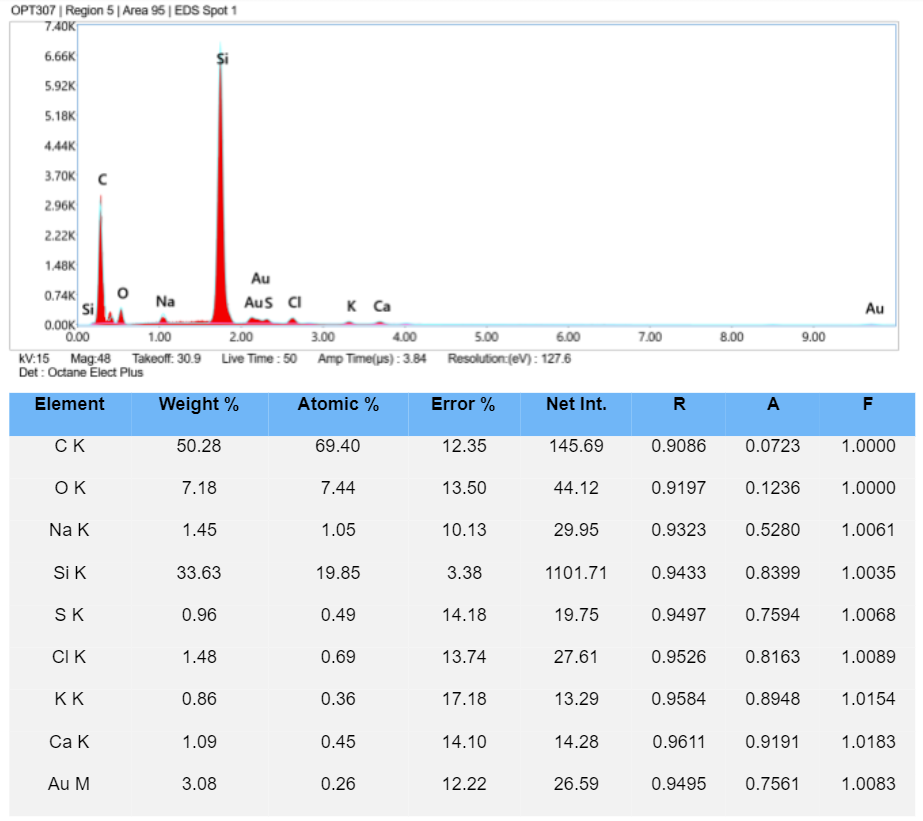
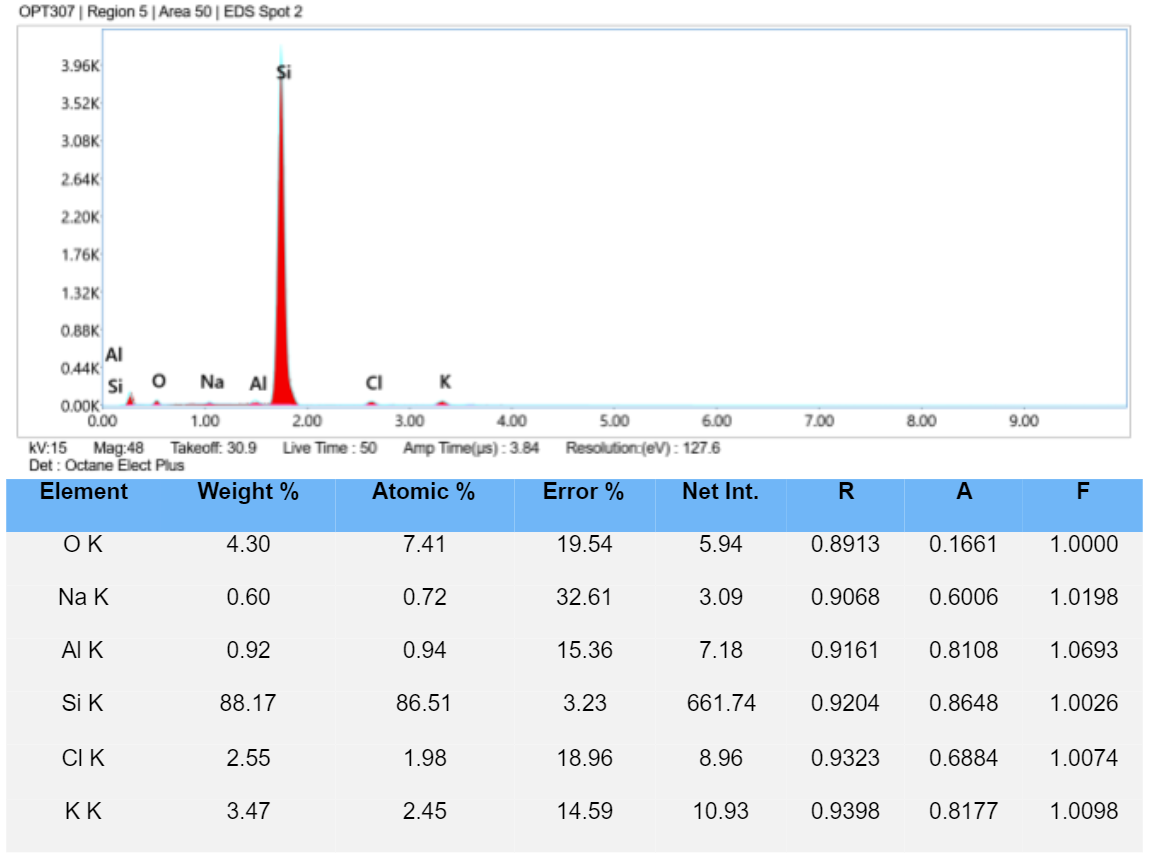
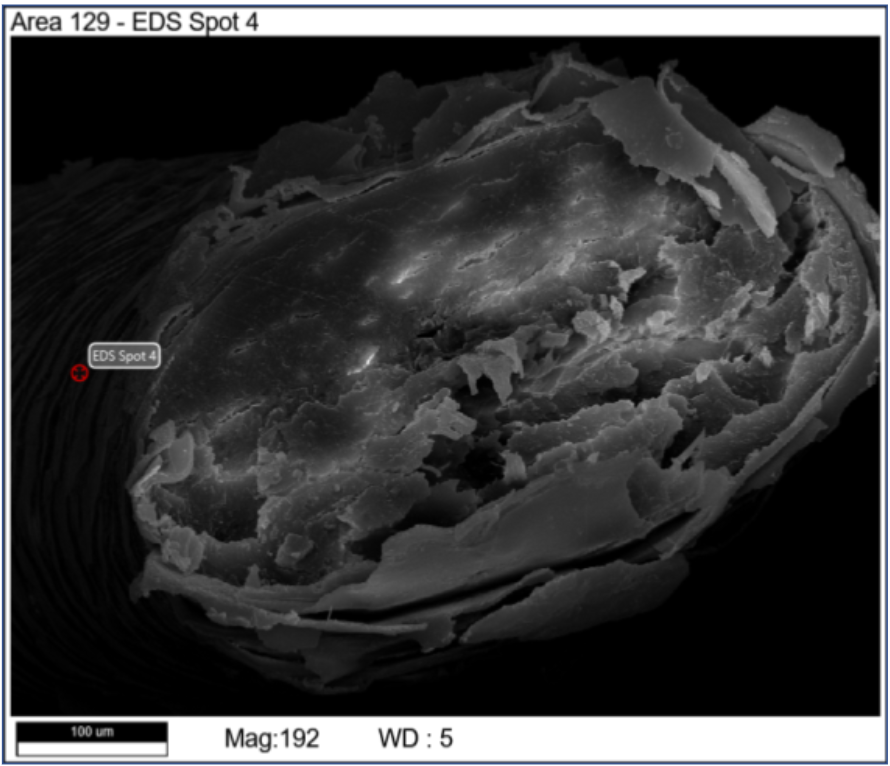
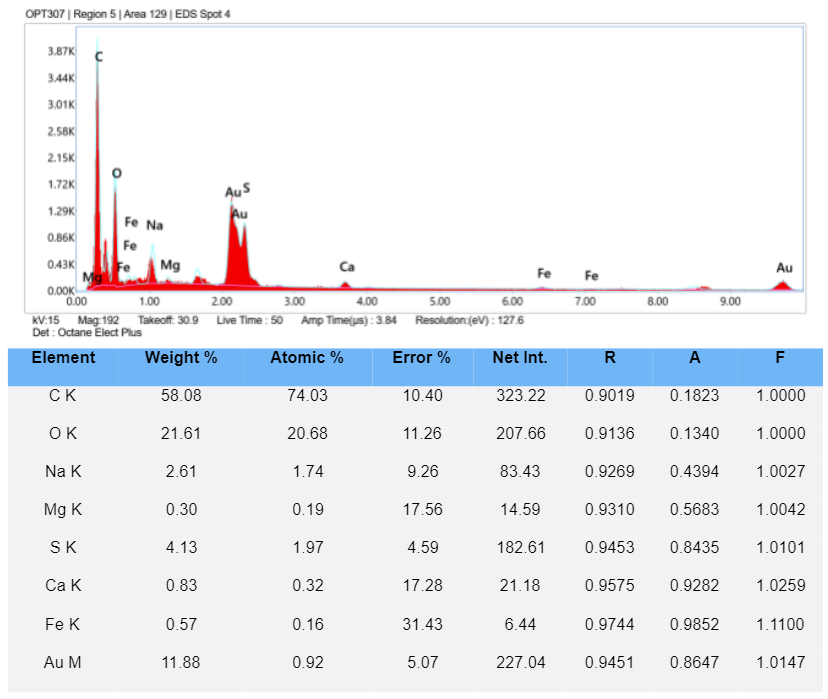
1. Fingerprint Samples EDS Analysis
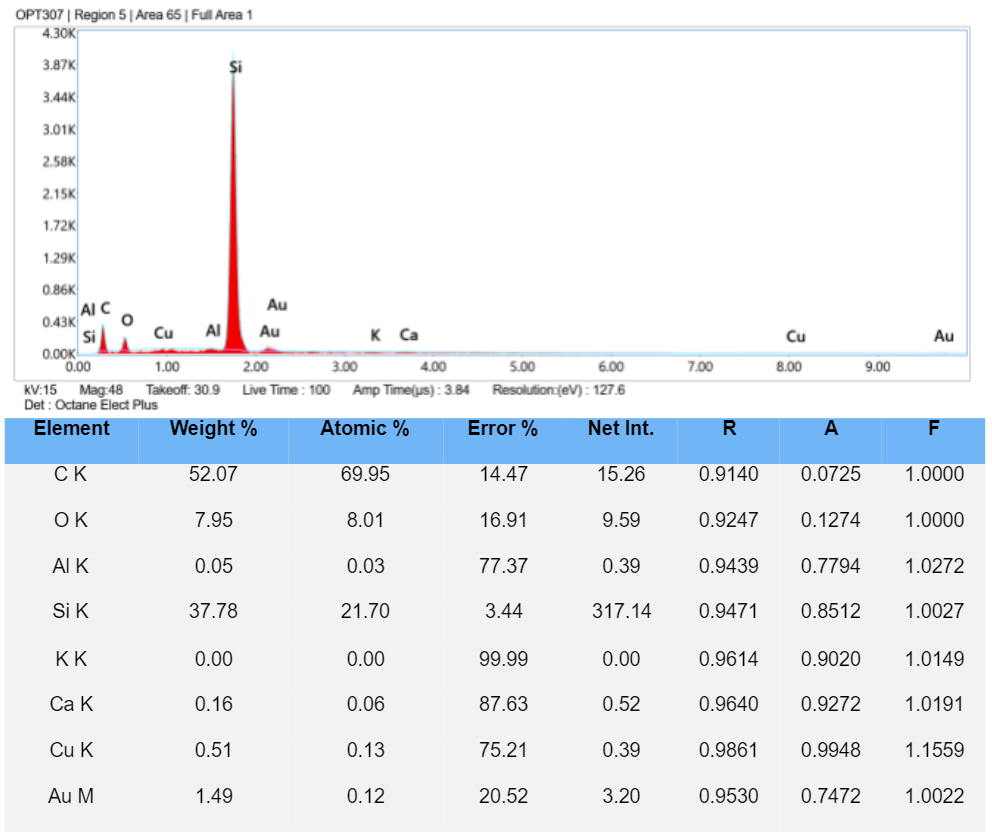
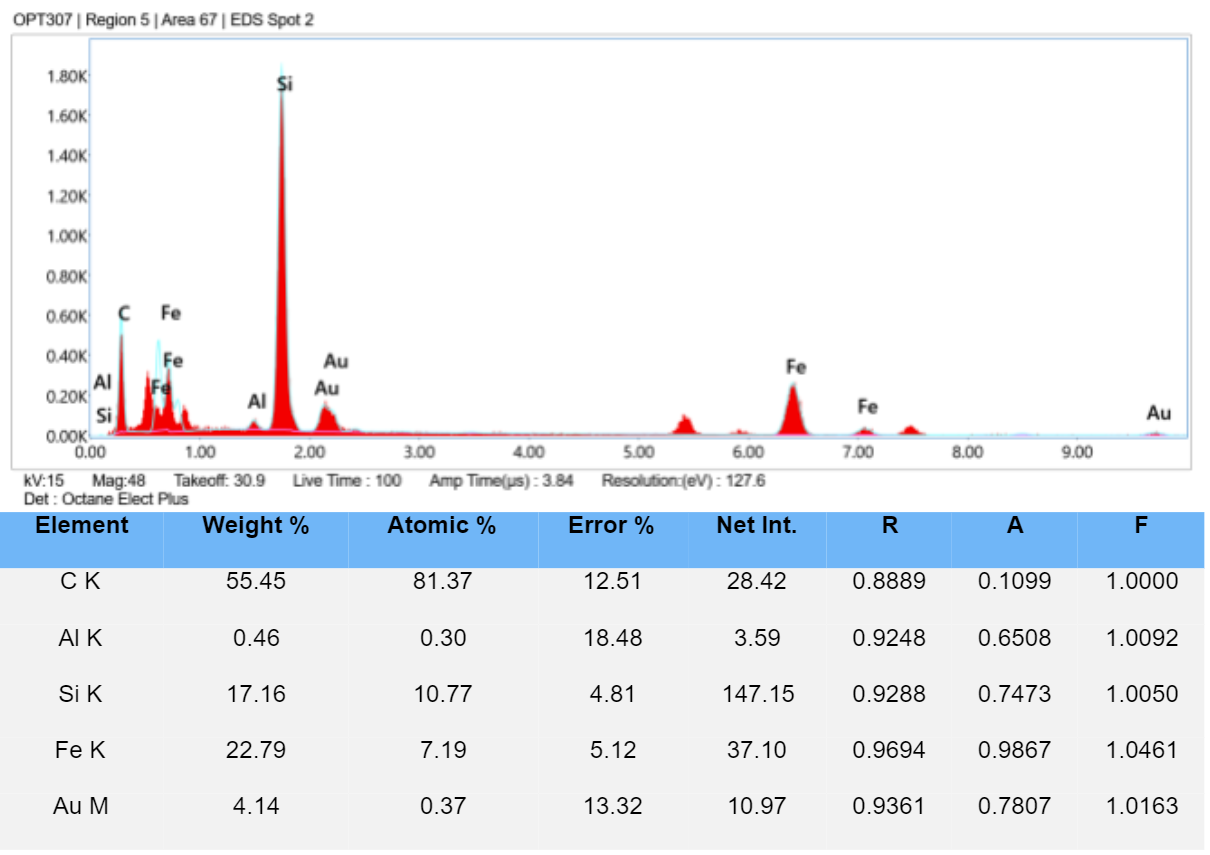
|
|
|
|
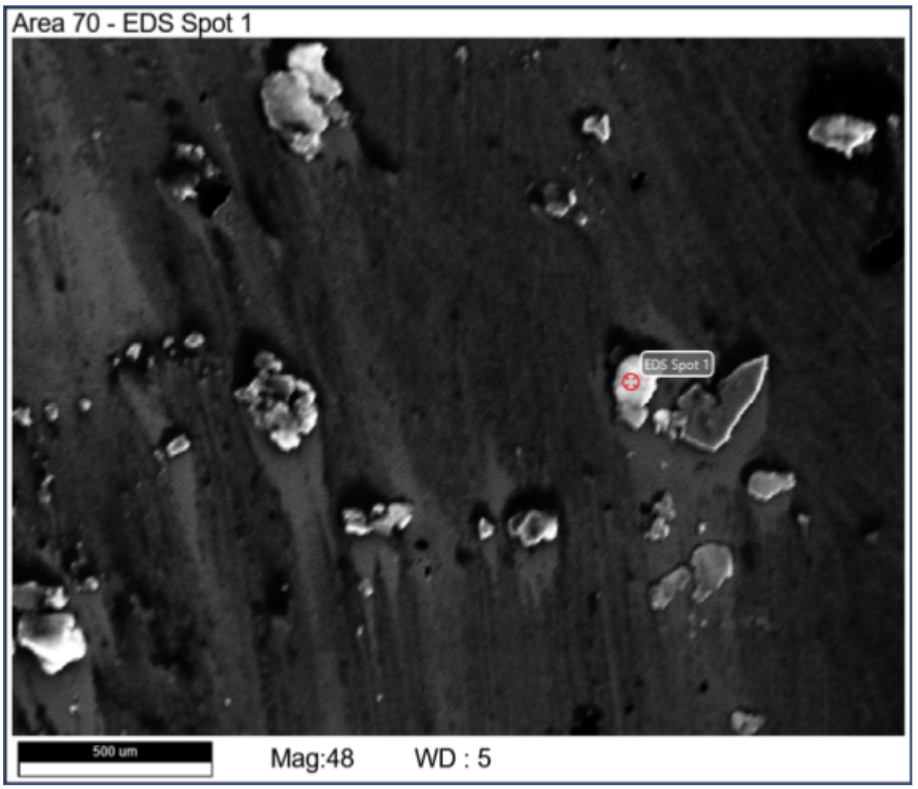
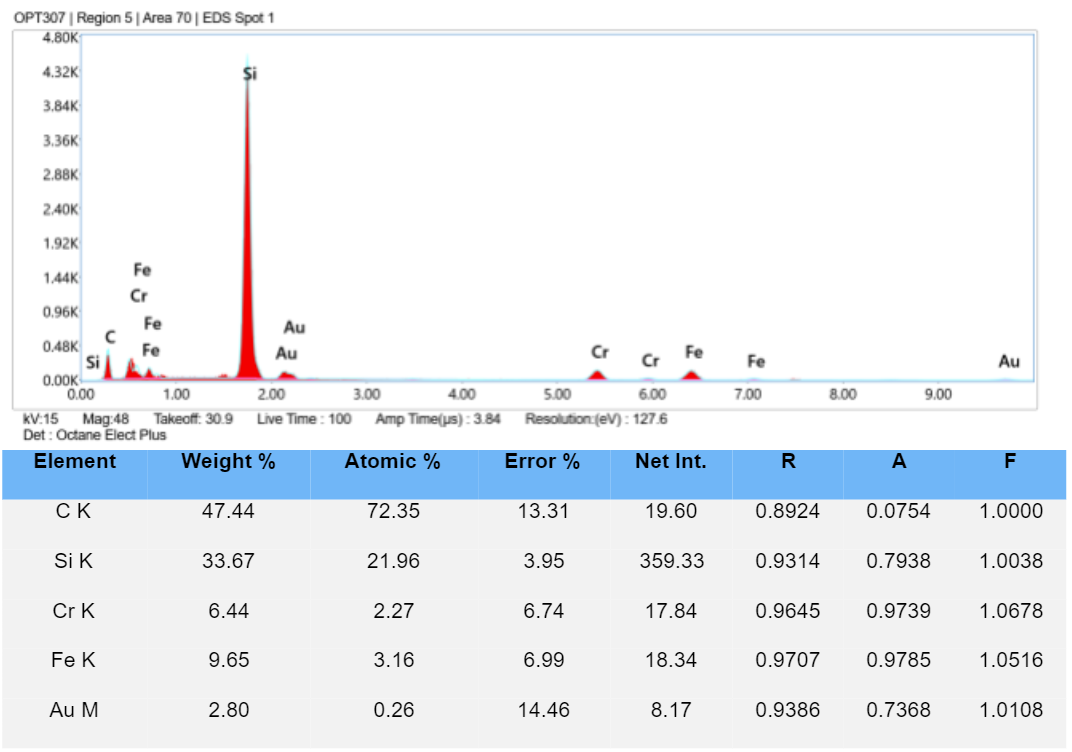
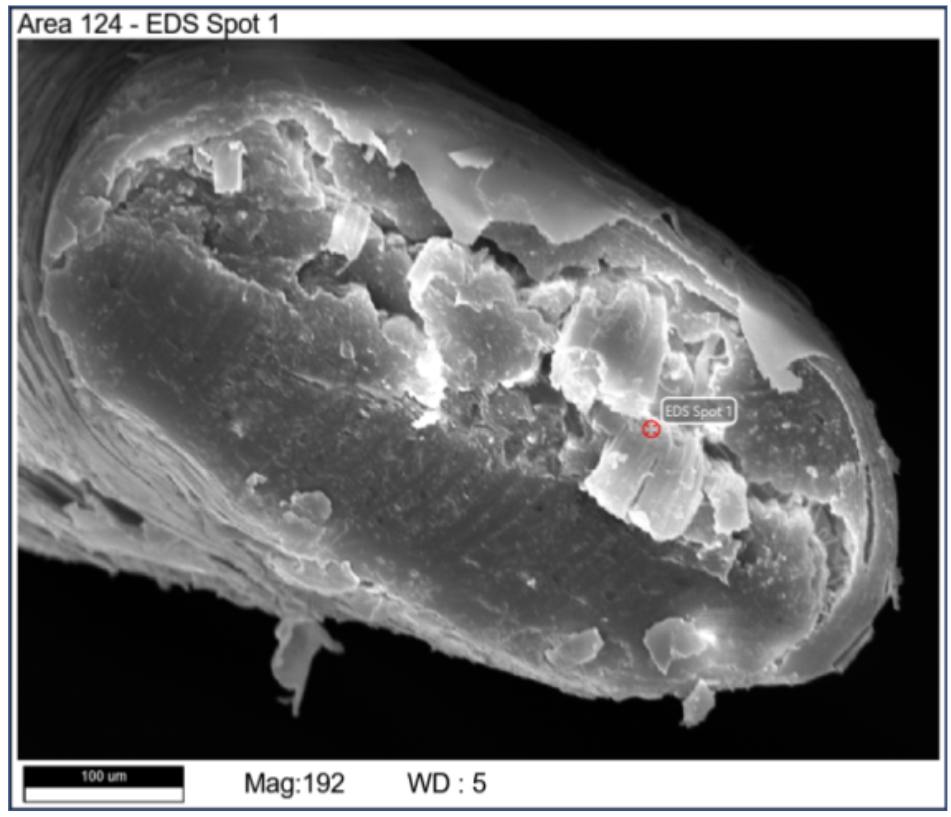
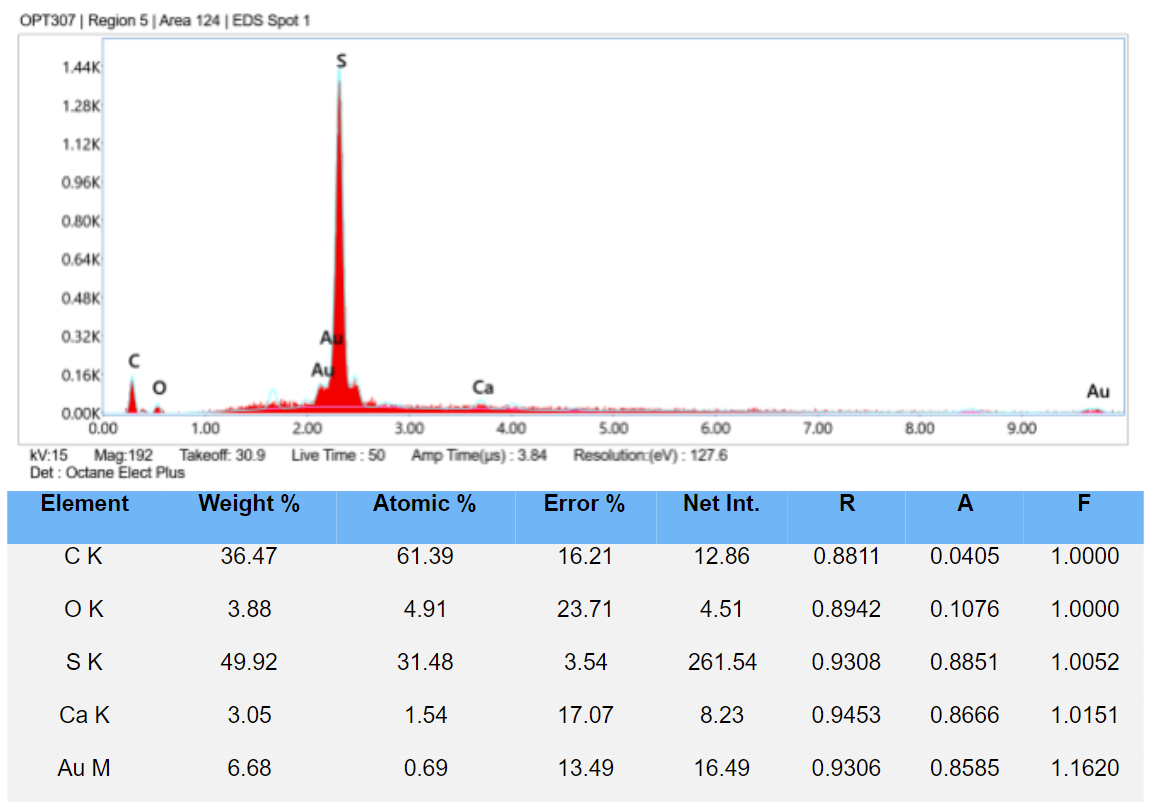
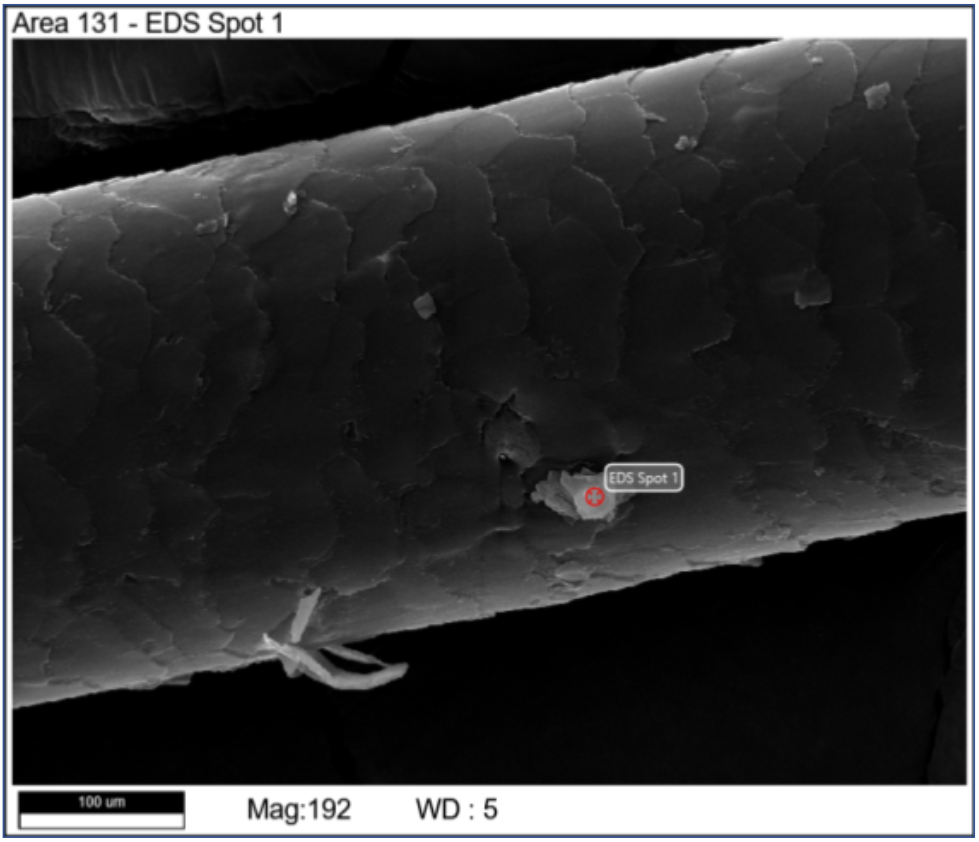
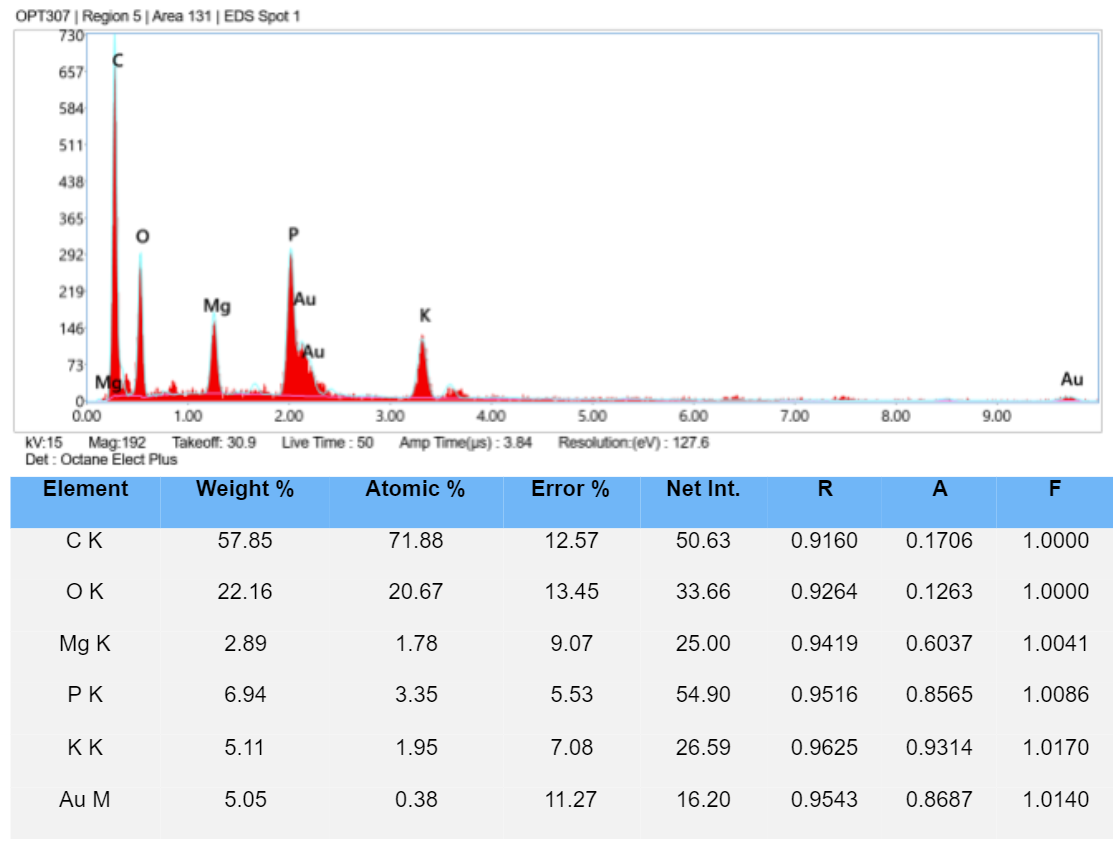
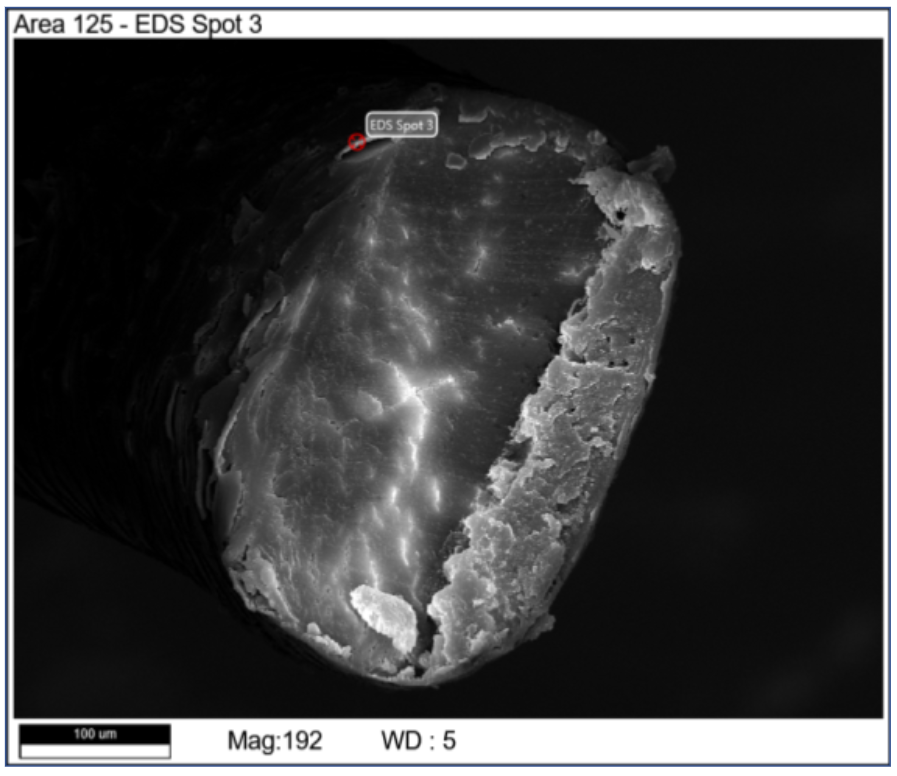
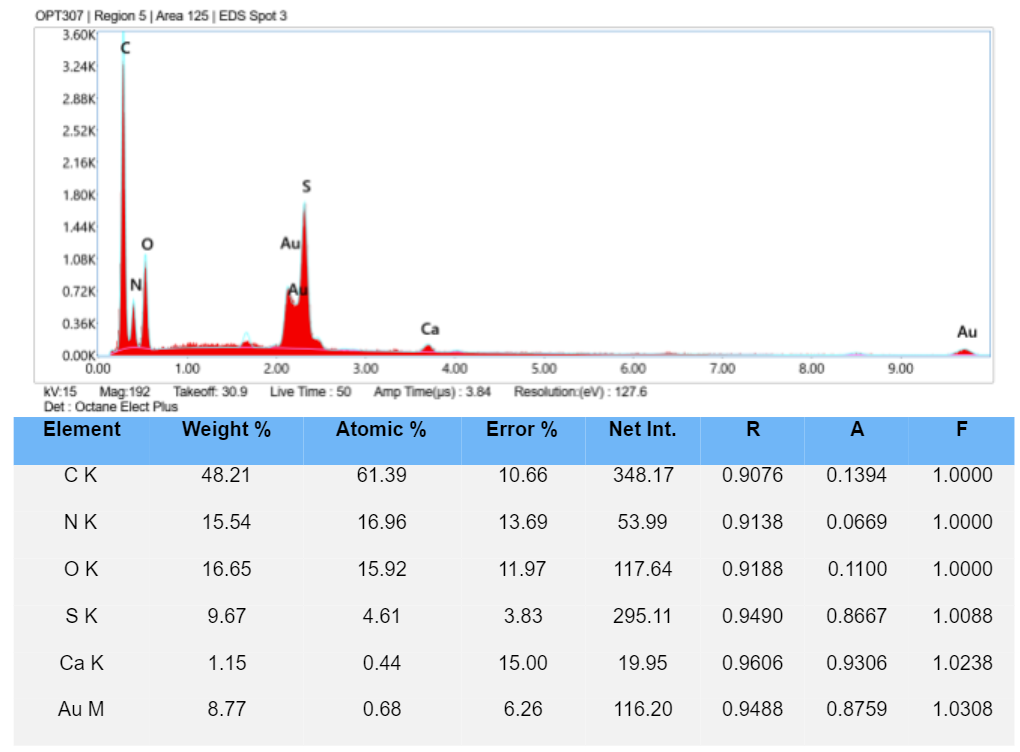
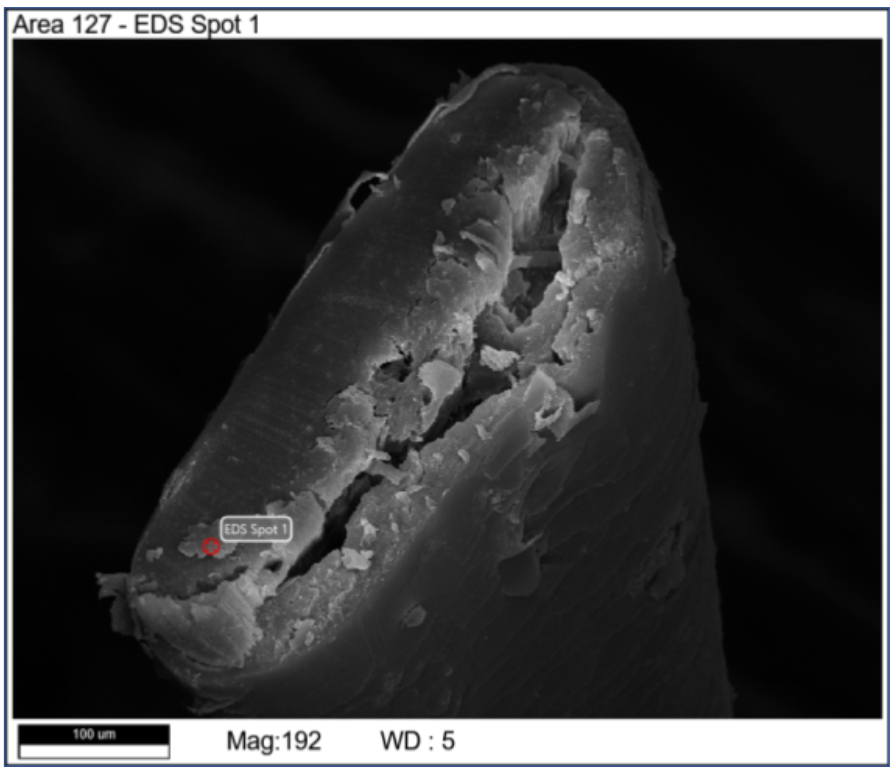
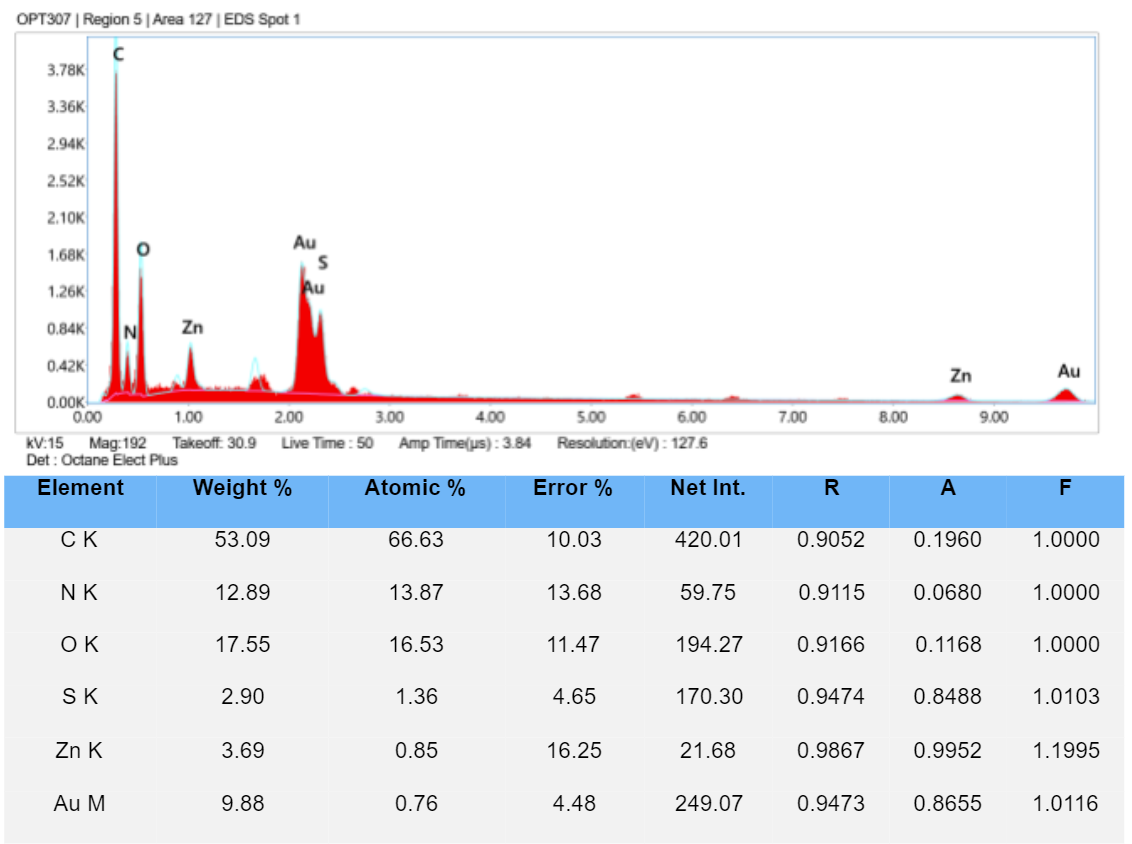
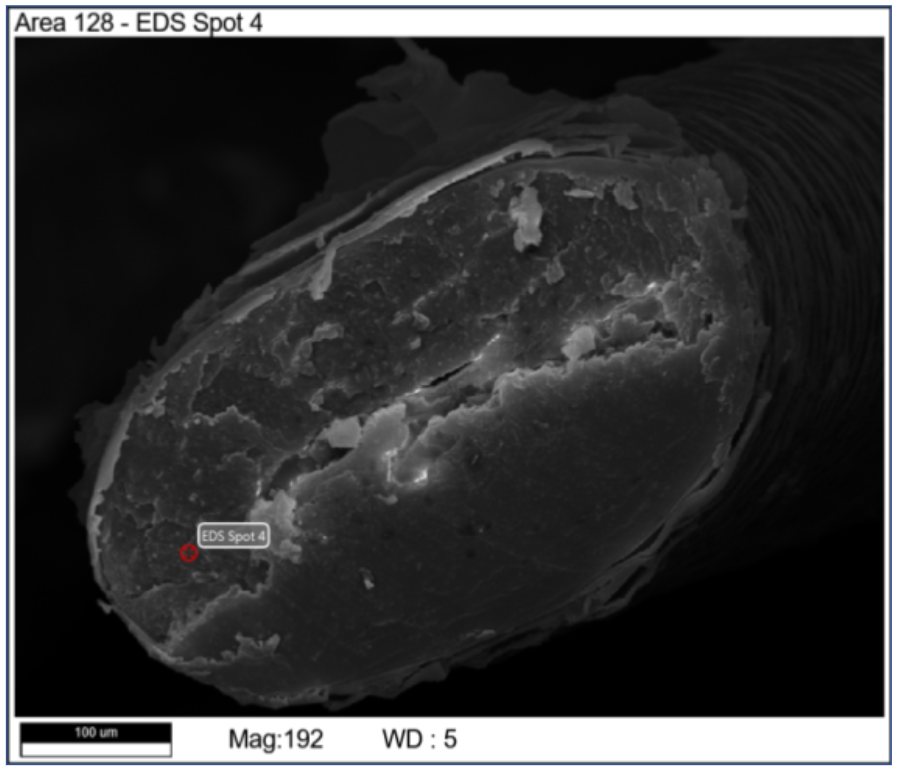
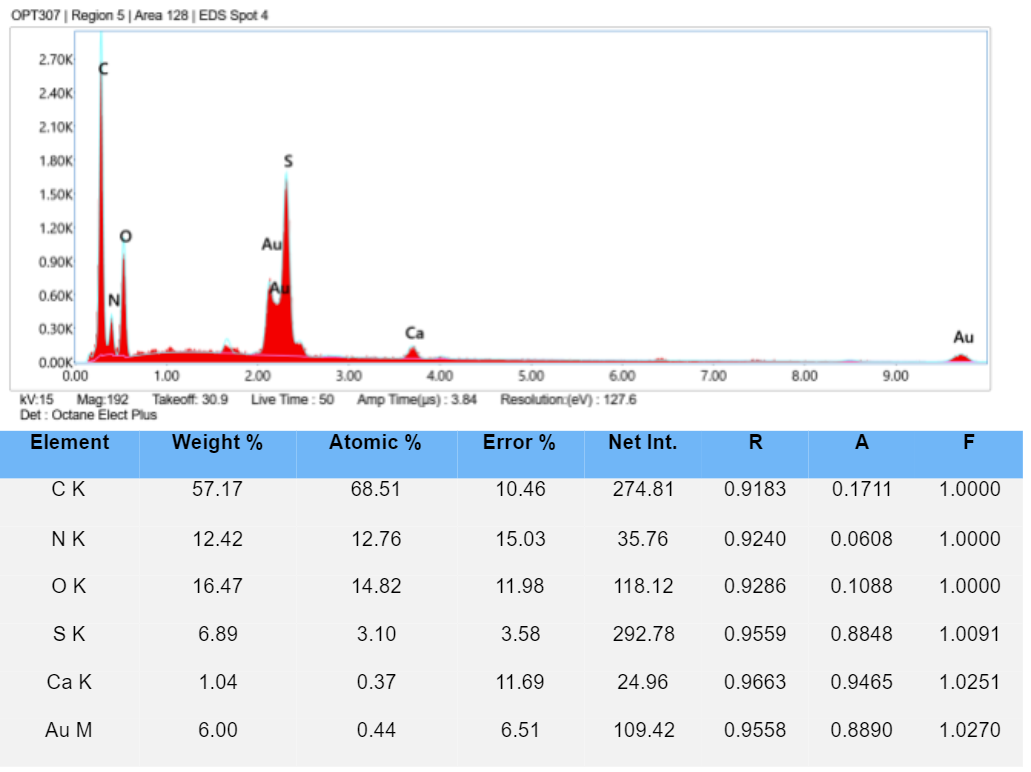
2. Hair Samples EDS Analysis
|
|
|
|
|
|
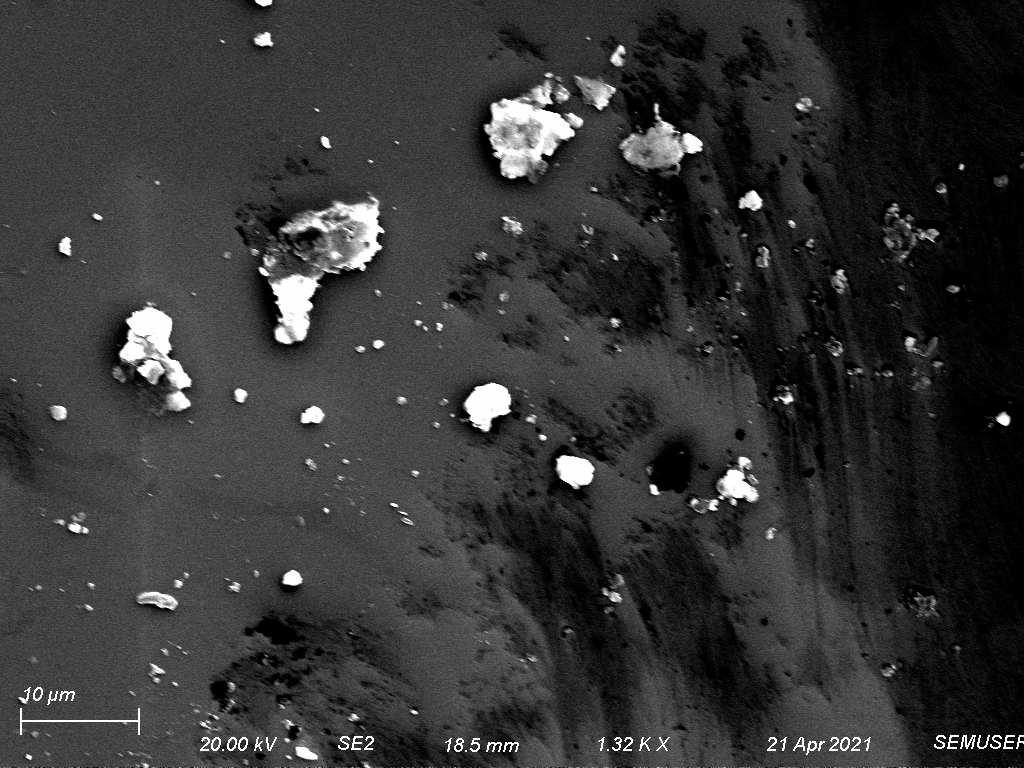
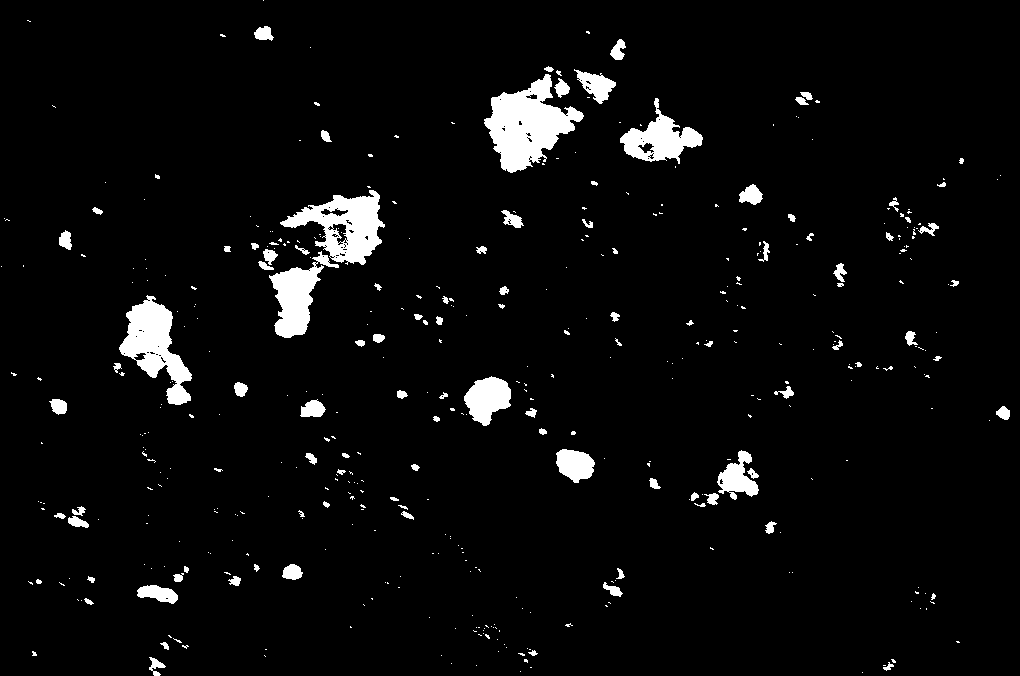
5. ImageJ
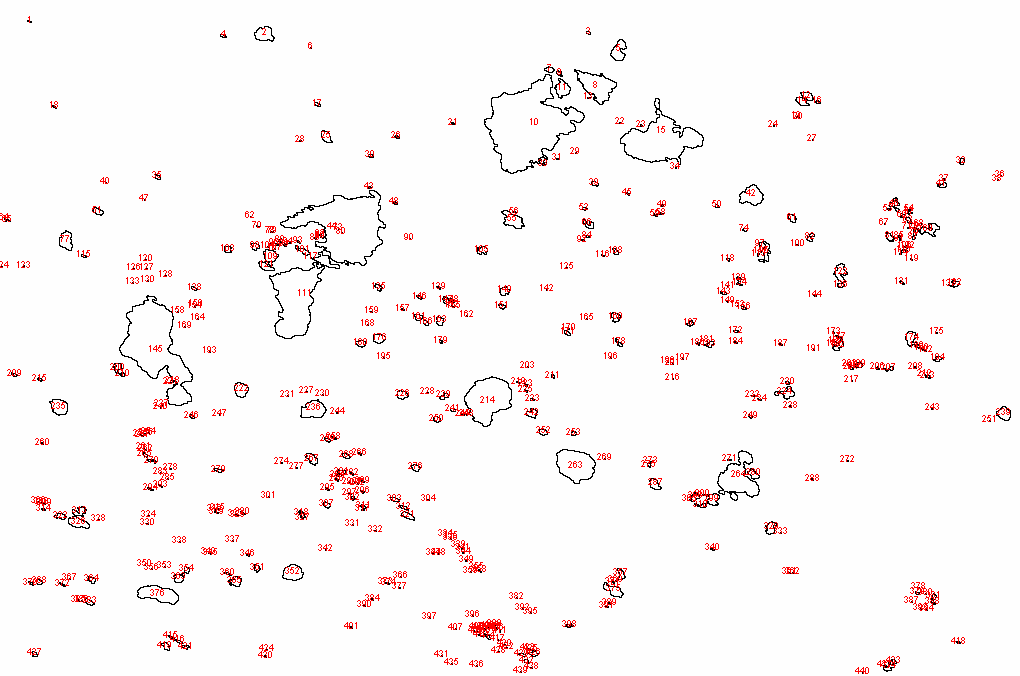
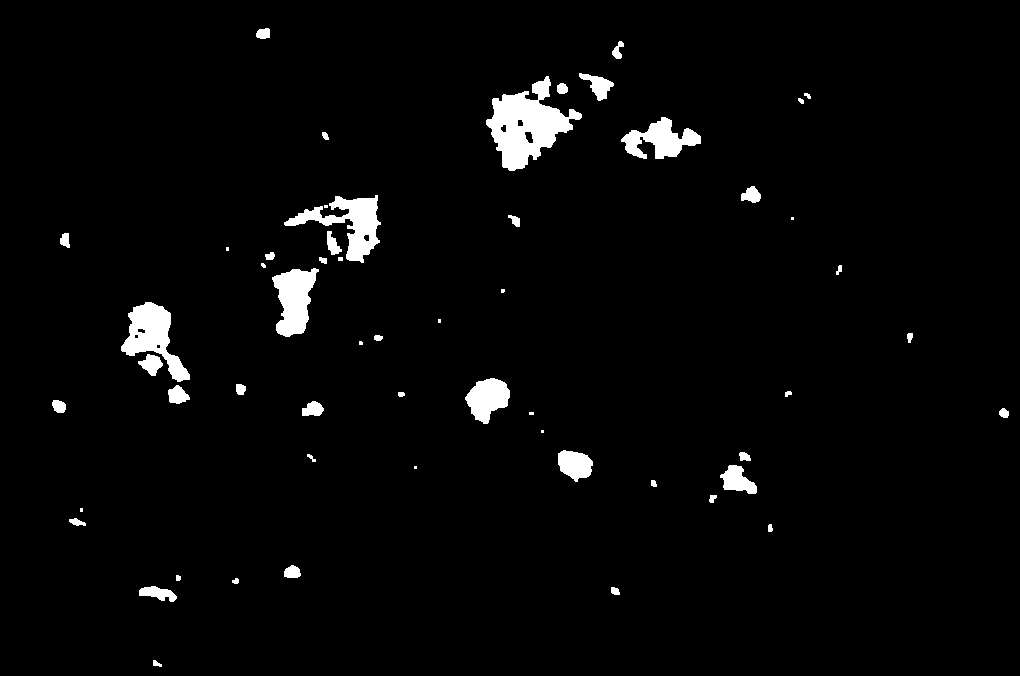
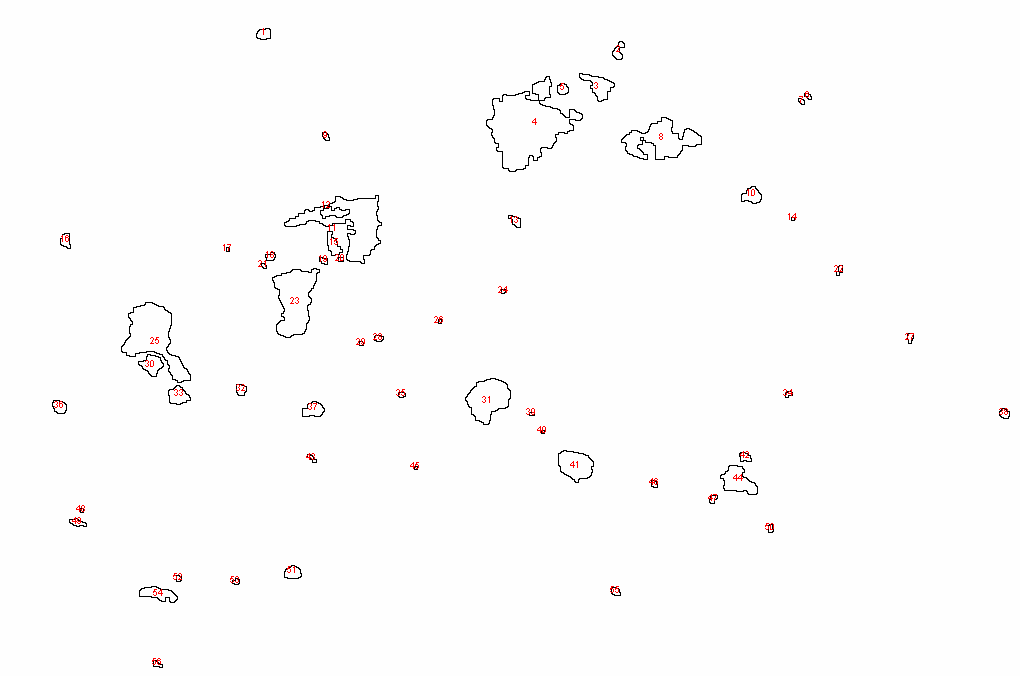
Fingerprint Sample : Particles Count
|
|
|
|
Conclusions
1. Observations and Discussion
The interaction volume section presents a difference between Bulk and Film on Substrate as well as different accelerating voltage. The images presented in this project were taken at both high and low voltages, for resolution and contrast purposes. More images were taken of different locations on the samples such as hair root follicules, different skin cells and other particles, but were not added to this webpage for the sake of project succinctness. It was very interesting to observe the difference in shapes and elements detected on different fingerprints. Logically that is due to the different situations where and when samples were collected. We could notice multiple skin cells, salts and elements. Potential contamination of samples during the sample preparation, prior or post-preparation. We conducted some imaging with the Back Scatter Electron Detector but the method was not continued due to the insignificance of the different density material on the sample, and as such Secondary Electron Mode was sufficient for good resolution imaging. That is also clear through the EDS analysis which shows only significant peaks for the Silica and Gold, and only Carbon and/or Oxygen in some cases. Meanwhile, the salt elements are present in very small, near insignificant, quantities. For Hair samples, we notice the difference in ellipticity between the different cross-section samples which might be an indicator of ethnic difference. Although, a tool was used to cut the hair perpendicularly, it is possible however, that the blade cut at an angle inducing some ellipticity to the shape. The X-ray EDS analysis is really helpful in understanding the composition of the various particles found on the samples' surfaces.
in ImageJ, we count the particles which most likely contaminents from the tweezer used in the sample collection and preparation step or from a stainless steel object touched by the individual pre-sample collection. We then present the original image as well as two different particle analysis methods, prior and after binary processing to limit background noise and insignificant particle counting. As seen in the results, the overall number decreases from 440 to 56.
This project has huge potential for a more thorough and in-depth analysis. What is presented serves as an intital introduction into the world of human identificators as an interesting topic of research. The hope from the start of this journey was to provide a glimpse into an interesting topic for future students and microscopy enthusiasts looking for an independent research idea. The perk of being on a very diverse campus opens many opportunities to study this diversity, collect data and understand the beauty of humanity in a Microscopy lab.
2. Acknowledgements
This class has been a wonderful learning opportunity and immersion experience into the world of microscopy. The theoretical knowledge as well as lab experience gained are extremely valuable skills and this project has been a culmination of many efforts and advice. As such, I am extremely grateful for the support and help of Brian McIntyre and Karla R. Sanchez Lievanos who have been great mentors. I would be happy to discuss this project and I look forward to answering any questions or comments about my work. Thank you!
3. Background References
[1] Garner, G E et al. “Visualization of fingerprints in the scanning electron microscope.” Journal - Forensic Science Society vol. 15,4 (1975): 281-8. doi:10.1016/s0015-7368(75)71000-9
[2] Kaliyadan, Feroze et al. “Scanning Electron Microscopy Study of Hair Shaft Damage Secondary to Cosmetic Treatments of the Hair.” International journal of trichology vol. 8,2 (2016): 94-8. doi:10.4103/0974-7753.188035
[3] Lee, Yoonhee et al. “Comparison of hair shaft damage after chemical treatment in Asian, White European, and African hair.” International journal of dermatology vol. 53,9 (2014): 1103-10. doi:10.1111/ijd.12247
[4] “Fingerprints: Can they reveal your ethnicity?”,How It Works website, September 30, 2015.
[5] Topaloglu, Nurettin."Revised: Fingerprint classification based on gray-level fuzzy clustering co-occurrence matrix". Journal-Energy Education Science and Technology Part A: Energy Science and Research. vol.31,3 (2013): 31. 1307-1316.
Comments