Methods and Results
1. Results Summary
|
For the Qualitative Review: the GSR on the printer paper was visible to the naked eye, yet not visible on other surfaces or at other distances. As expected, there were more irregularly shaped particles at the samples collected at the shortest distance from the muzzle, dmuzzle = 1 ft, and there were spheroid particles detected throughout all samples and distances. There were also many organic deposits found on the paper samples at dmuzzle = 1 ft. Lastly, the GSR morphology was markedly different between the silicon and paper samples.
For the EDS X-ray spectroscopy: the expectations were met. However, although Sb, Ba, and Pb can be detected, there was less certainty that Sb was present. Other commonly detected elements included C, N, O, Al, Pt, and Si.
For the Quantitative Review: the expectations were generally met. There was an inverse relationship between particle density and distance from the muzzle, however inconclusive results when distance from the gunshot hole varied. Also, there were very few particles on dmuzzle = 5 ft samples.
|
2.Qualitative Review
| Out of the three elements of interest, the molecular weights are as follows: Sb (121.76 g/mol), Ba (137.33 g/mol), and Pb (207.2 g/mol). Thus, particles with higher composition of Sb and/or Ba should be darker under BSD. Organic deposits should have even lower molecular weights, and therefore are even darker under BSD.
|
| Typical GSR Particle Morphology:
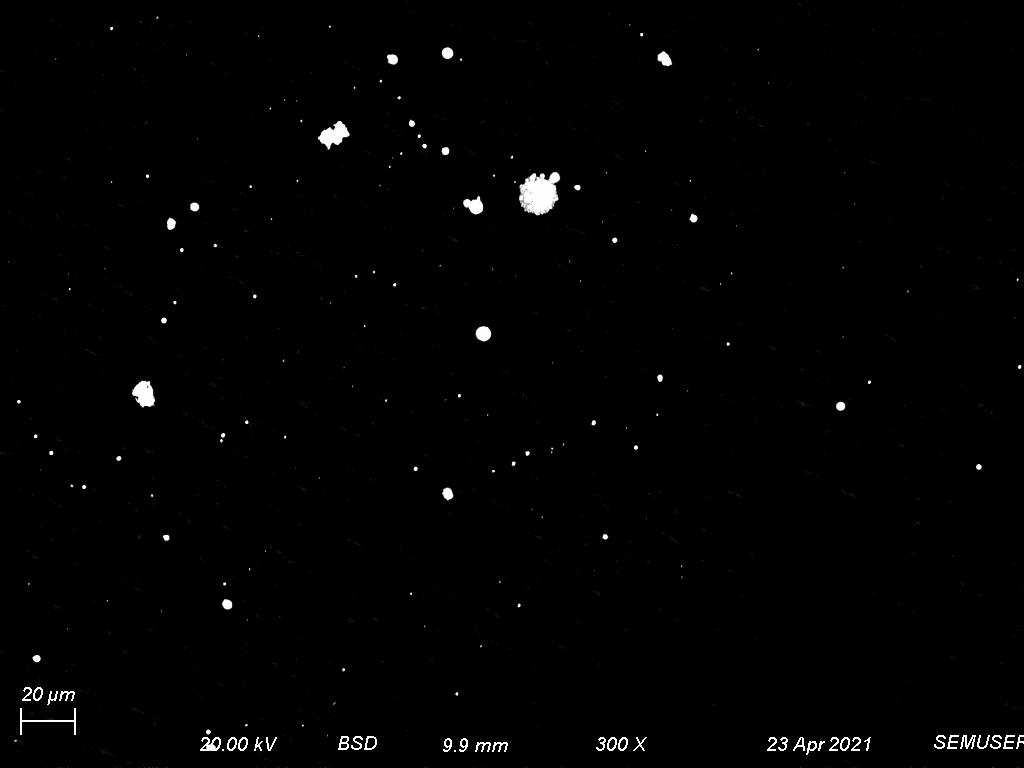
Typical GSR particle morphology is a spheroid, which can be seen in Figure 5, along with examples of atypical shapes. |
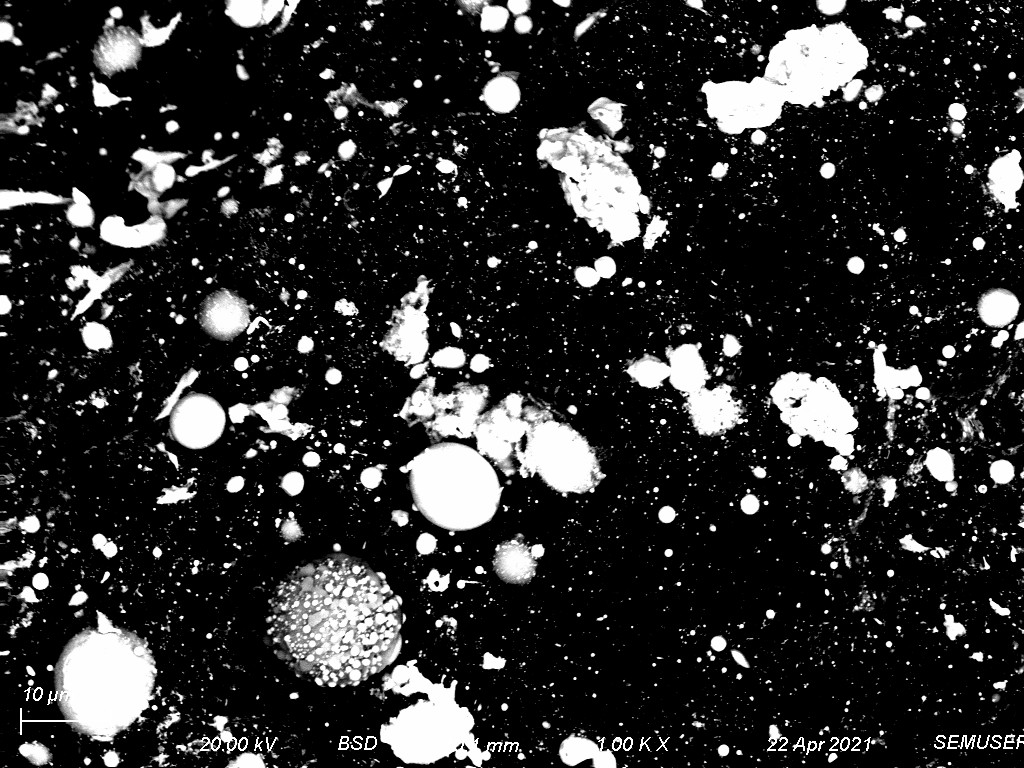 |
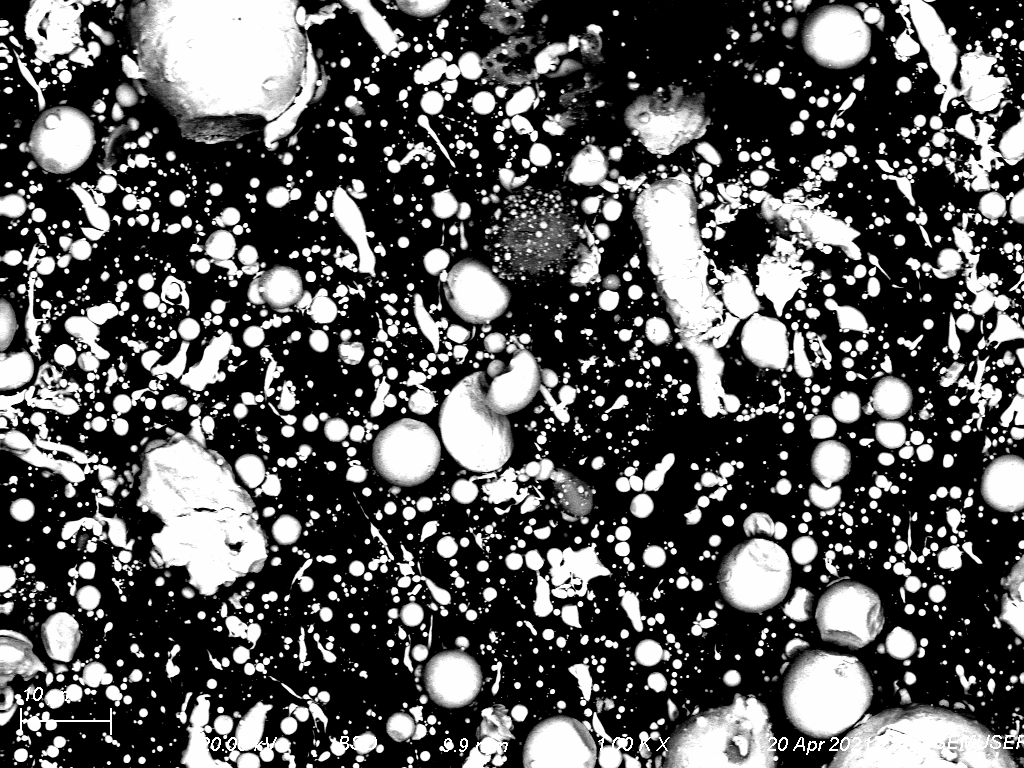
| Figure 5. (100% BSD) Spherical GSR particles of varying diameters can be seen on this surface of printer paper (dmuzzle = 1 ft, dhole = 0.0 mm). There are also many particles here with irregular morphology. |
| GSR Differences on Paper v. Silicon:
GSR differences between paper and silicon samples is attributable to the fibers in paper versus the hard solid surface of silicon. The fibers in paper often break down large GSR deposits, but in the worst case (although rarely) a hole was formed; for silicon, large deposits can occur, but some particles don't adhere to the surface as well or at all. |
 |
 |
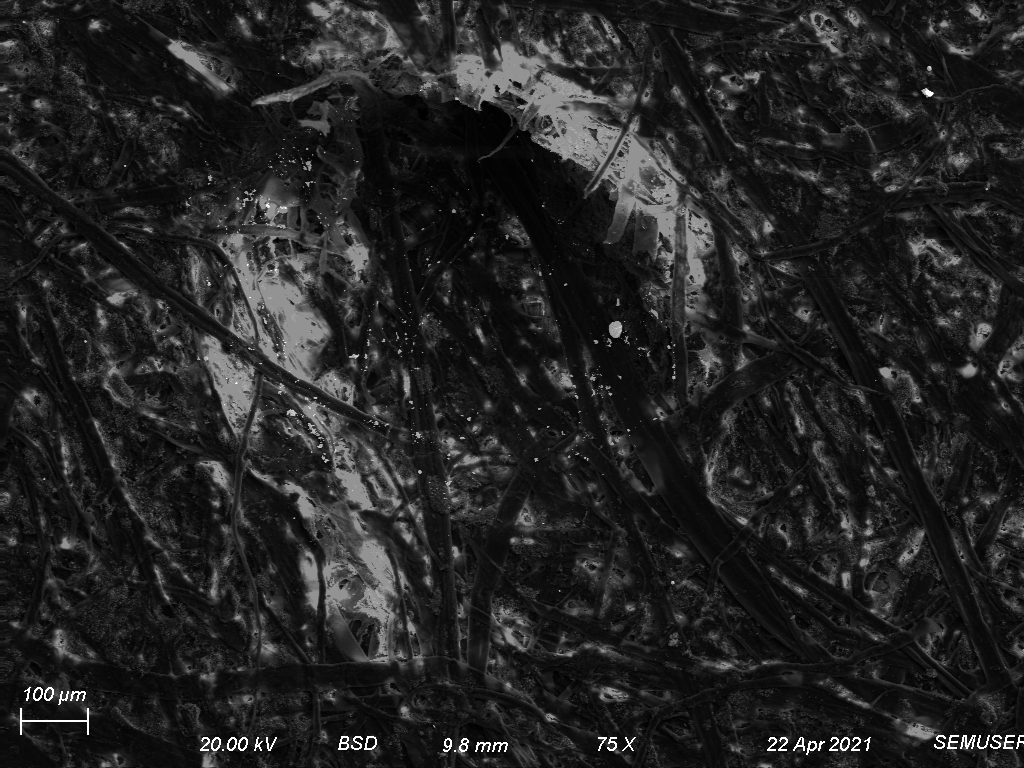
| Figure 6. A hole through printer paper (dmuzzle = 3 ft, dhole = 3.0 mm). There are some small GSR particles in the region of the hole. There is some charging around the edges of the hole as well. |
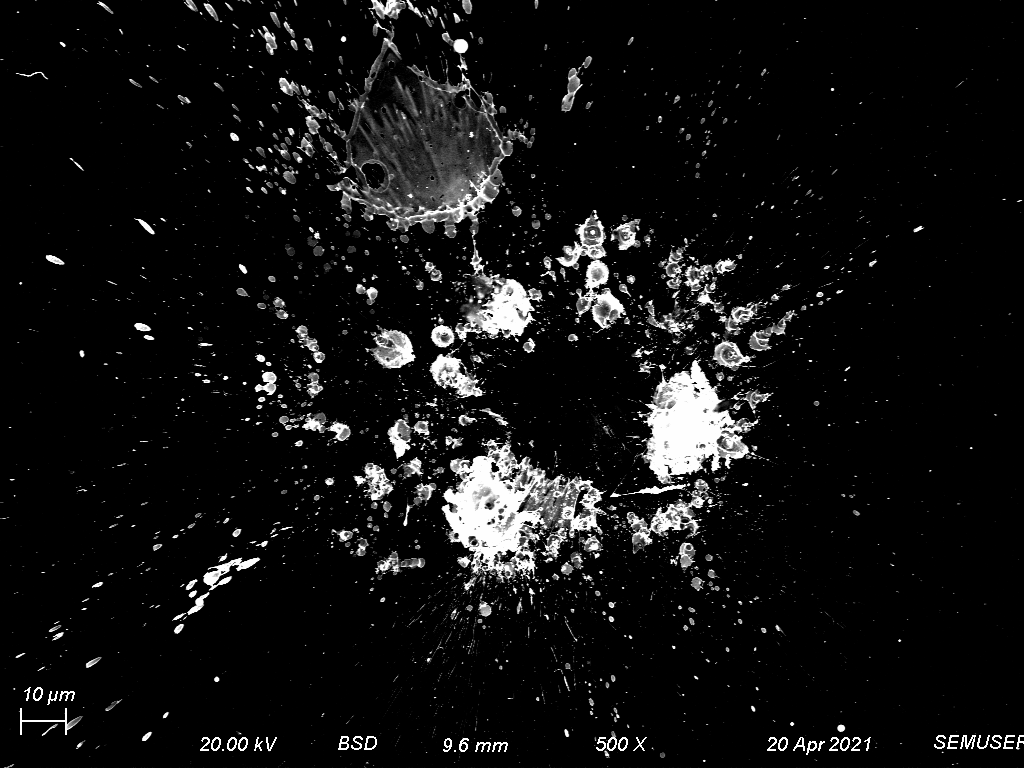
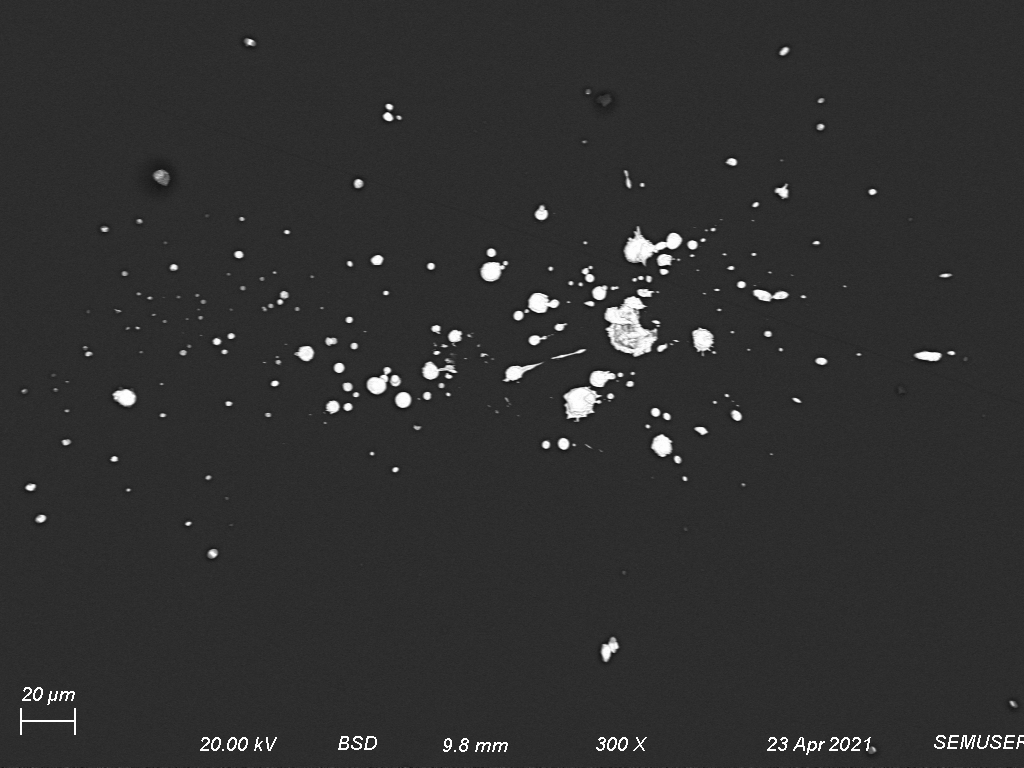
Figure 7. (100% BSD) GSR on Silicon (dmuzzle = 1 ft, dhole = 3.0 mm), which is primarily Pb. Notably, there's a central area which lacks any GSR, suggesting a high velocity particle hit this area and bounced back. |
| Additional examples of Silicon, include the following: |
 |
 |
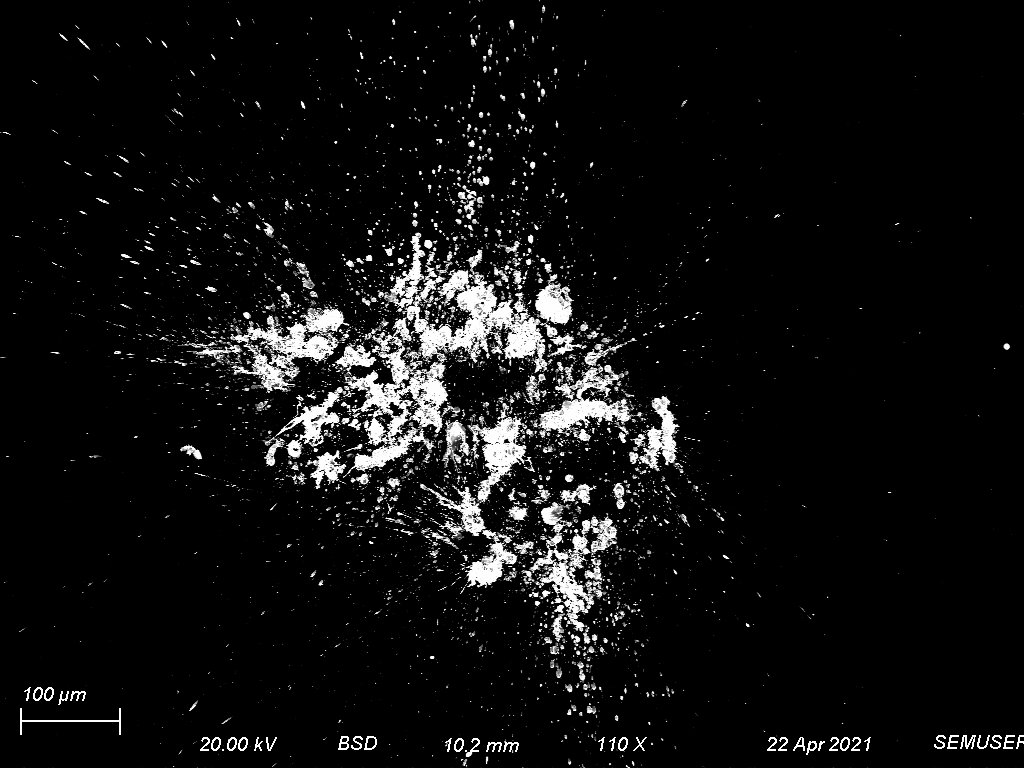
| Figure 8. GSR on Silicon (dmuzzle = 3 ft, dhole = 3.0 mm). While there's substantially more GSR, it still shows an empty central area where a high velocity particle likely bounced back. |
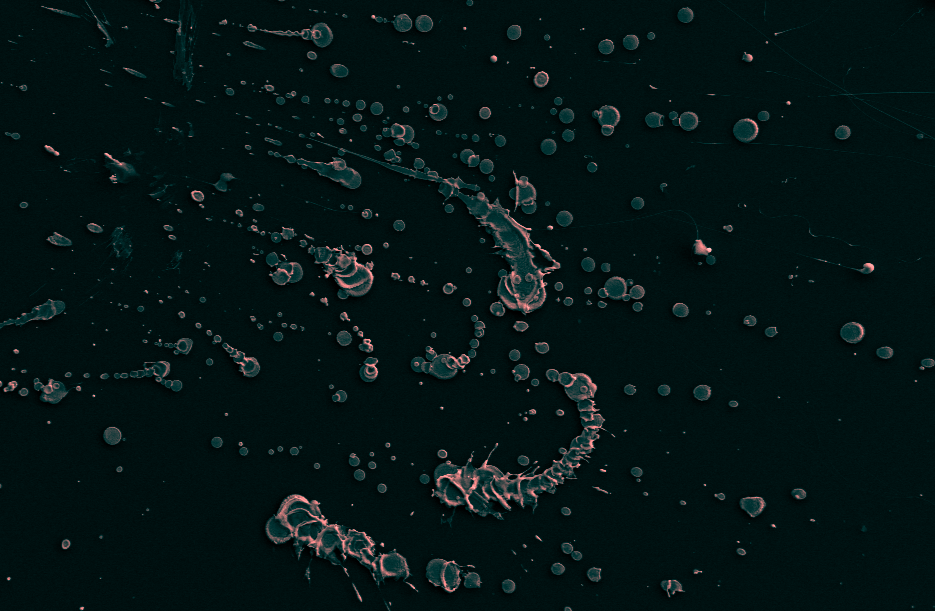
Figure 9. GSR on Silicon (dmuzzle = 3 ft, dhole = 3.0 mm), where this image was falsely colorized to emphasize the topography of the sample. As opposed to seeing an area where a particle was deflected, this image shows how some particles skid along the surface before stopping. Spheroid shapes do occur but are less common; in this region, all spheroids were flattened from impact. |
| Irregular GSR Particle Morphologies:
GSR differences between paper and silicon samples is attributable to the fibers in paper versus the hard solid surface of silicon. The fibers in paper often break down large GSR deposits, but in the worst case (although rarely) a hole was formed; for silicon, large deposits can occur, but some particles don't adhere to the surface as well or at all. |
 |
 |
| Figure 10. GSR on printer paper (dmuzzle = 1 ft, dhole = 1.5 mm), which is Pb. While the impact clearly caused some distribution, the metal does not appear to have been molten based on its powdery appearance. While other parts of the bullet contain lead (there's a lead-nose), this is perhaps unburnt lead particles from the primer. |
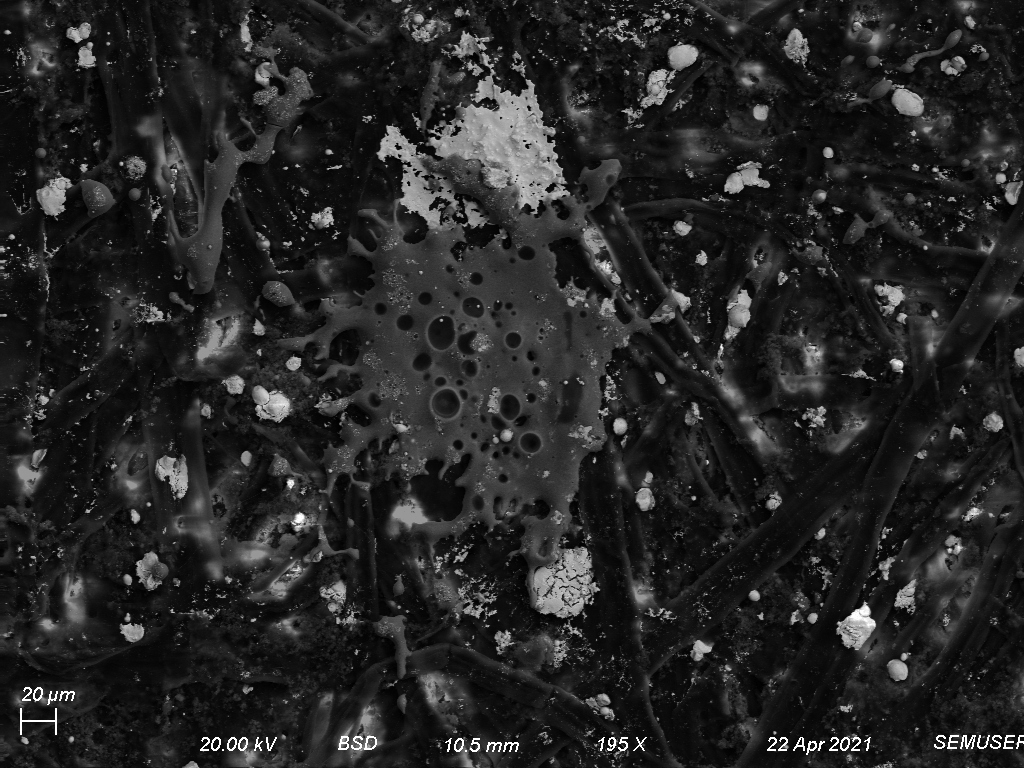
Figure 11. GSR on printer paper (dmuzzle = 1 ft, dhole = 0.0 mm), which has Pb and a thin layer of unknown composition with holes through it. It's possible that after the unknown layer landed, additional Pb particles hit the surface, and broke through the unknown layer (thus, it has holes); you can partially see Pb particles underneath the layer. The morphology of the unknown layer suggests it is metallic, while its low brightness suggests a lower MW. This image also shows how not all GSR hits the surface at one moment in time — there is delay, however short, before all particles land. |
 |
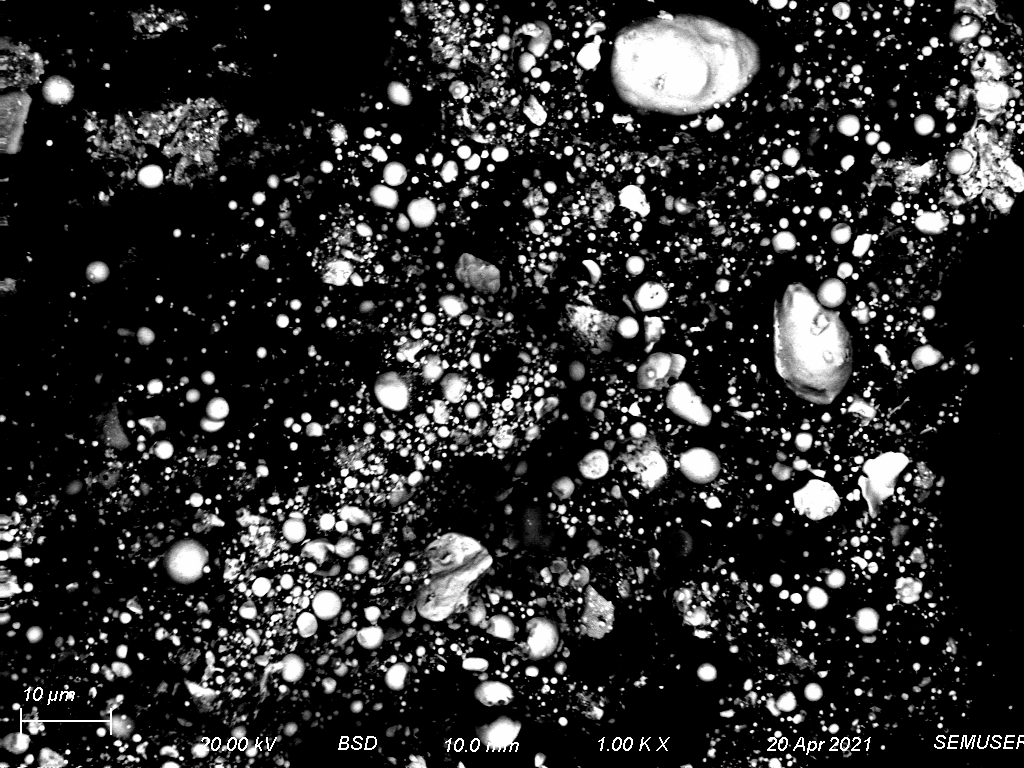 |
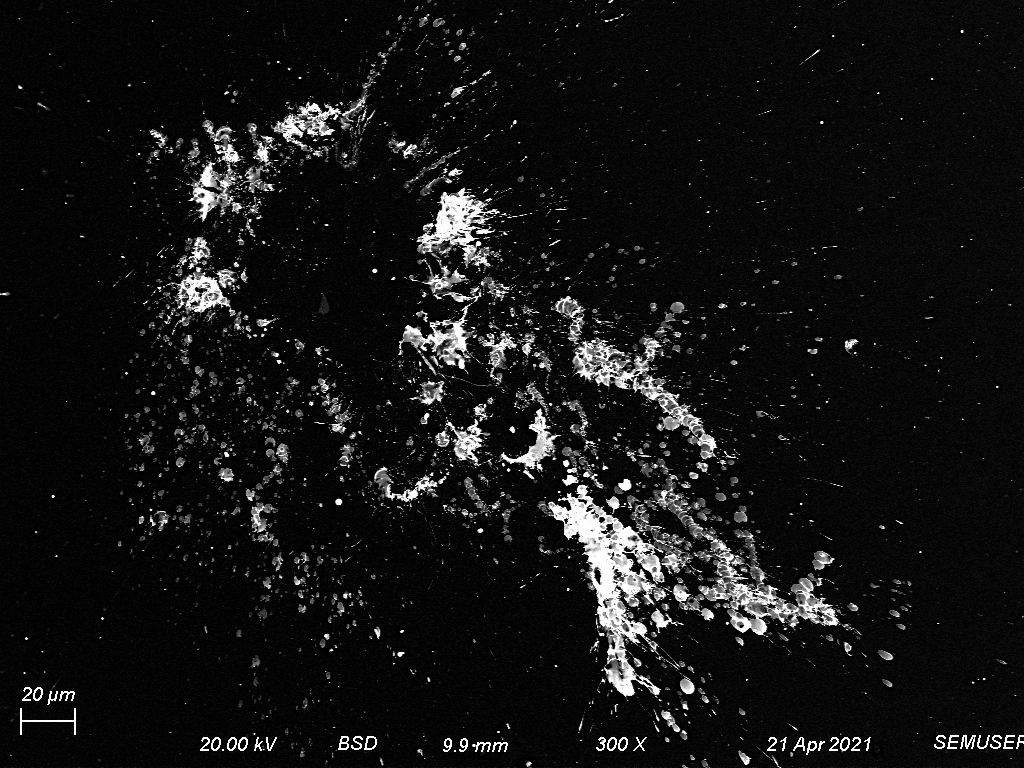
| Figure 12. Some areas, such as here, had an exceptionally high density of GSR particles. This area is on printer paper (dmuzzle = 1 ft, dhole = 0.0 mm), and these particles happen to be on top of a large carbon deposit. |
Figure 13. This area is on printer paper (dmuzzle = 1 ft, dhole = 0.0 mm). Similar to Figure 12, where these particles are on top of a large carbon deposit. Smaller organic deposits can also be identified on the top left. |
 |
 |
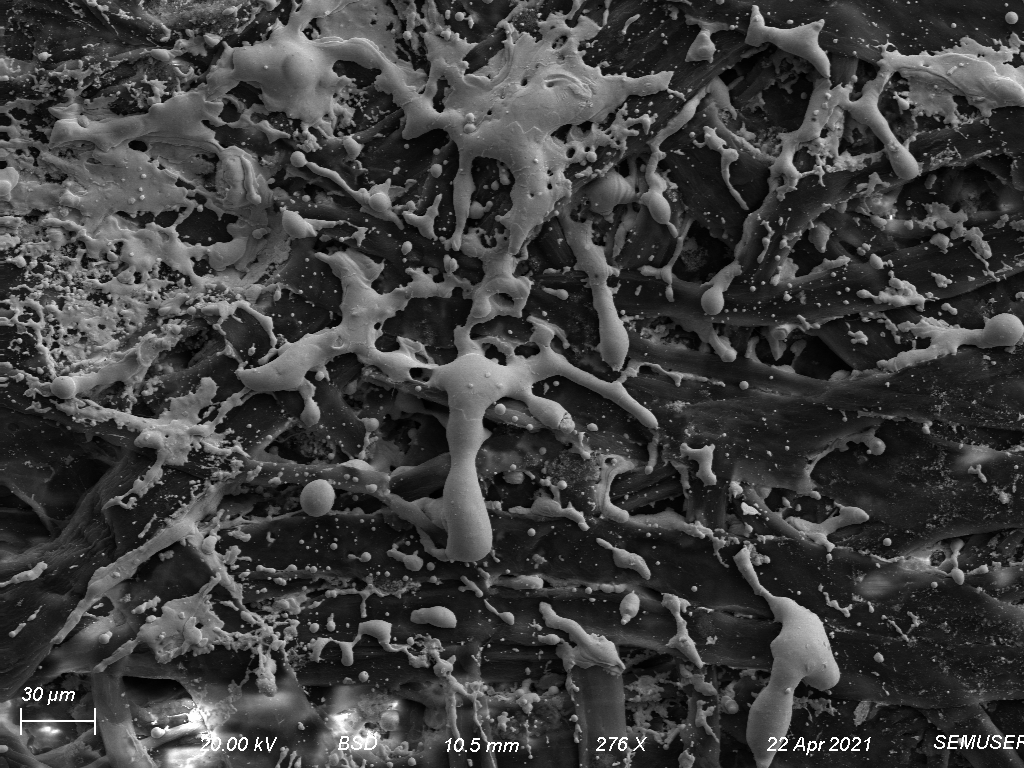
| Figure 14(a). GSR on printer paper (dmuzzle = 1 ft, dhole = 1.5 mm). The metal was likely still molten upon impact, resulting in some flattened areas (esp. if higher velocity on impact) and some areas that clumped together on the paper. (See [6].) This molten-looking GSR was very commonly found at 1 ft paper samples, but not as much or at all for further distances; it's likely the shorter span of time being airborne meant the GSR here had not yet cooled or hardened. |
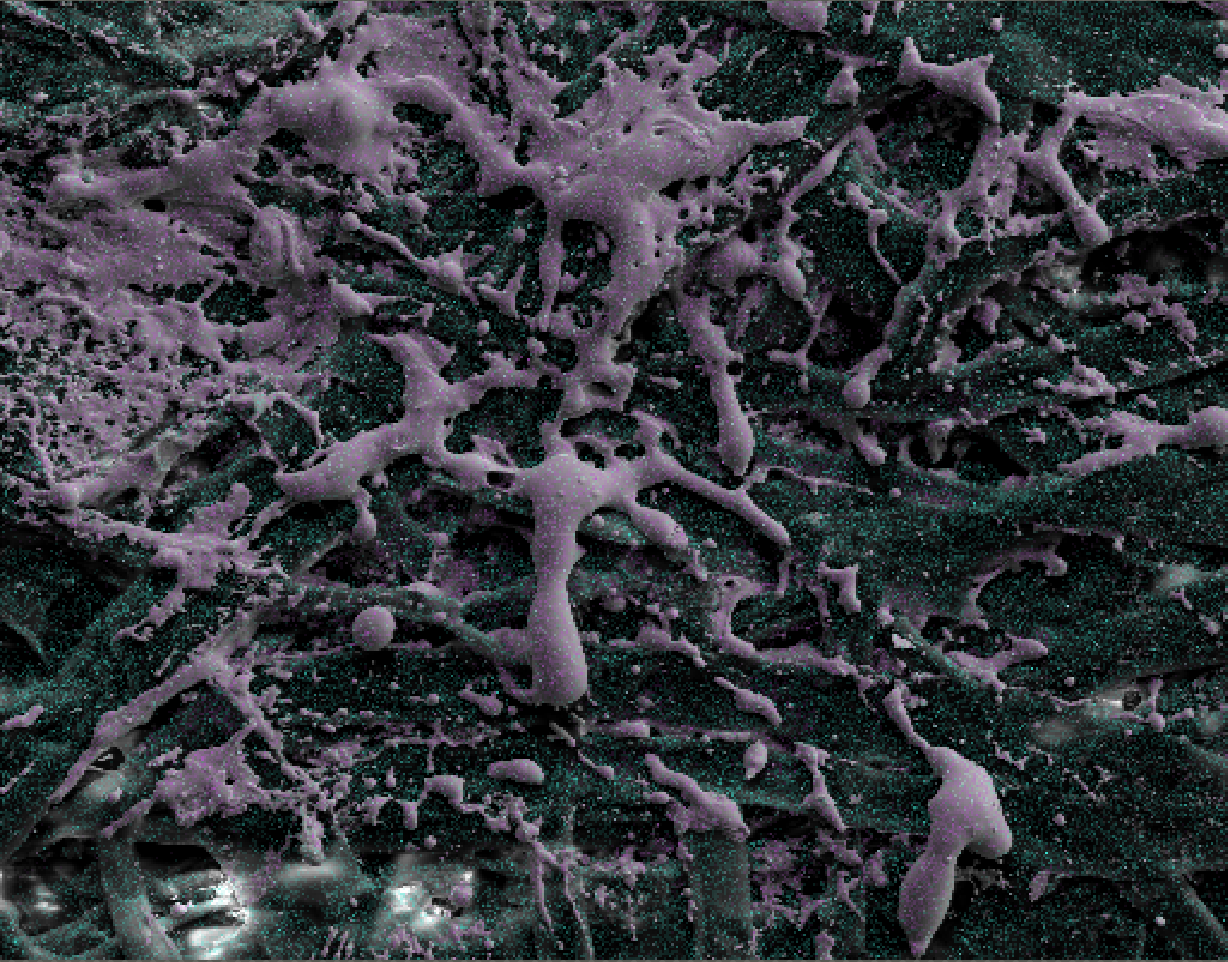
Figure 14(b). This represents an overlayed image of the elemental mapping, via EDS X-ray spectroscopy, which primarily consists of Pb (purple) and Carbon (green) from the paper's fibers. (Pb composition of the metal is >98% weight.) Not shown: trace amounts of Ba and Zn were detected as well. |
3. EDS X-ray Analysis
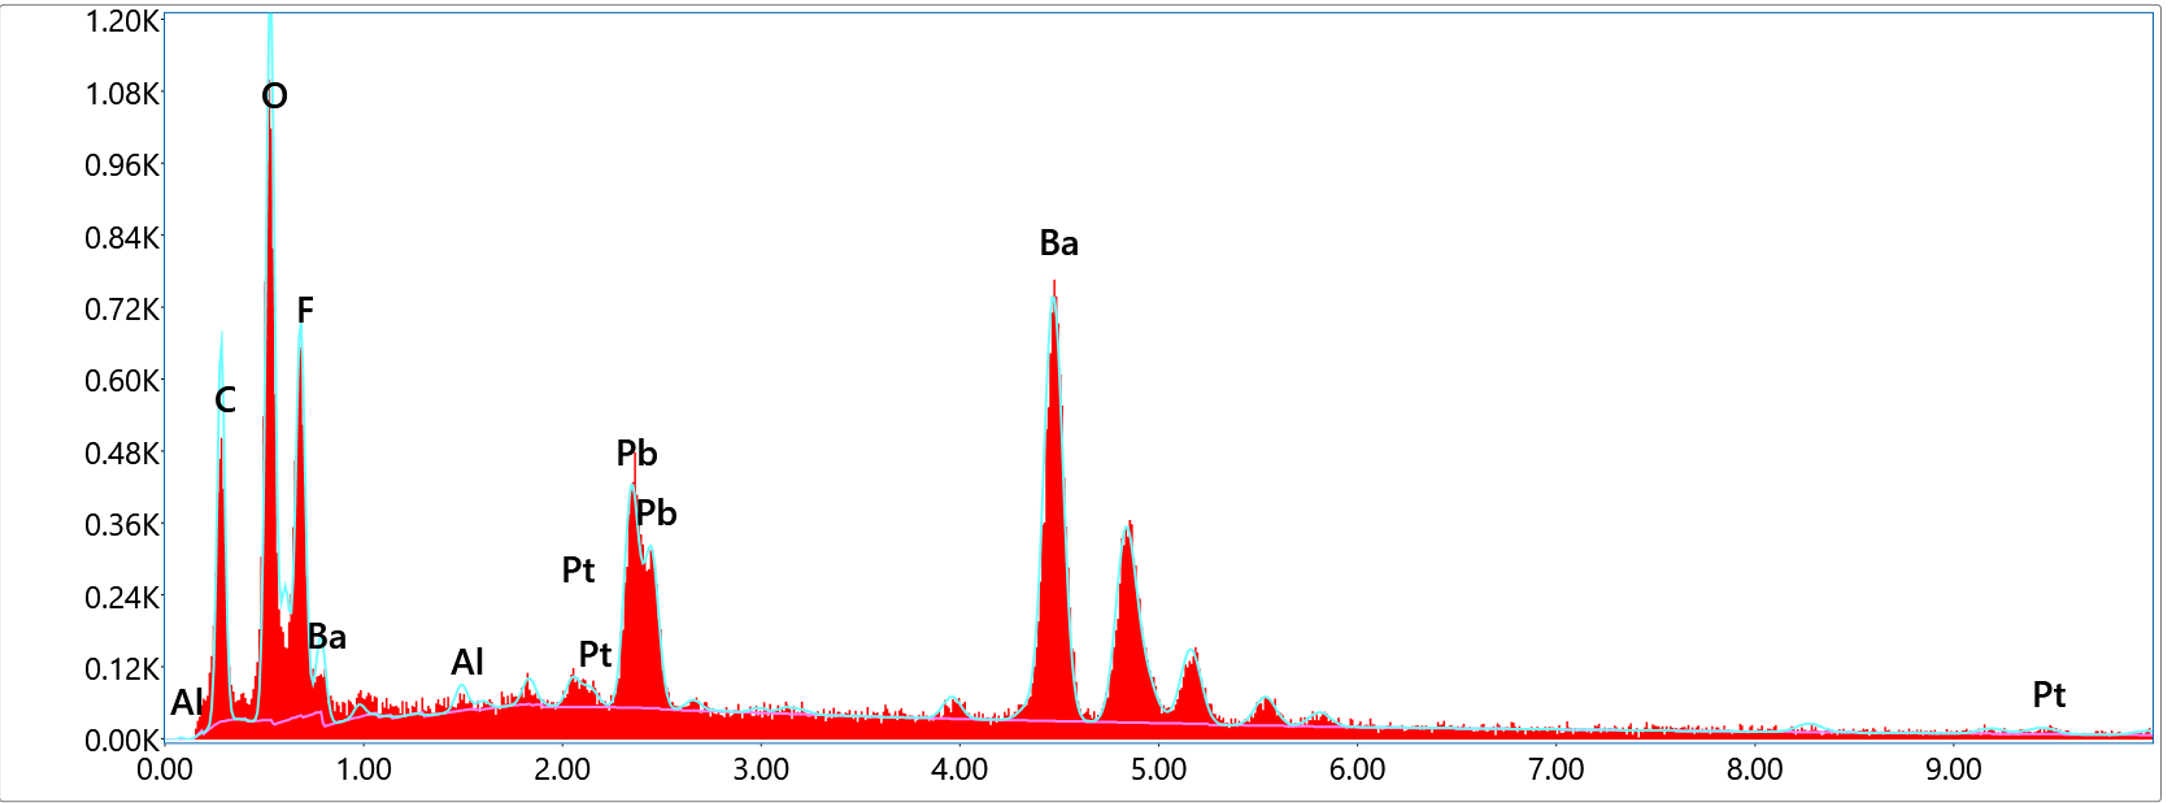
| X-ray spectrometry was used to analyze the elemental composition of various particles. Usually 100 seconds was used per particle or area selected. In terms of characterizing the GSR, lead and barium could be detected with high confidence, however there was greater uncertainty with antimony. Commonly detected elements include: Pb, Ba, C, N, O, Al, Pt, and Si. Other less commonly detected elements include: F, Zn, Sb, Ca, K, etc. |
Examples of X-ray Spectra:
 |
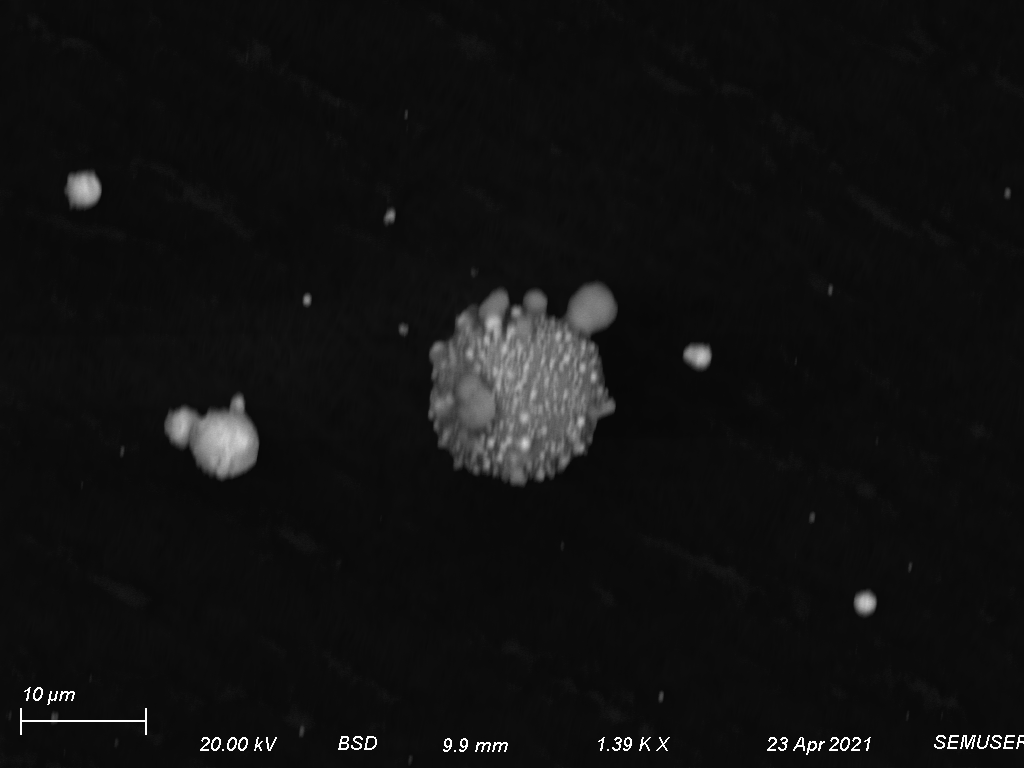 |
| Figures 15 (left) & 16 (right). X-ray spectrum and image of GSR on hydrocarbon paper (dmuzzle = 3 ft, dhole = 3.0 mm). X-ray spectrum is focused on the center particle which contains barium with smaller deposits of lead on top. |
In addition to the parameters stated, all images were taken under high contrast to optimize the images for particle counting in ImageJ. The magnification for all images was taken under 300 X, and there was no overlay between BSE and SE2 detectors—only BSD was used for the following images.
The particle counting was conducting using ImageJ, where particles on the edge were excluded. The watershed function was used to separate overlapping particles.
Ultimately, there were three considerations for how particle density varied: (i) across ammunition rounds,(ii) across distance from the gunshot hole (dhole), and (iii) overall variability across surfaces and distances from muzzle (dmuzzle).
(i) Variability of Ammunition Rounds:
There were three iterations of firing the gun at 1 ft away, with a new piece of printer paper for each time. One strip from each page was cut out, then compared for GSR particle density.
|
Table 1. GSR Particle Density Across Printer Paper Samples (dmuzzle = 1 ft, dhole= 0.0 mm)
| 1st Iteration |
2nd Iteration |
3rd Iteration |
| 7.81 · 10-3 particles/µm2 |
32.0 · 10-3 particles/µm2 |
7.37 · 10-3 particles/µm2 |
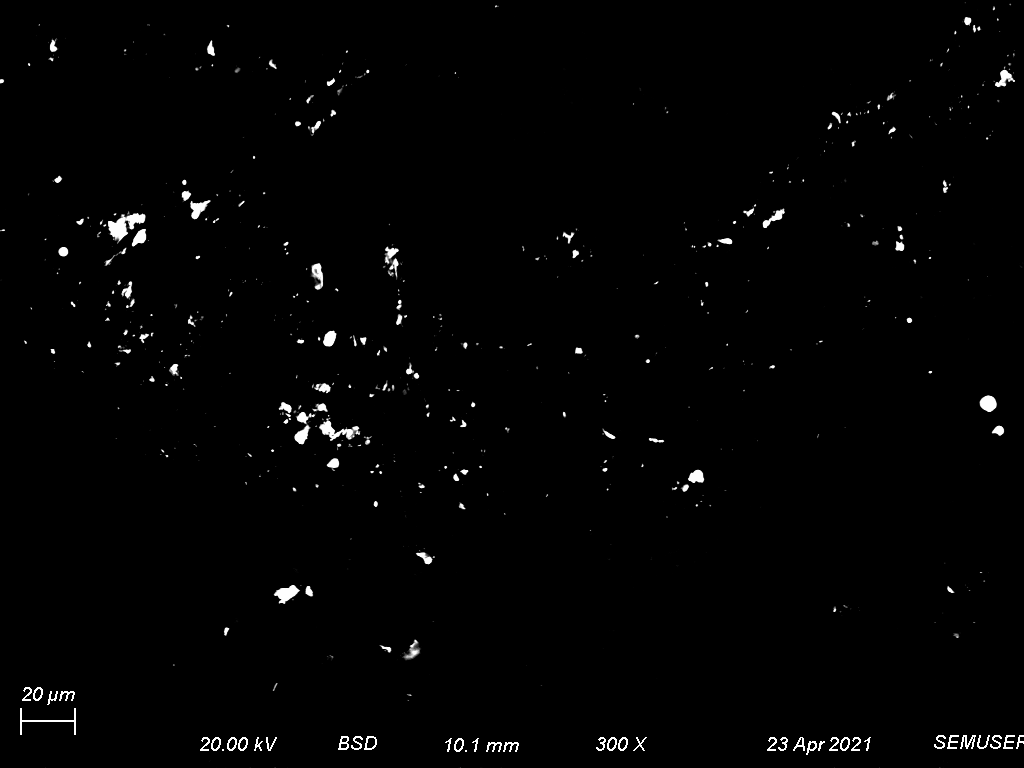
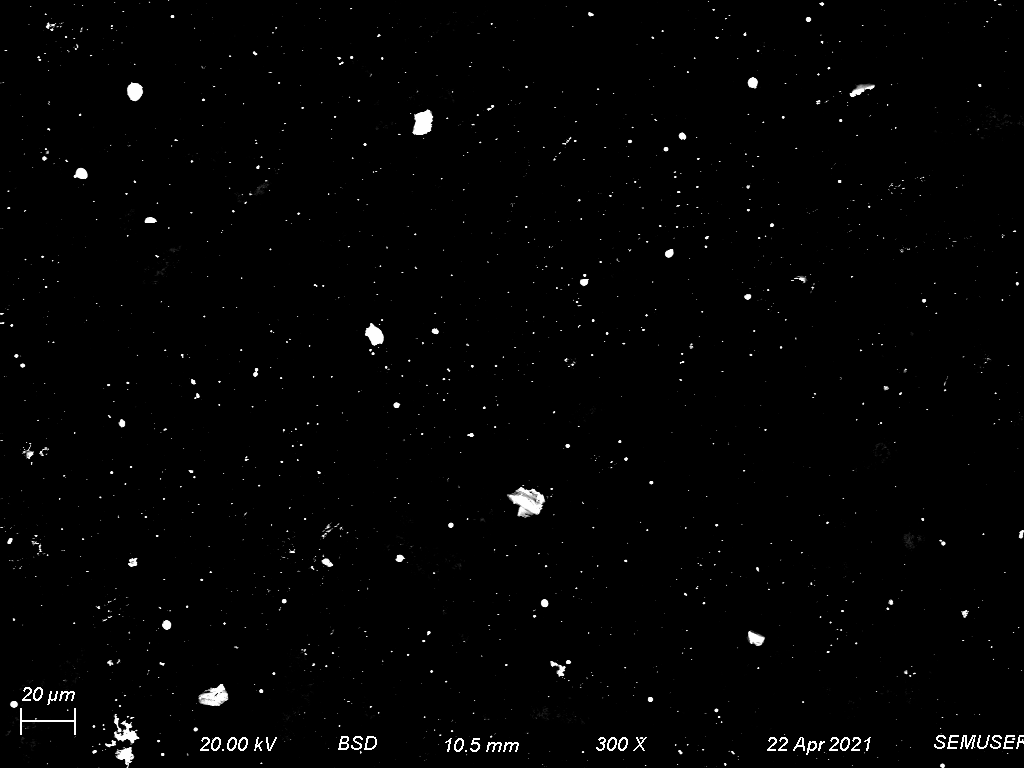 Figure 19. GSR on first iteration of printer paper (dmuzzle = 1 ft, dhole = 0.0 mm).
 |
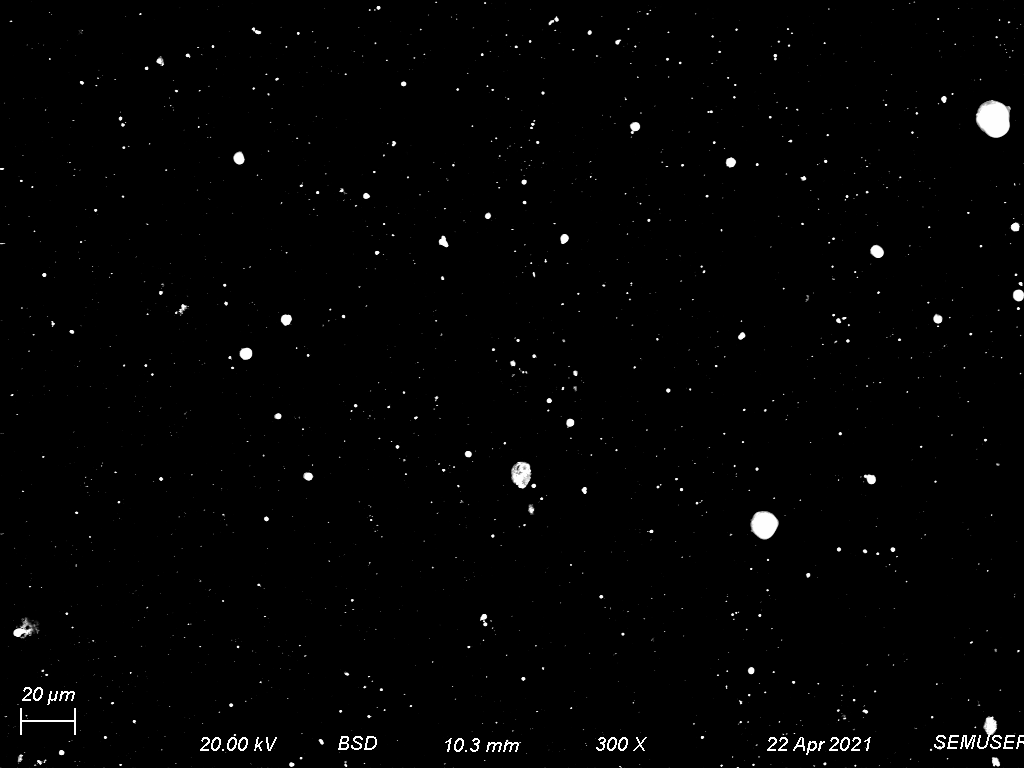
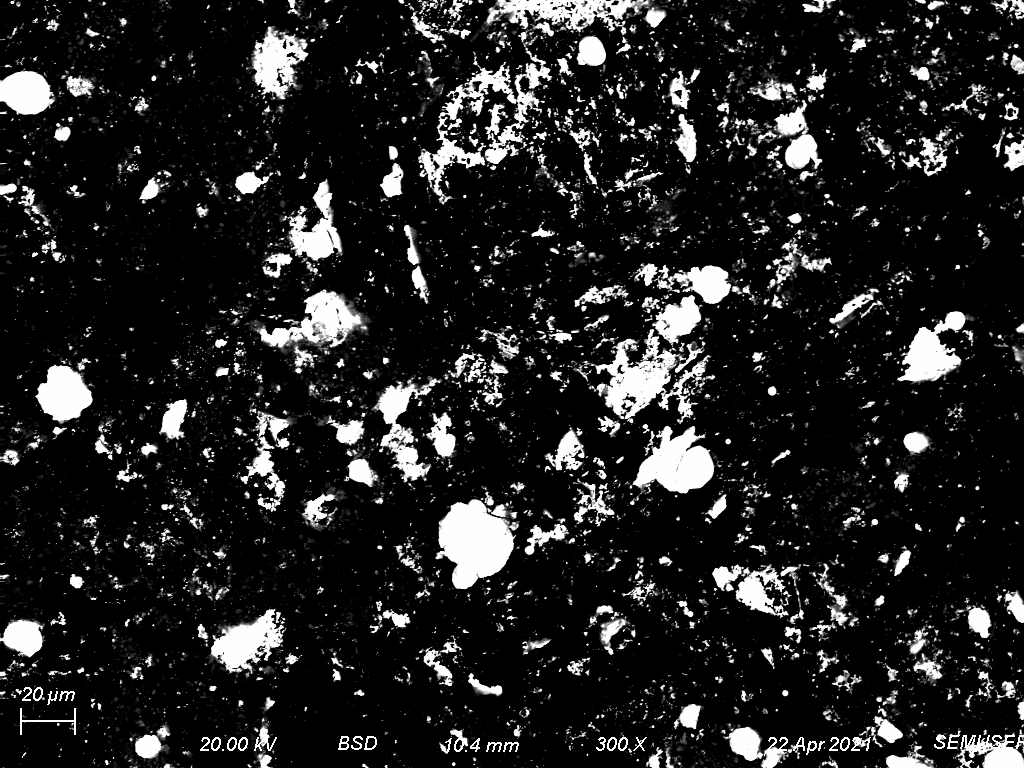 Figure 20. GSR on second iteration of printer paper (dmuzzle = 1 ft, dhole = 0.0 mm).
 |
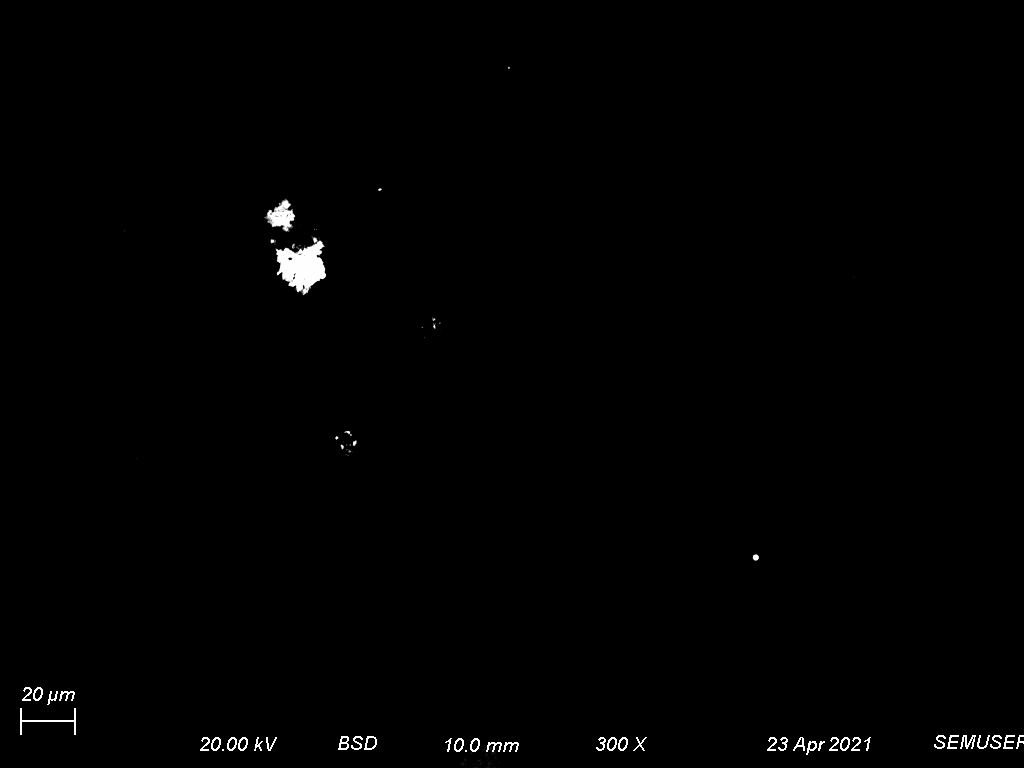
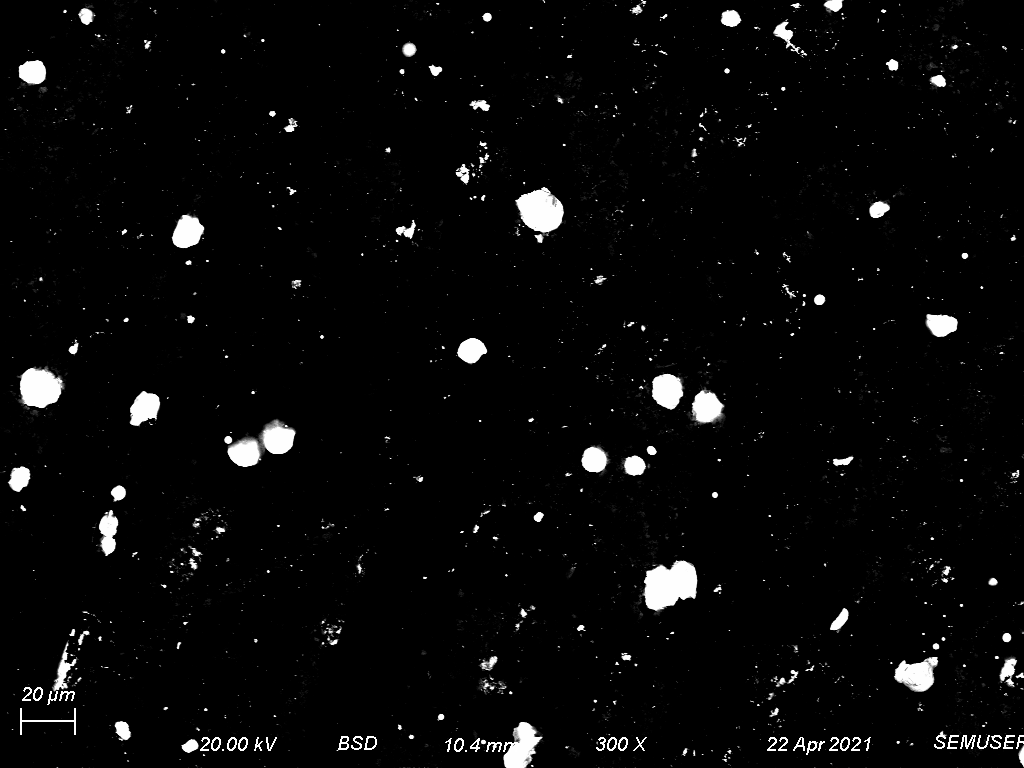 Figure 21. GSR on third iteration of printer paper (dmuzzle = 1 ft, dhole = 0.0 mm).
 |
The variability here, particularly with the second iteration, could be attributable to the fact that a round of ammunition, or the way in which the gun fires, varies such that the GSR particle density correspondingly varies. However, the large disparity seen in just one sample might be better explained as the arbitrary selection of an area within a sample; this selection ideally would be representative of that sample surface's average GSR distribution, yet this approach is subject to human estimation during the image collection.
(ii) Variability Across Distance from Gunshot Hole:
From one of the pages from the prior test (Figure 20), where the gun was fired 1 ft away, there were three strips of paper cut out: at the gunshot hole, 1.5 mm away from the hole, and 3.0 mm away from the hole.
|
Table 2. GSR Particle Density Printer Paper Sample (dmuzzle= 1 ft) by Distance from Gunshot Hole
| dhole = 0.0 mm |
dhole = 1.5 mm |
dhole = 3.0 mm |
| 7.81 · 10-3 particles/µm2 |
3.61 · 10-3 particles/µm2 |
3.87 · 10-3 particles/µm2 |
|
Figure 19. GSR on the first iteration of printer paper (dmuzzle = 1 ft, dhole = 0.0 mm). |
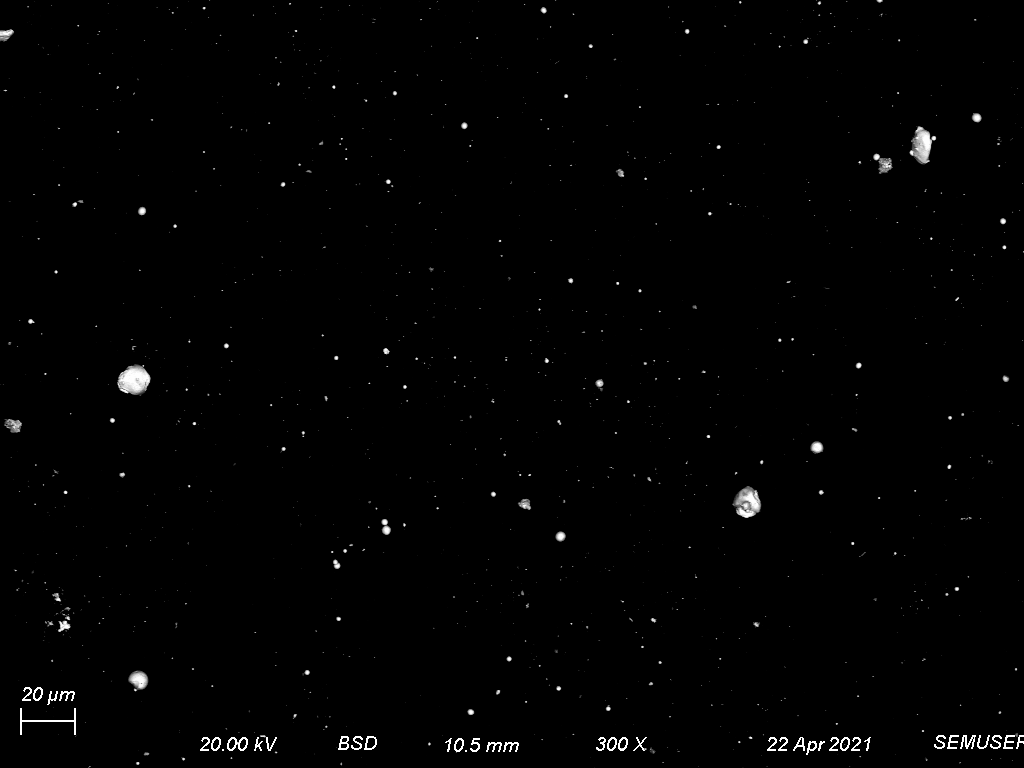 Figure 19(b). GSR on same printer paper at dhole = 1.5 mm.
 |
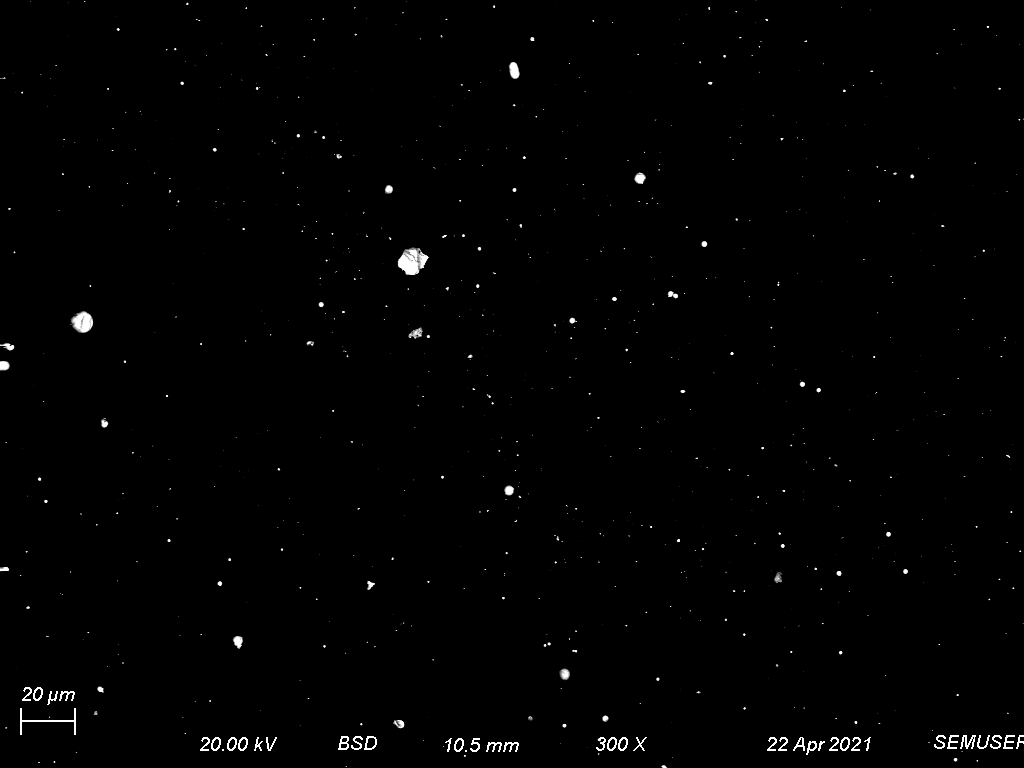 Figure 19(c). GSR on same printer paper at dhole = 3.0 mm.
 |
While there is a notable decrease in GSR particle density from dhole of 0.0 mm to 1.5 mm, there was no significant difference between 1.5 mm and 3.0 mm. In fact, the trend was slightly opposite of what was expected, although this is more likely attributable to variability of particle density within specific regions of a sample.
(iii) Overall Variability Across Surfaces and Distances From Muzzle:
It's important to restate that this type of quantitative GSR comparison is arbitrary, as seen by the Silicon sample at dmuzzle = 1 ft. This human error highlights the subject nature of selecting a region as "representative" for an image to be used in particle counting.
|
Image Matrix of GSR Particle Density Across All Sample Surfaces and Distances From Muzzle
|
dmuzzle = 1 ft |
dmuzzle = 3 ft |
dmuzzle = 5 ft |
| Printer Paper (dhole = 0.0 mm) |
|
 |
 |
| Hydrocarbon Paper |
 |
 |
 |
| Silicon |
 |
 |
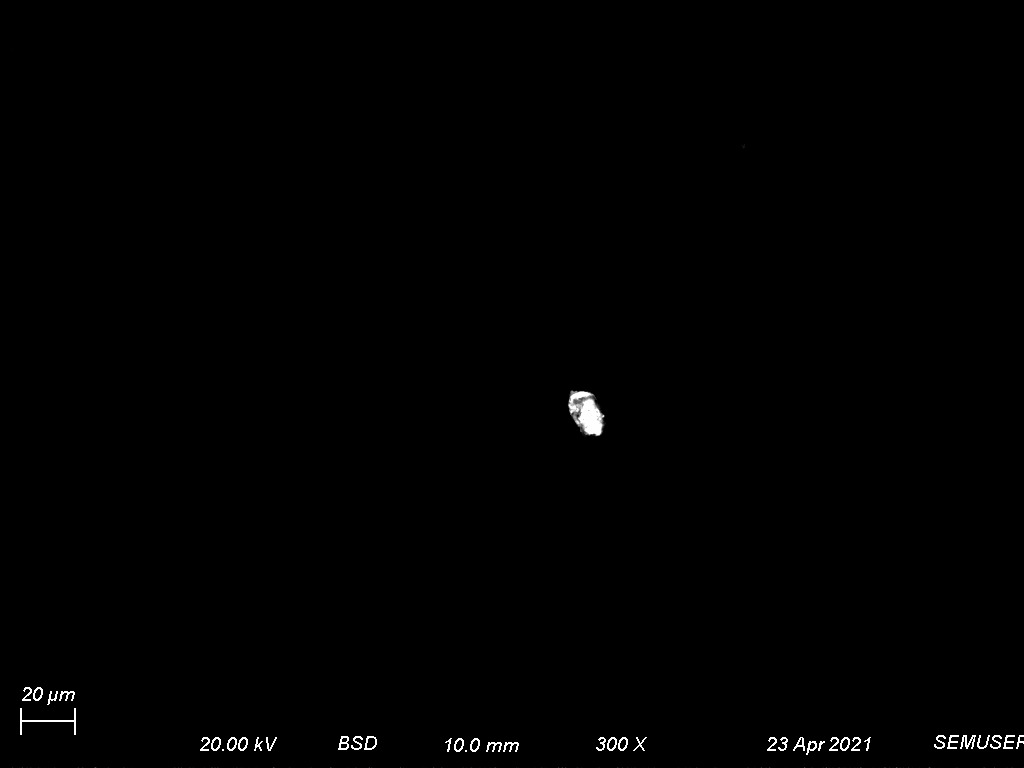 |
Table 3. GSR Particle Density Across All Sample Surfaces and Distances From Muzzle
|
dmuzzle = 1 ft |
dmuzzle = 3 ft |
dmuzzle = 5 ft |
| Printer Paper (dhole = 0.0 mm) |
15.7 · 10-3 particles/µm2
(Avg. of 3 iterations) |
3.40 · 10-3 particles/µm2 |
0.181 · 10-3 particles/µm2 |
| Hydrocarbon Paper |
5.93 · 10-3 particles/µm2
(dhole = 2.5 mm) |
1.15 · 10-3 particles/µm2
(dhole = 3.0 mm) |
0.861 · 10-3 particles/µm2
(dhole = 1.2 mm) |
| Silicon |
30.4 · 10-3 particles/µm2
(dhole = 2.7 mm) |
2.18 · 10-3 particles/µm2
(dhole = 2.0 mm) |
30.2 · 10-6 particles/µm2
(dhole = 3.0 mm) |
| From this data, as dmuzzle increases, there is less particle density if within the same sample type — even despite variations of dhole. However if dmuzzle is held constant, there are inconsistent trends regarding which surfaces have greater particle density.
|