Tissue chips simulating the human blood brain barrier
and the immune system are studied in the McGrath Lab. In this project, I
imaged samples provided the McGrath Lab to how the endothelial and
pericytic cells interacted with the membrane of the chip.
The following methods were used used in this project:
ethanol ladder dehydration, critical point dehydration, gold sputter
coating, Scanning Electron Microscopy (Secondary Electron and InLens
secondary electron), and focused ion beam (FIB)
2. Methods
The sample were fixed before I received them from the McGrath lab. Apon
receiving them, they were rinsed with DI water then place in a solution
of 50% ethanol water. The ethanol ladder dehydration sequenced continued
with 60%, 70%, 80%, 90%, 100% ethanol solutions for an hour with each
step then the sample was left in fresh ethanol overnight.
The sample were dried next with the Tousimis PVT-3B Critical Point
Dryer. The sample chamber of the critical point dryer filled with 100%
ethanol. The sample was placed in the sample holder, then transferred
the into the ethanol. The chamber temperature was decreased from room
temperature to about 0°C within a couple minutes. The ethanol was
purged at the same rate as the CO₂ inlet rate. The excess ethanol
was collected until only CO₂ gas was being expelled. The chamber was
then filled with liquid CO₂. Afterwards. the temperature and
pressure were increased to approximately 31°C and 1,070 psi
respectively. This state was maintained for four minutes. The chamber
was decompressed slowly at around 100 psi per minute. Once finished,
the sample was removed.
The sample stub was placed on the stage inside the bell jar if the
Denton Vacuum DESK-II DC Sputtering System. The chamber pressure was
decreased to approximately 100 mTorr. The chamber was then backfilled
with argon gas to raise the pressure to approximately 300 mTorr, then
decreased to 150 mTorr. Repeat this gas cycling three times then
pumped down about 50 mTorr. A current of 15 mA was run through the
cathode for 60 seconds depositing gold layer of approximately 60 Å.
3. Results & Discussion
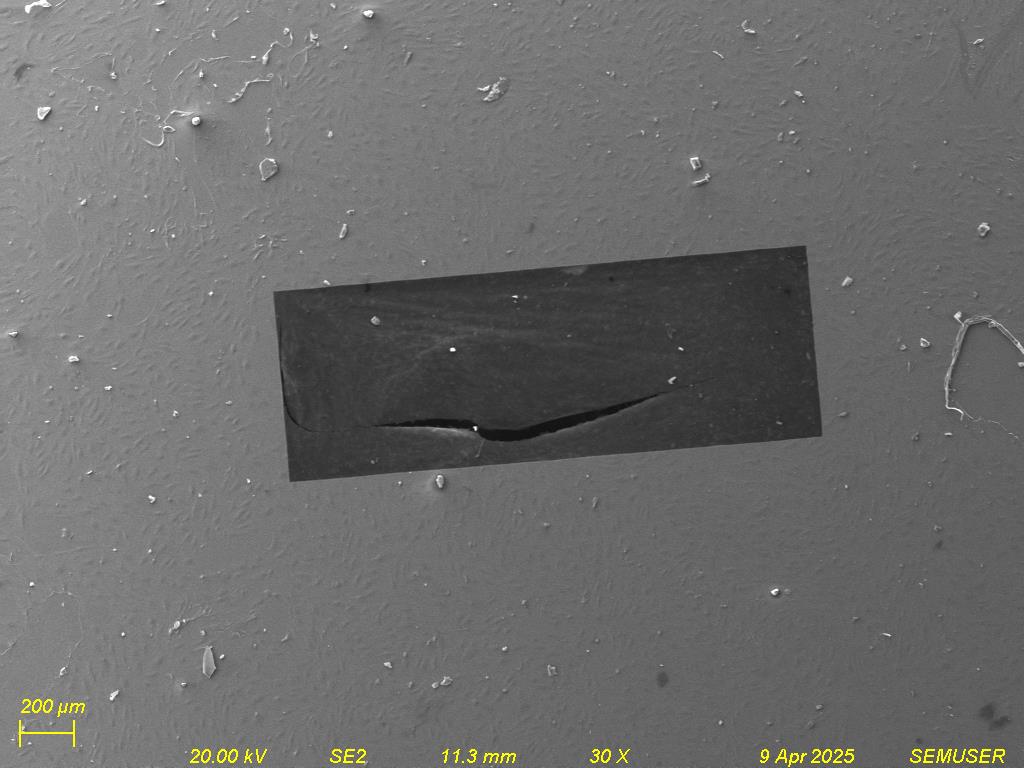
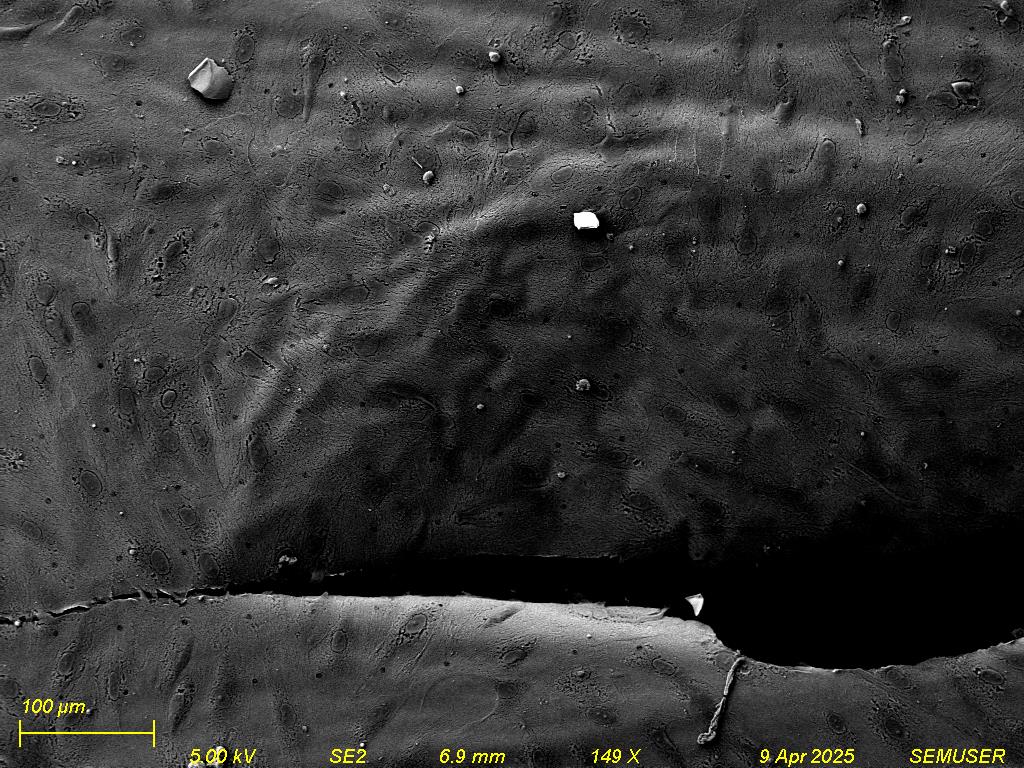
3.1 Surface of the chip
Although every sample was meticulously dried following procedures to
preserve the bioligical stuctures, the images show the structure have
degraded. This can be seen in the images as the extracellular matrix have
peeled away from the chip and pulling away from the nucluei.
Figure 1 - Secondary electron images at
an accerating volatage of 5kV at 30x magnification (left) and 149x
magnification (right).
The sample is a nanoporous silicon nitride membrane,100nm thick, with a 1
μm layer of endothelial cells on one side and 1 μm layer of pericytic
cells on the other side. The endothelial and pericytic cells touch through
the openings in the microporous portions of the membrane. This chip
replicates the barrier in the brain that permits small molecules in and
out. Figure 1 shows the overall structure of the chip. The nuclei of the
brain endothelial cells appear as the dark spots on the membrane.
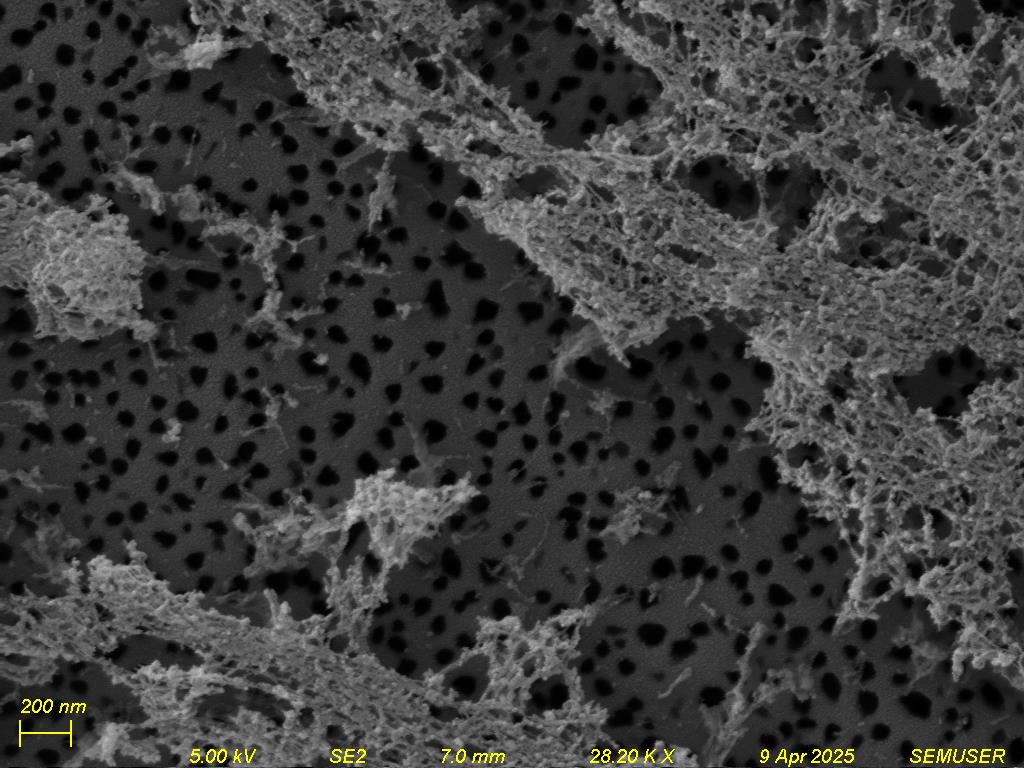
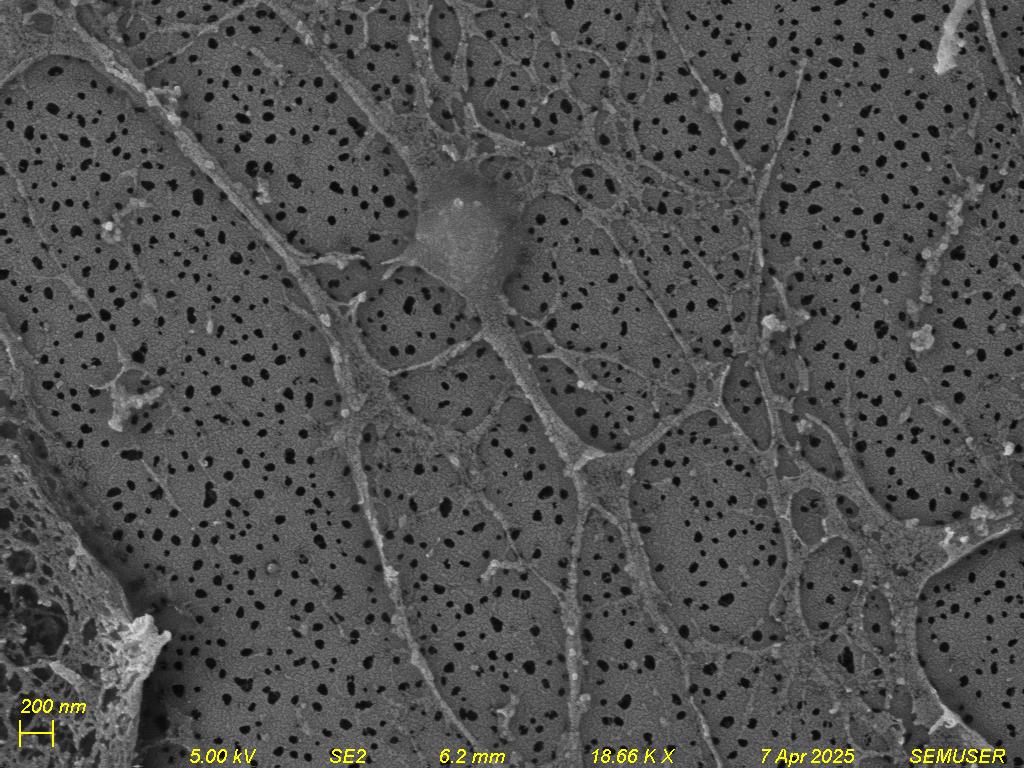
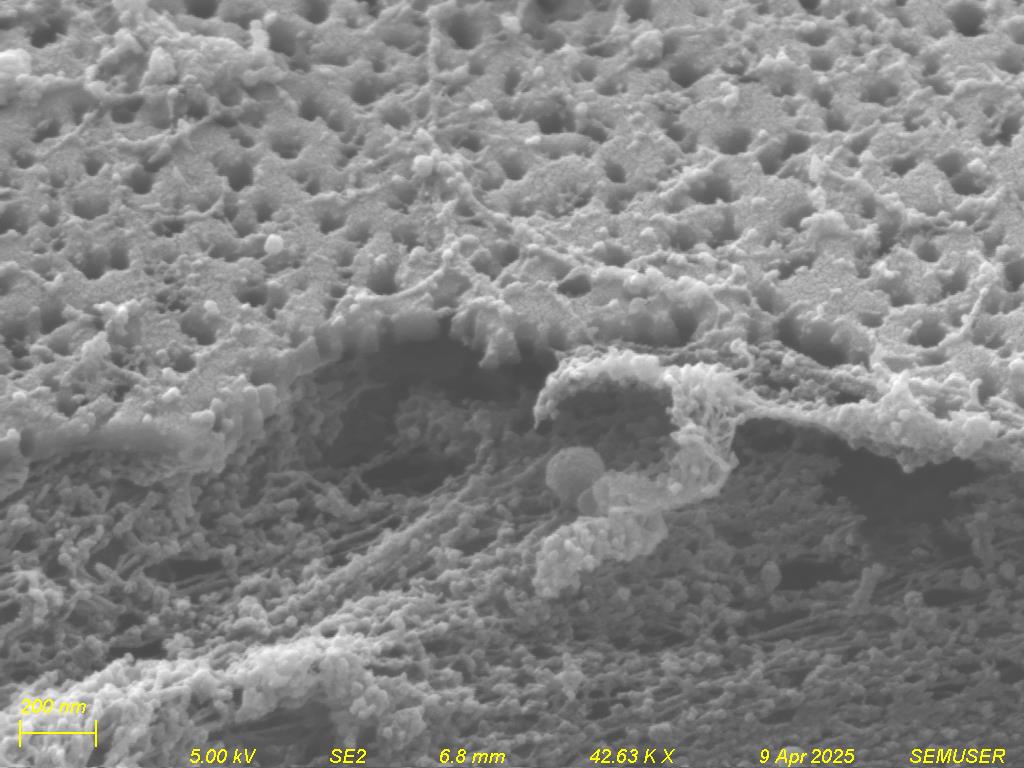
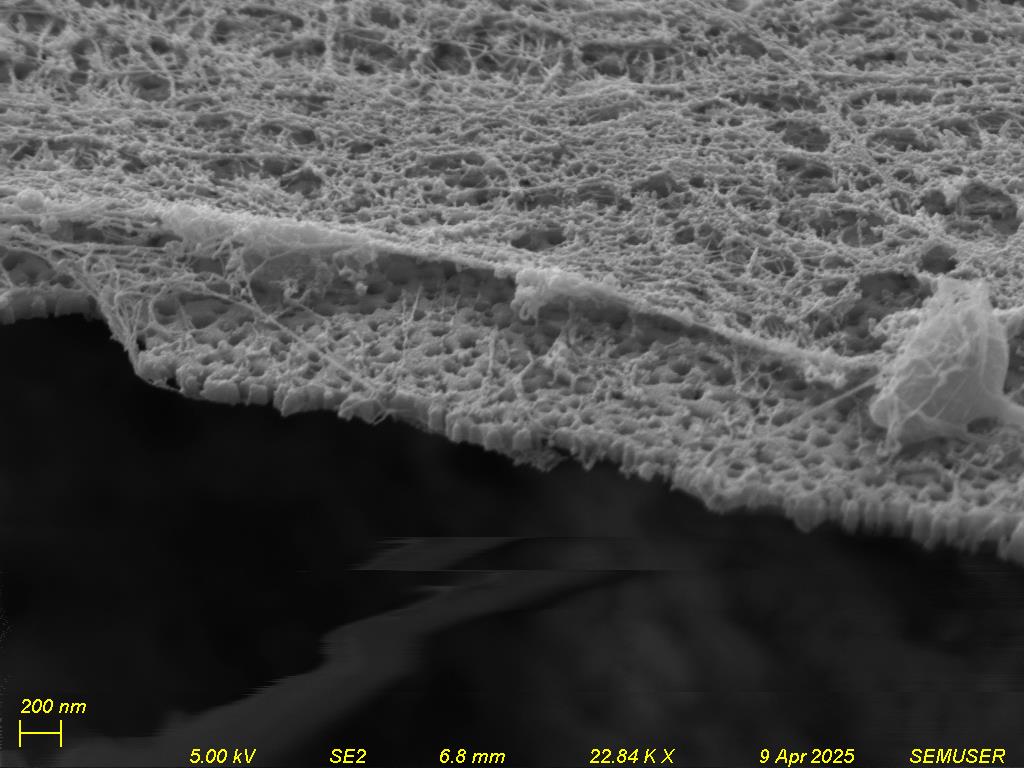
Figure 2 - Secondary electron Images at
an accerating volatage of 5kV at 28.20Kx magnification (left) and
18.66 Kx magnification (right).
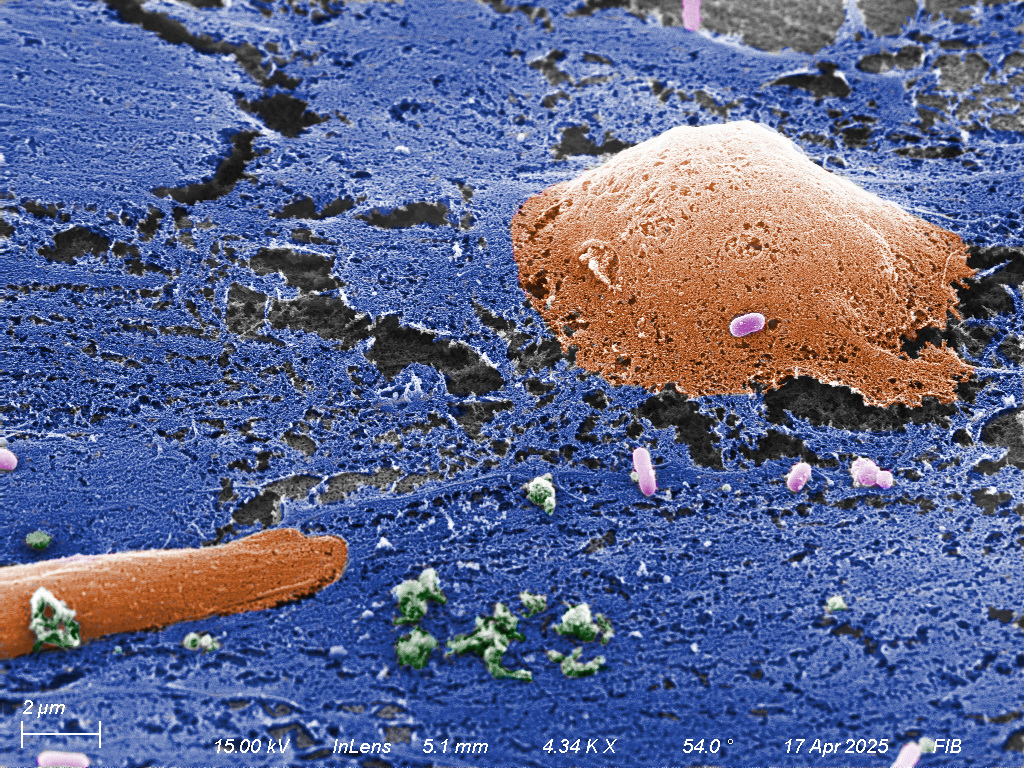
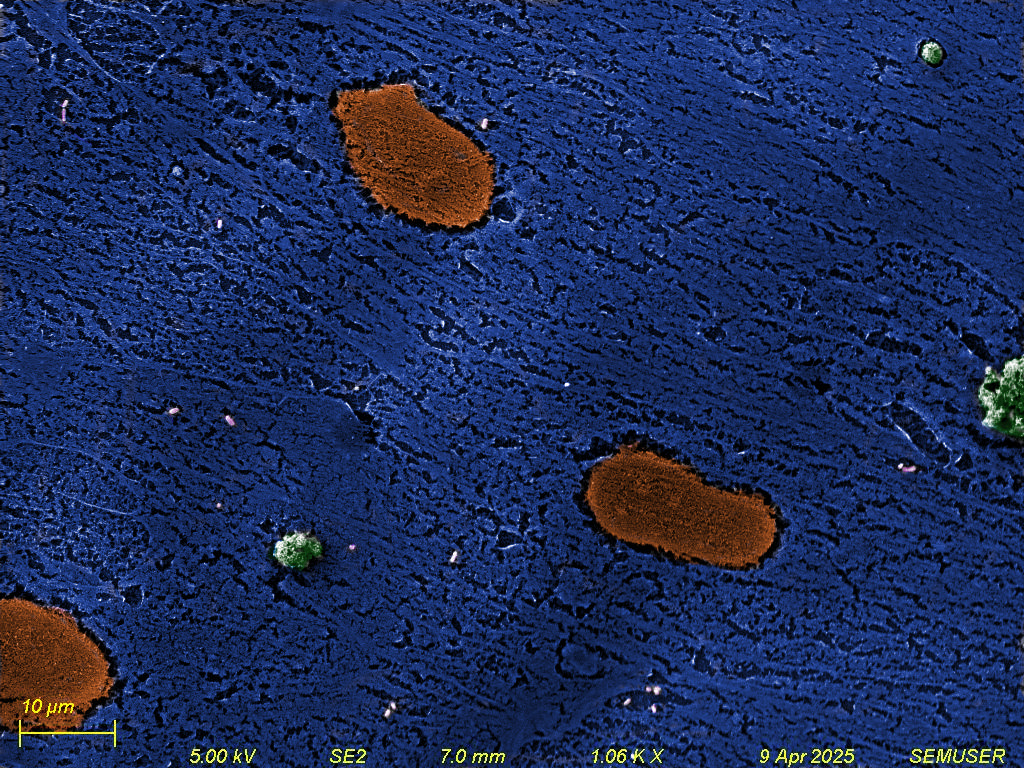
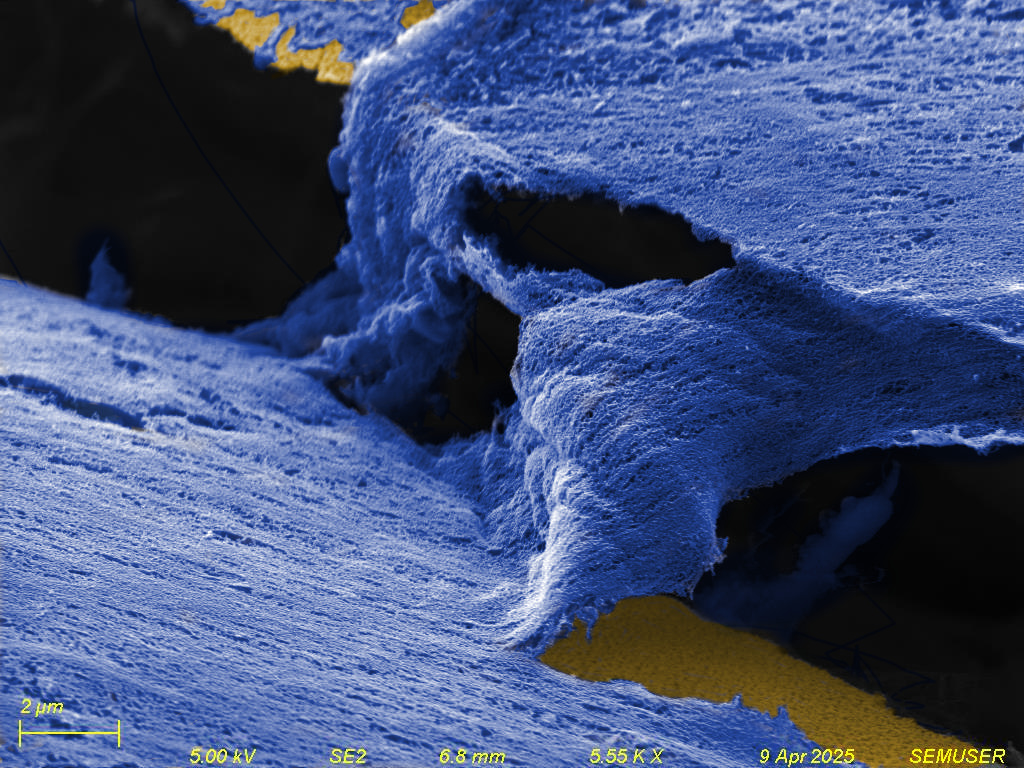
Figure 3 - Secondary electron images at
an accerating volatage of 5kV at 4.34Kx magnification (left) and
1.06Kx magnification (right).
The images with false color highlight the different features on the
sample. The blue is the extra cellular membrane. The orange is the nucleus
of brain endothelial cells. The pink is some type of bacteria cell.
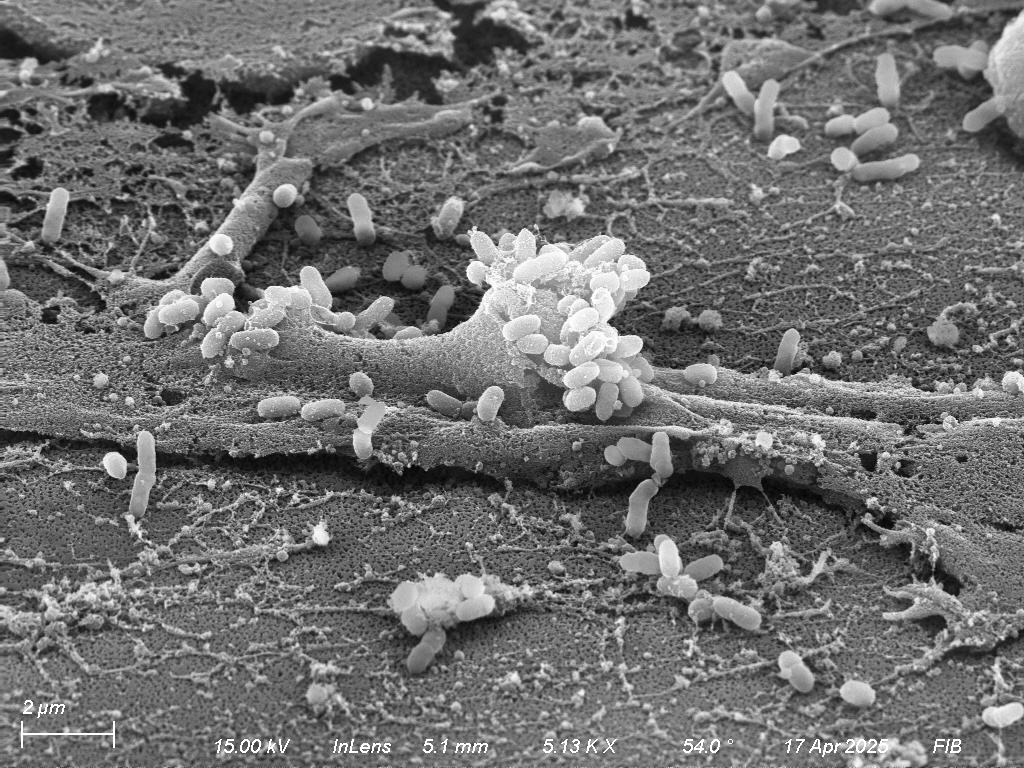
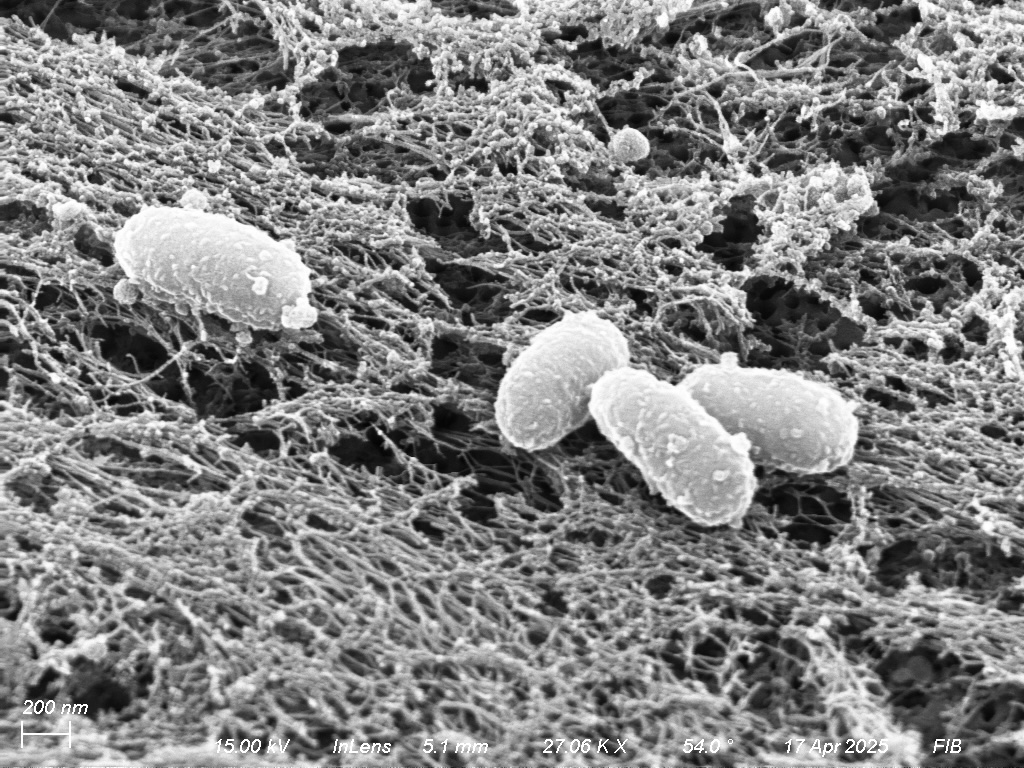
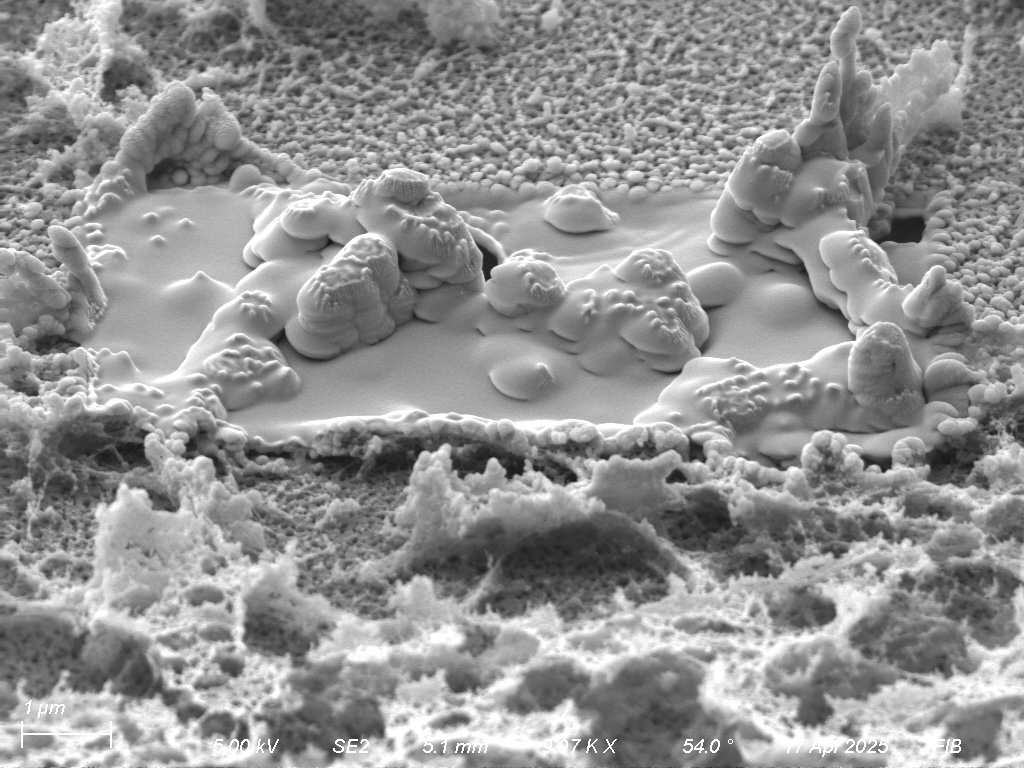
Figure 4 - InLens images of bacteria
cells at an accerating volatage of 15kV at 5.13Kx magnification
(left) and 27.06Kx magnification (right).
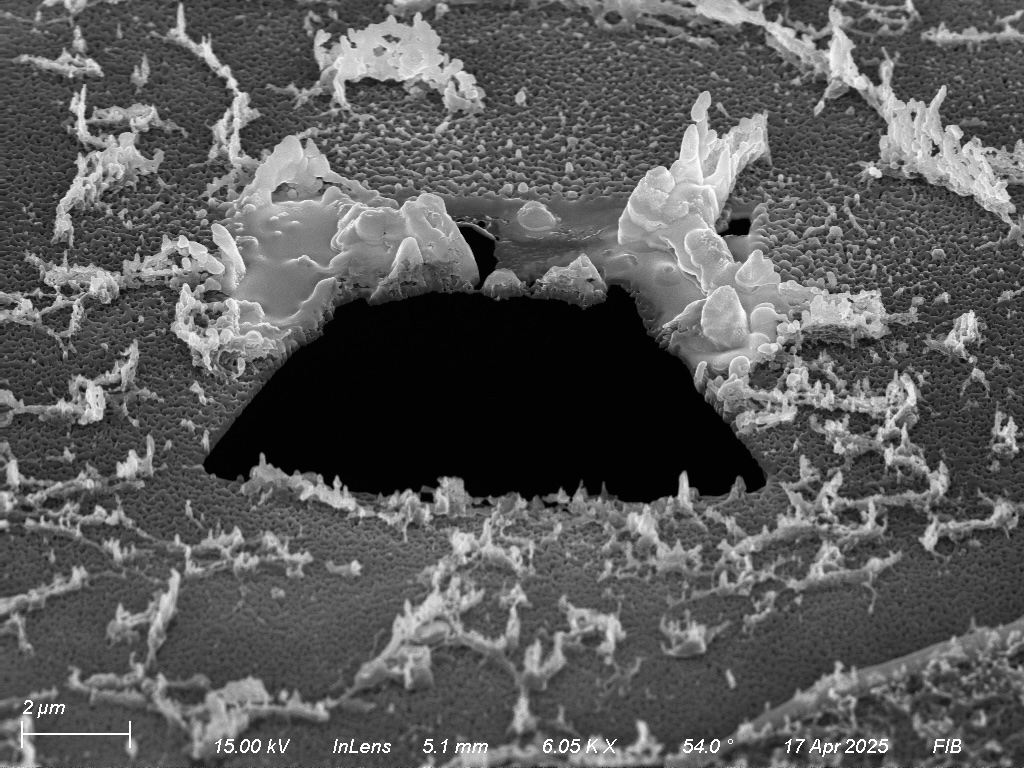
3.1 Cross-Section