Abstract
In this project, the microstructural features of natural zircon crystals were investigated using optical microscopy and electron beam techniques. The collected data was used to create high-resolution, web-viewable mosaics of individual crystals as well as provide mineralogic constraints on the inclusions within zircons. A workflow for fracture network analysis was developed and tested on micrographs of a gold sputter coating.
Introduction
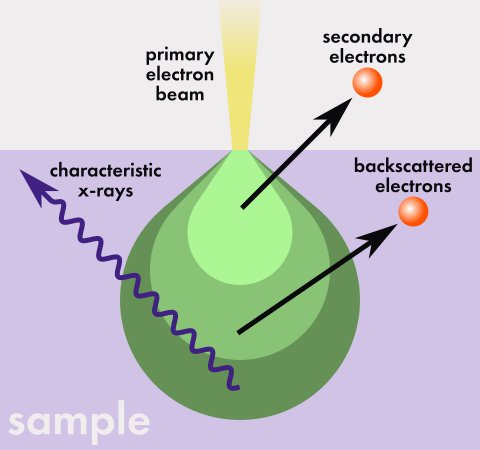
When an electron beam strikes a sample, a variety of signals are generated. This project investigates three signals emitted from small crystals of the mineral zircon. Secondary electron (SE) imaging reveals fracture networks within individual crystals at high resolution. Backscattered electron (BSE) imaging provides phase contrast, emphasizing included phases. Characteristic x-rays allow for compositional analysis and elemental mapping via energy dispersive spectroscopy (EDS), ultimately enabling inclusion identification. Zircon is a common accessory mineral in many geologic systems; its physical and chemical resilience and trace element profile makes it an ideal tool for geochronology and other petrologic studies. The zircons in this study are from the Jack Hills of Western Australia. Though undated, they are part of the same population of zircons that represent the oldest terrestrial material, with a maximum age of 4.4 Ga [1]. These unique samples are best served by multimodal studies; this project seeks to combine multiple electron beam techniques to build a more comprehensive understanding of the population.
Methods
Sample Preparation
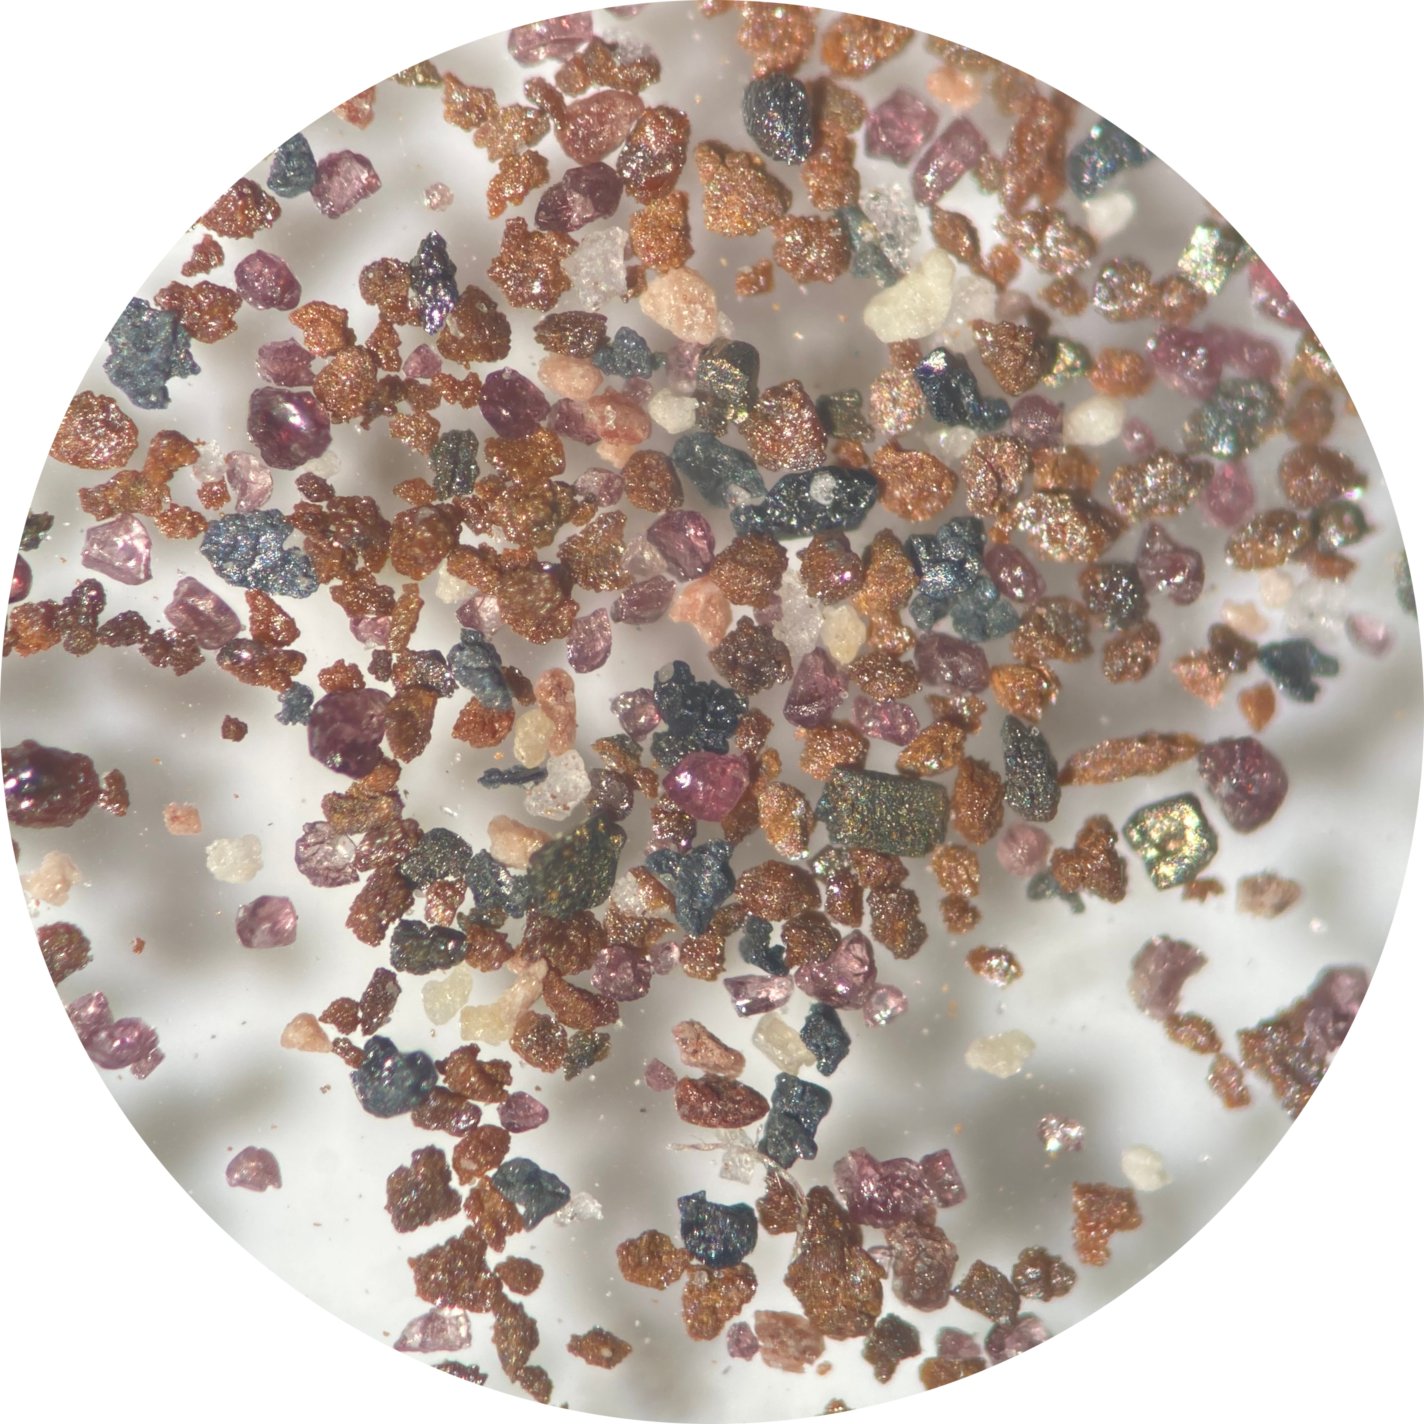
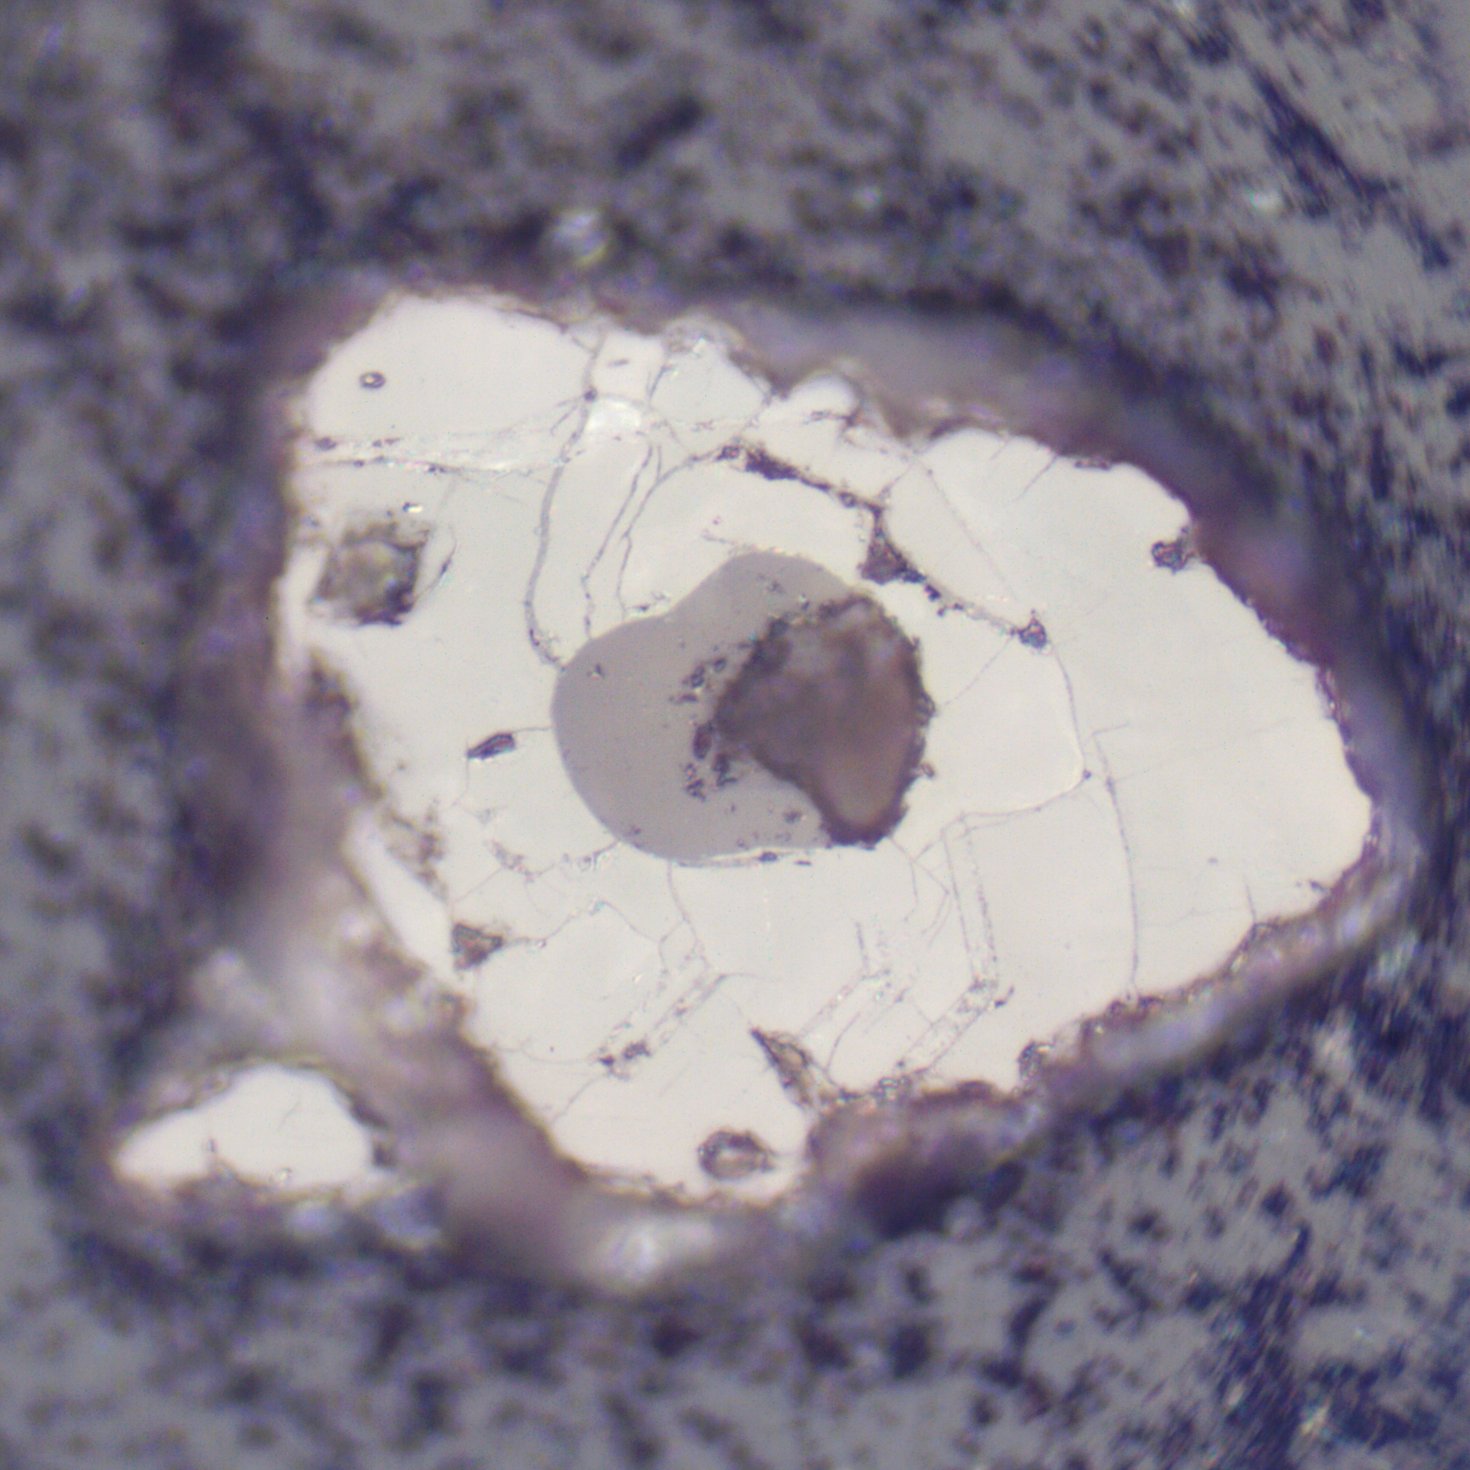
Careful sample preparation is a prerequisite to any e-beam study, and is often unique to the particular sample. Prior to imaging, 225 zircons were handpicked from a dish (Figure 2) and placed in a 15x15 grid approximately 10 mm across on double-sided Kapton tape. The zircons were coated with epoxy to make a 25 mm circular mount. This mount was hand polished with successive SiC grits (600 through 1000), polished with 1 micron alumina, and finished with 0.1 micron colloidal silica. (Some of this colloidal silica was left on the surface after polishing, and can be seen in the mosaic SE images.) To prepare for imaging, the mount was sputter-coated with ~20 nm of Pt. The mount was previously coated with ~10 nm of Au, but the surface texture of the gold grains interfered with imaging of fractures and was removed using a solution of KI. In any case, the network of gold grains was imaged and used to build a network analysis workflow, described in a later section. The brilliant white surface of the polished zircon seen under reflected light (Figure 3) indicates an adequate final polish. Even still, many inclusions in the grains were plucked out, likely due to the action of the largest SiC grits during hand polishing.
Imaging Techniques
Three imaging techniques were employed in this study: secondary electron (SE) imaging, backscattered electron (BSE) imaging, and reflected light (RL) microscopy. All SEM images were aquired using the Zeiss Auriga SEM at URnano. Mosaic images were captured using a stage scan. BSE parameters were an accelerating voltage of 20 kV and a working distance of 10 mm. SE parameters were an accelerating voltage of 3 kV and a working distance of 3 mm, this atypical set of parameters allowed for the best fracture contrast. In SE mode, the SE2 Everhart-Thornley detector was used, as the in-lens detector led to contamination squares incompatible with the image stitching process. Images are presented in the Results section.
Compositional Analysis
Energy-dispersive X-ray spectroscopy (EDS) data was captured using an EDAX Octane detector, accelerating voltage 20 kV and working distance 10 mm. Spectra were collected across entire zircon grains and maps were built from approximately 100 frames.
Data Reduction and Interpretation
Composite images were stitched using Microsoft Image Composite Editor. Large-format composite image mosaics were converted to DeepZoom (.dzi) image pyramids with libvips and made web-friendly with OpenSeadragon. Color enhanced phase maps were made in GIMP. Network detection was done with Nefi 2.0 and graph analysis was done with Gephi.
Results
Reflected Light Microscopy
Prior to imaging under the electron beam, 110 reflected light micrographs were stitched together to produce a map of the polished zircons embedded in the epoxy mount. Reflected light allows for phase contrast, distinguishing between zircon (bright white) and included phases (darker colors). This helped in identifying zircons best suited for further analysis (SE for fractured grains, BSE for grains with large inclusions). Though fractures and inclusions are high contrast in this imaging mode, resolution is limited as it is an optical technique. Out-of-focus regions in the collected RL images are due to the lack of a flat-field (plan) objective in combination with limited image overlap when stitching a larger mosaic. The mosaic can be viewed in the DeepZoom section.
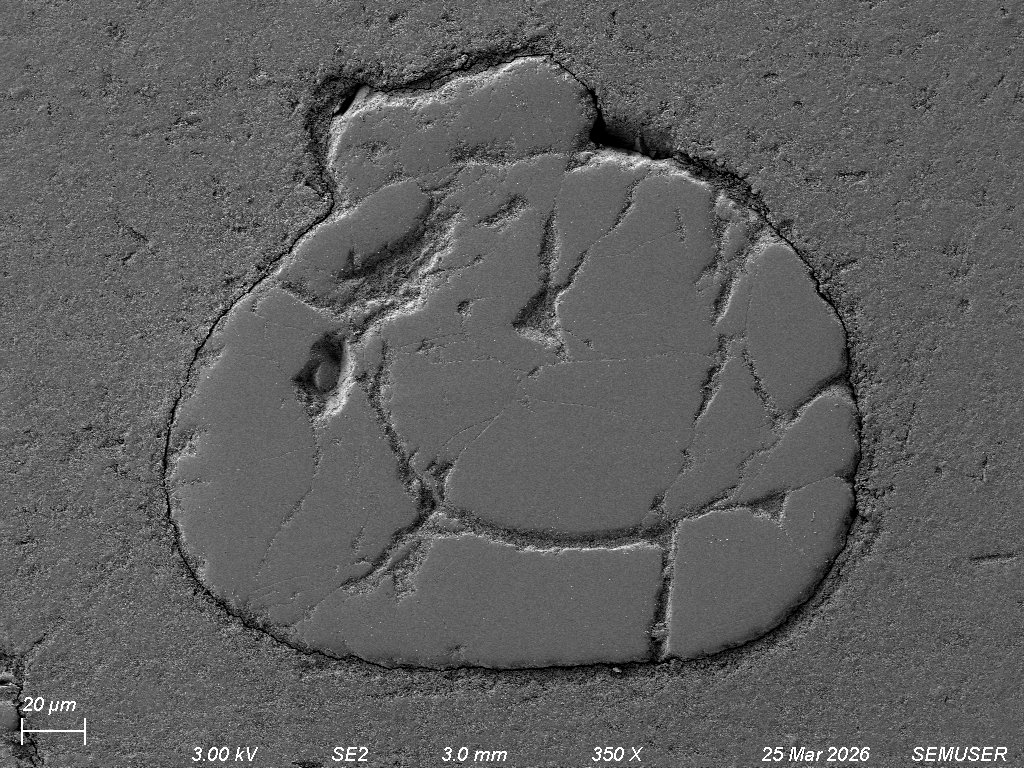
Secondary Electron Imaging
Zircon grains 064 and 122 were selected for secondary electron imaging due to their fine-scale fractures. A mosaic image of grain 064 was captured at 5,000x magnification (110 micrographs), and a mosaic image of grain 122 was captured at 10,000x magnification (672 micrographs). The mosaics can be viewed in the DeepZoom section.
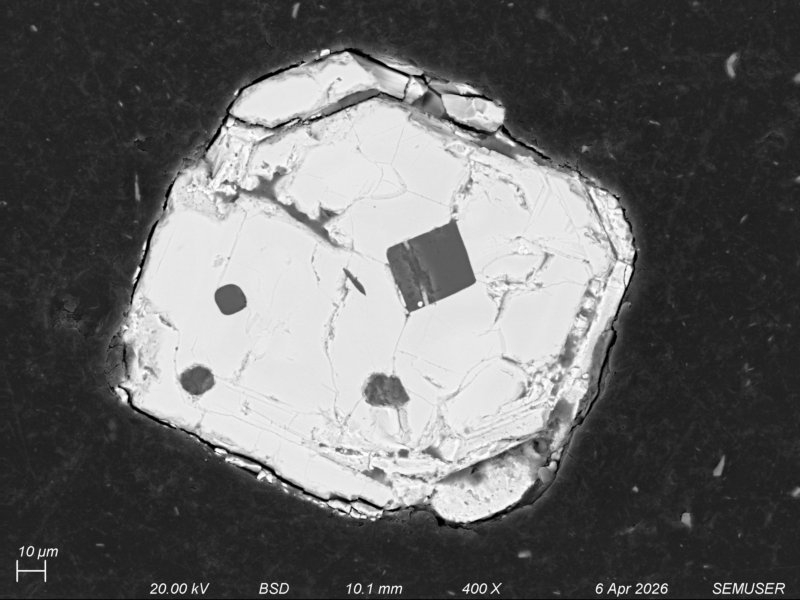
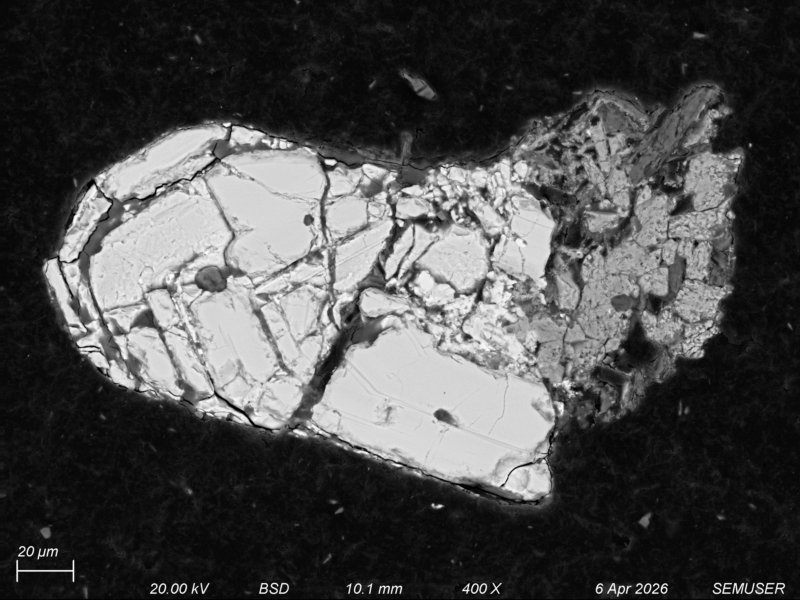
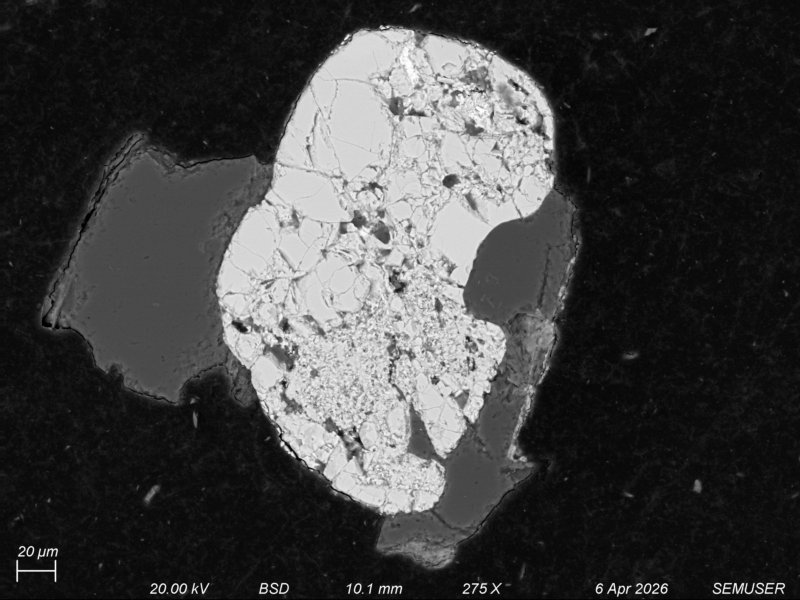
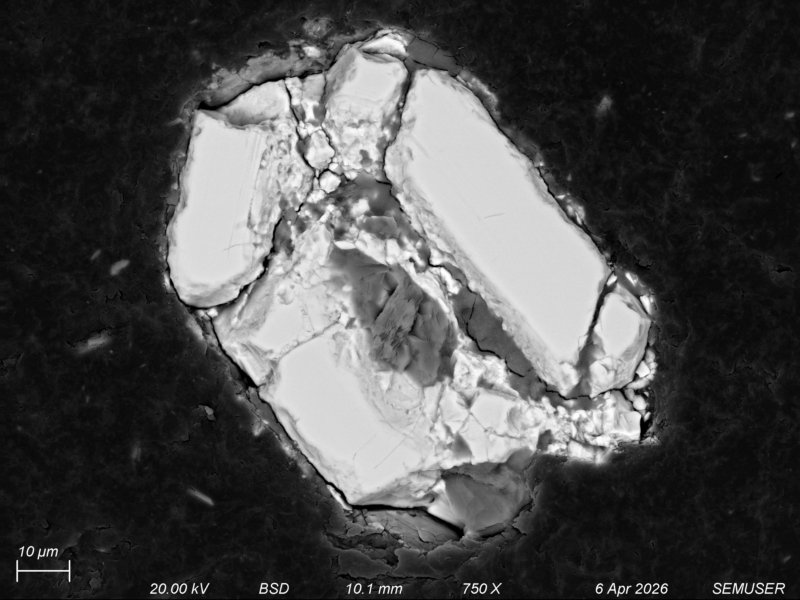
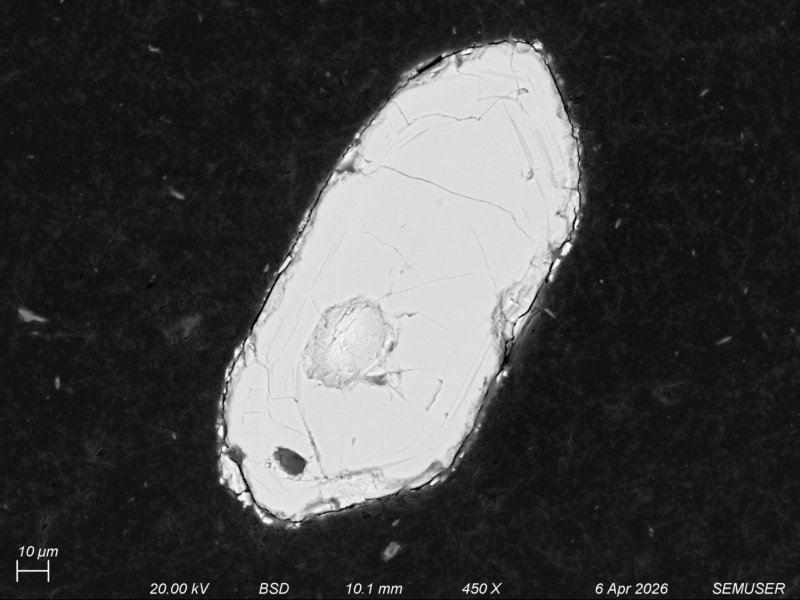
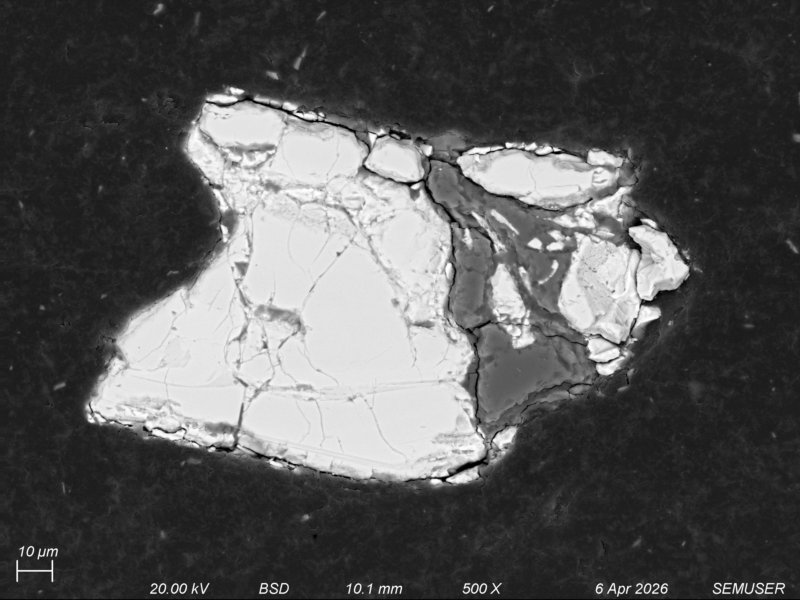
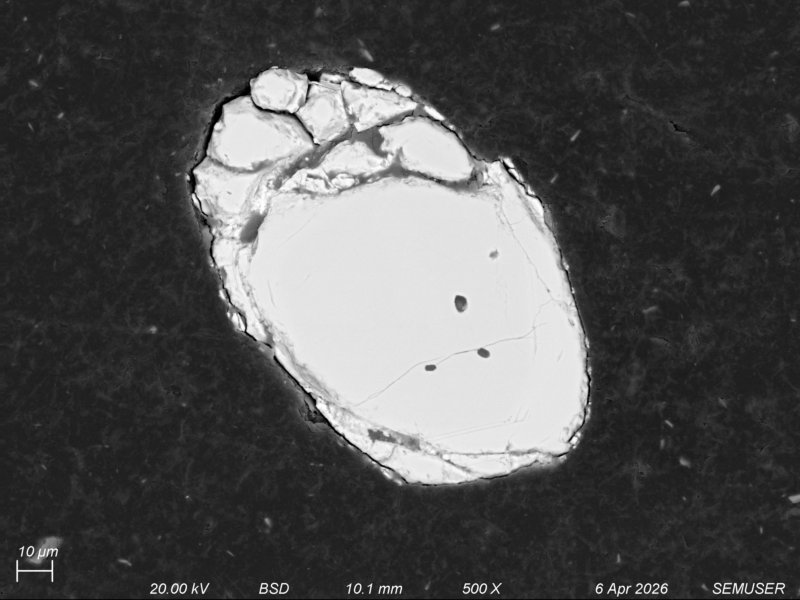
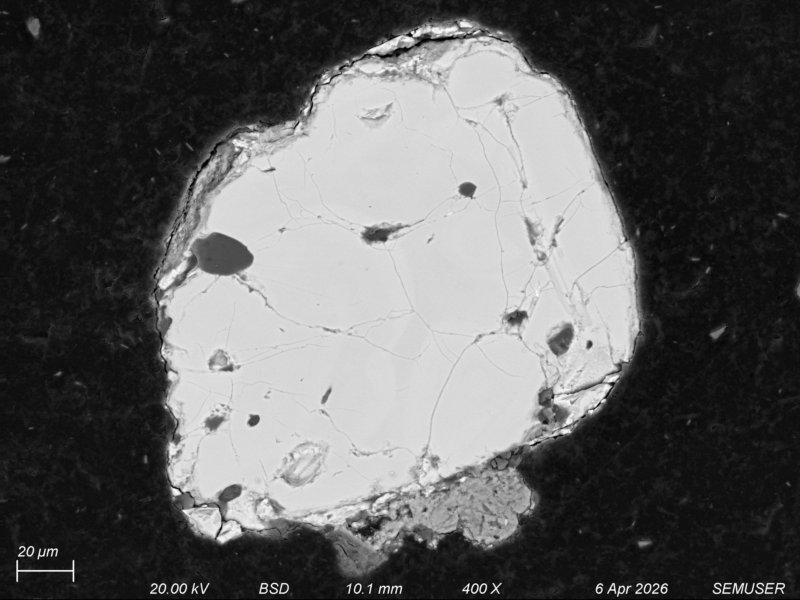
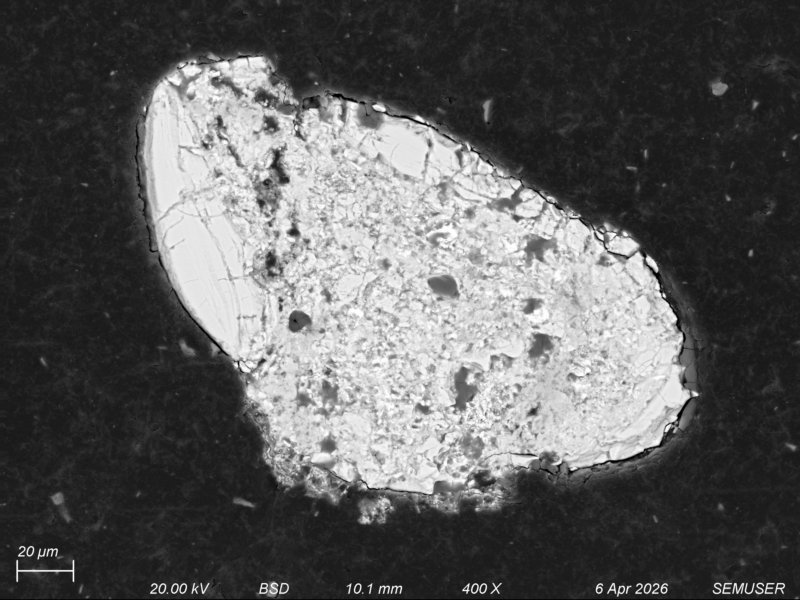
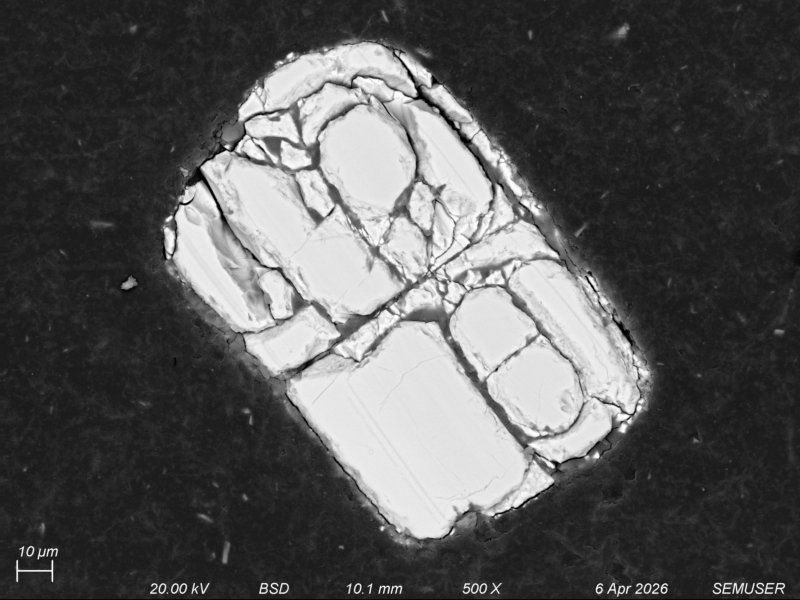
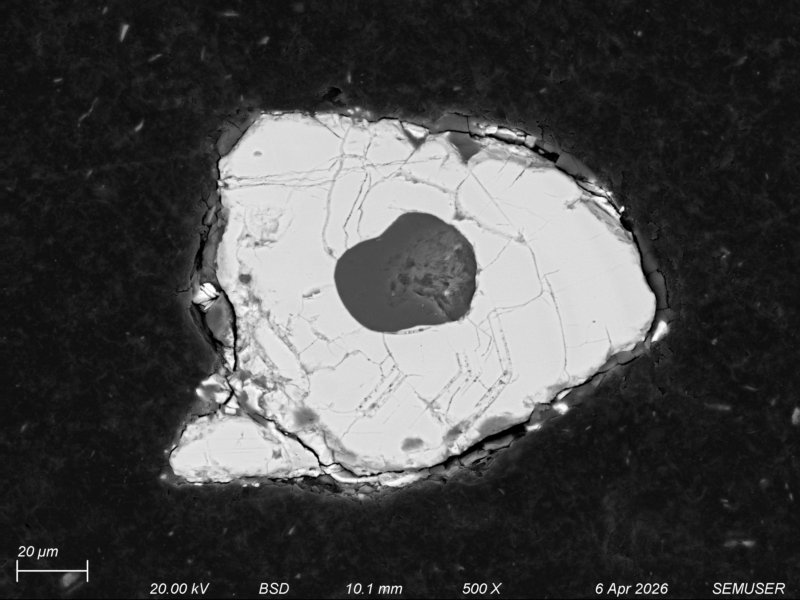
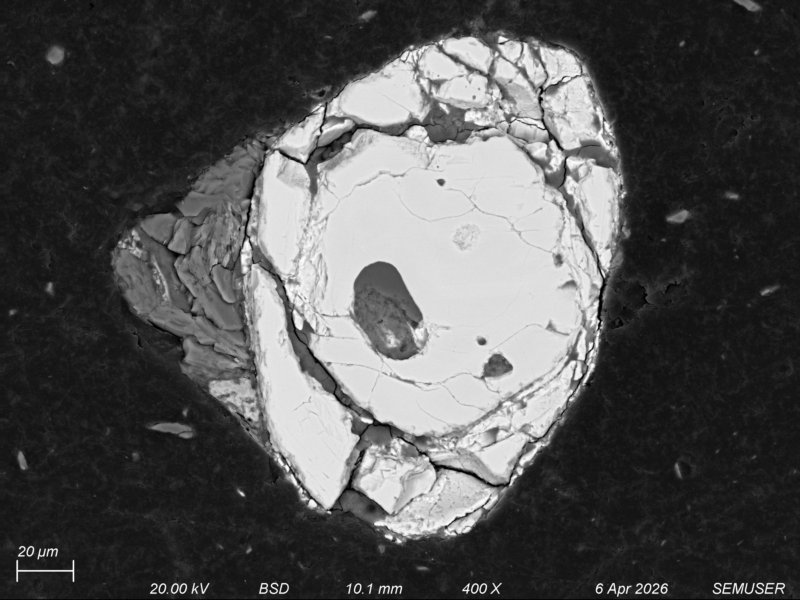
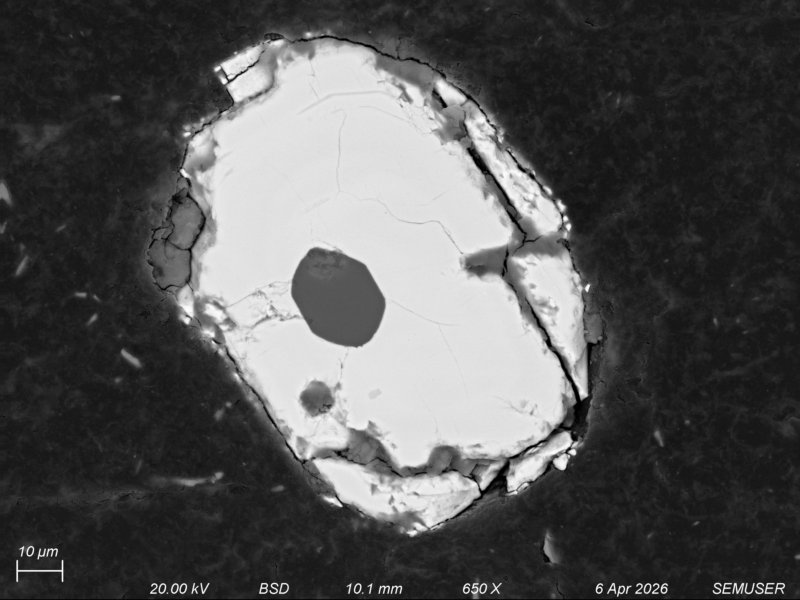
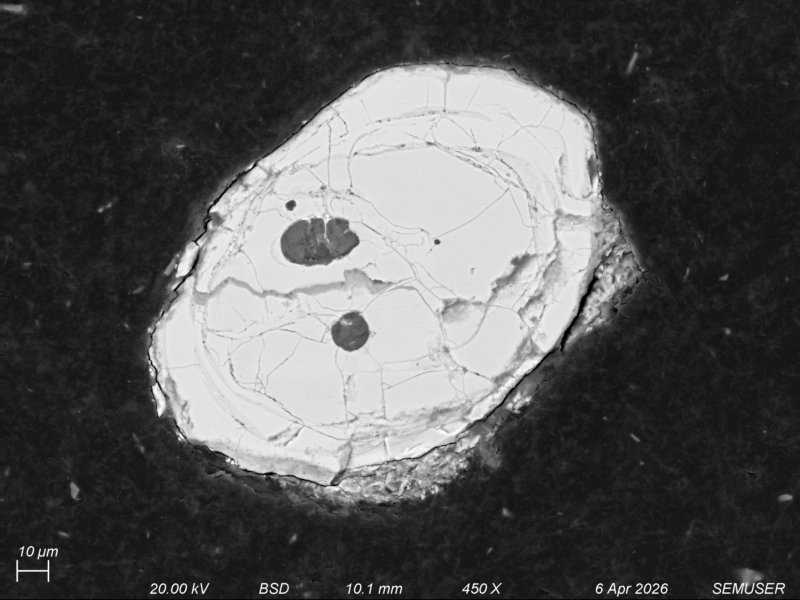
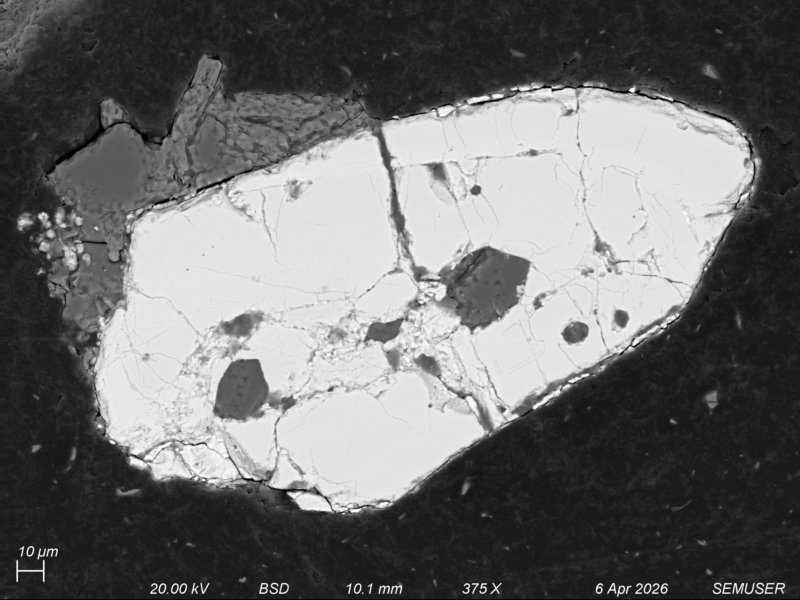
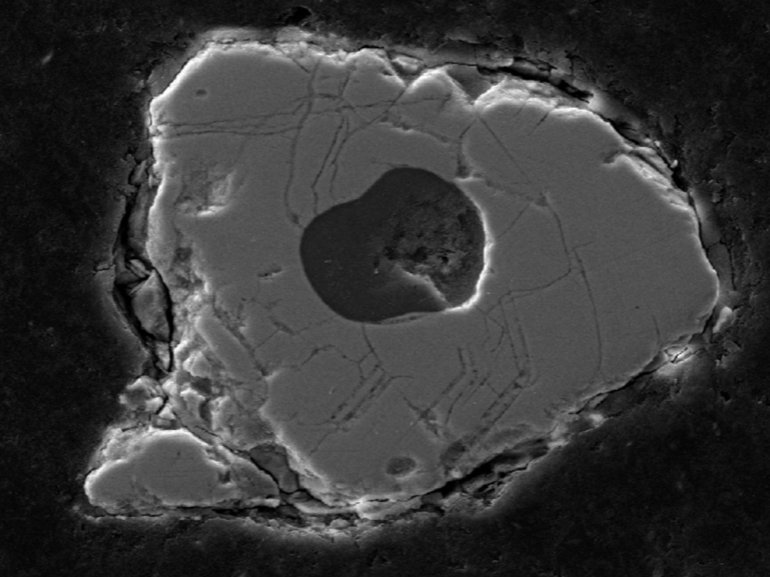
Backscattered Electron Imaging
Mosaicking is not necessary in BSE mode, as inclusions are much larger than the width of fractures. Therefore, more zircons could be imaged in this mode (17 in total). While not a truly representative sample, the BSE images collected show muttiple different inclusion morphologies, and some similarities across grains. Zircon appears bright in BSE because it is much denser than a majority of its commonly included phases; conversely, the organic-based epoxy the zircons are embedded in is less dense and thus appears dark. While BSE provides excellent density contrast, phases of similar density (in this case, the included phases) are difficult to distinguish. These phases can be better distinguished with EDS.
Energy-Dispersive X-ray Spectroscopy
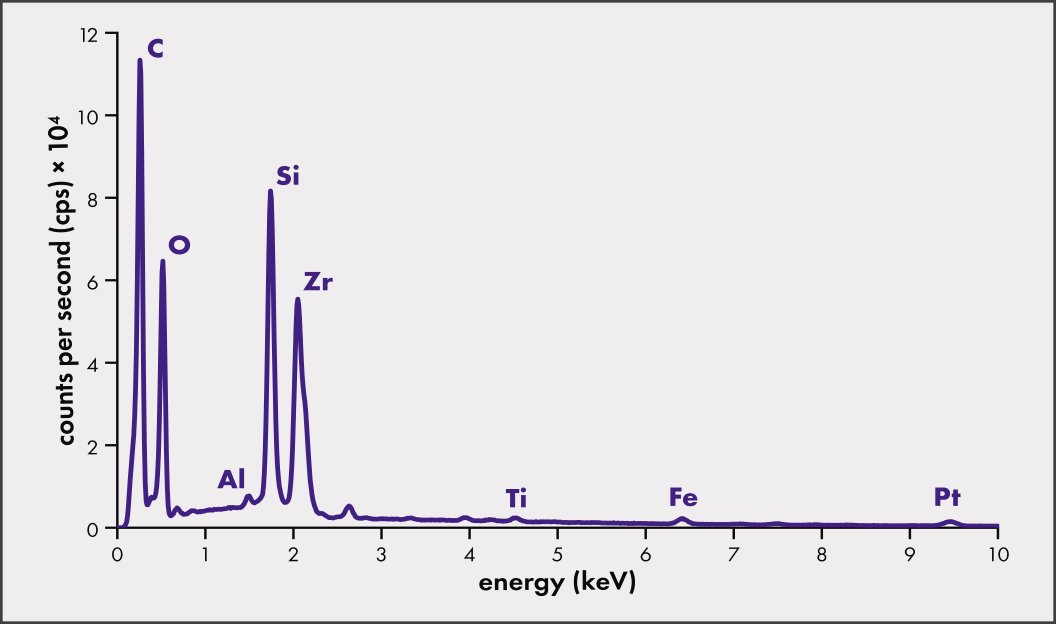
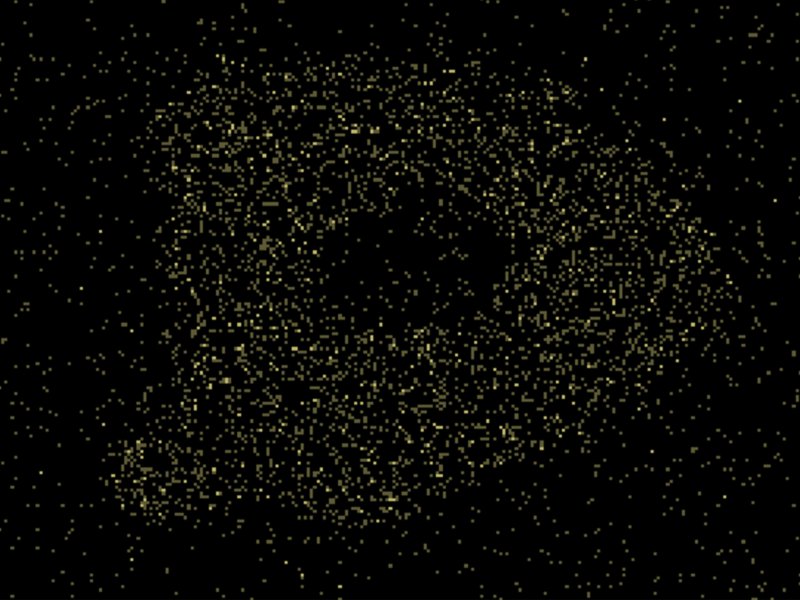
The spectra of 17 zircons were summed to collect a somewhat representative spectrum, shown in the figure below. The Zr, Si, and O peaks are consistent with zircon. The C peak is background from the epoxy mounting medium. Al, Ti, and Fe peaks are from inclusions. Other peaks, including K, P, and Ca are visible in individual grains, though not when summed. The Pt peak is from the conductive coating sputtered on the sample, a necessary step in sample preparation.
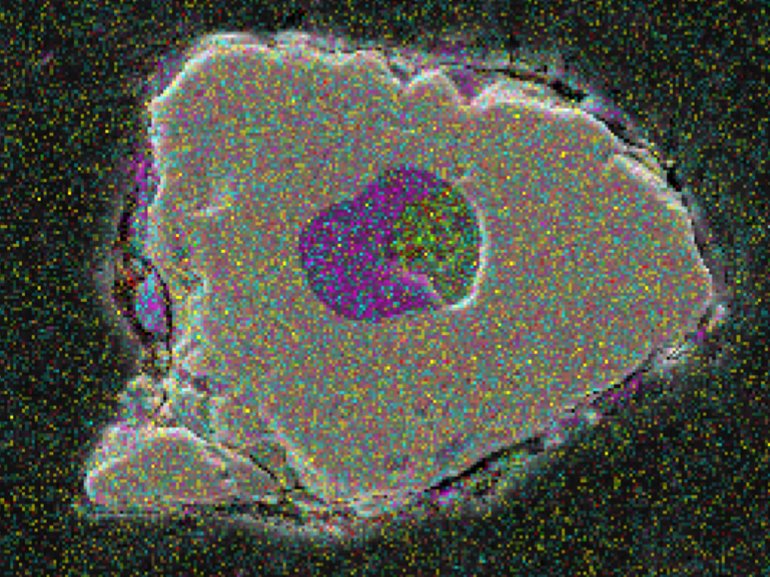
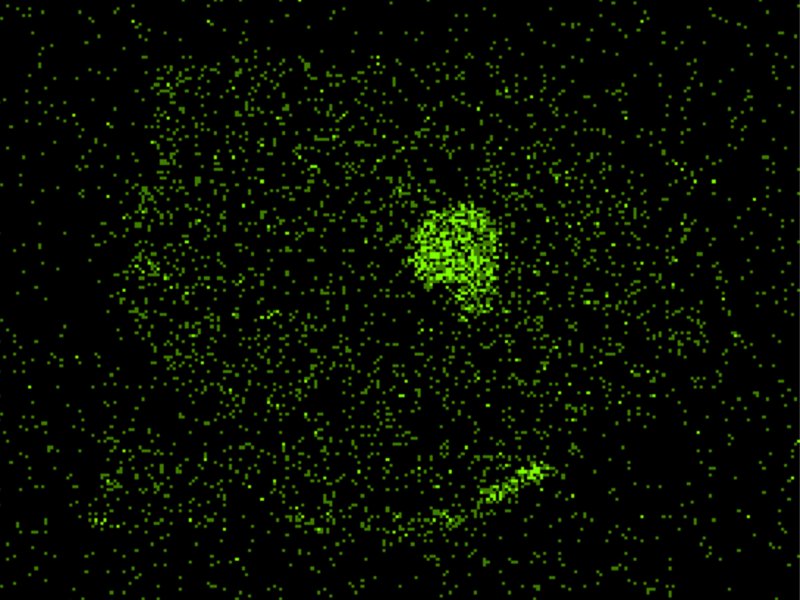
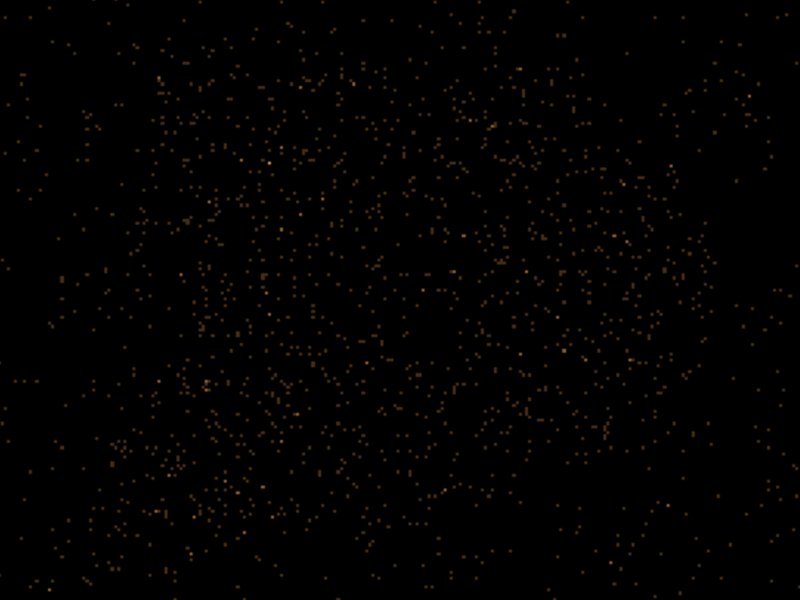
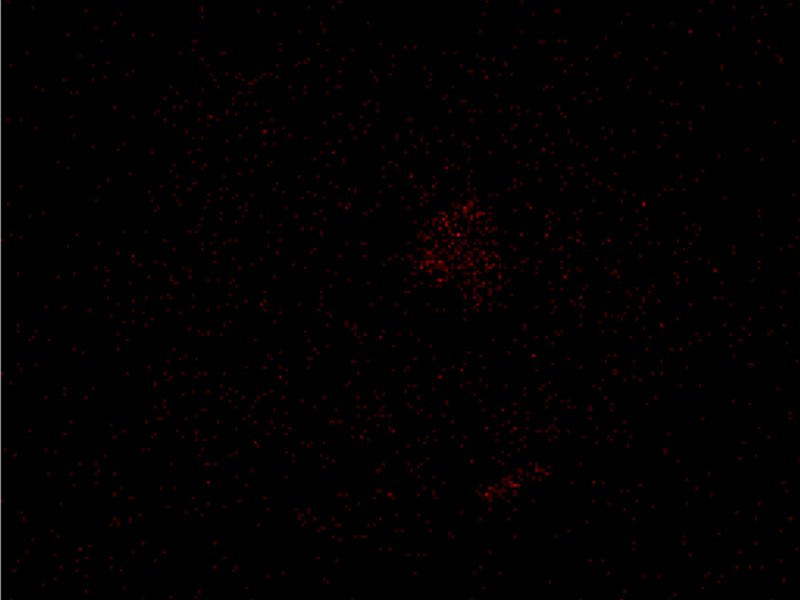
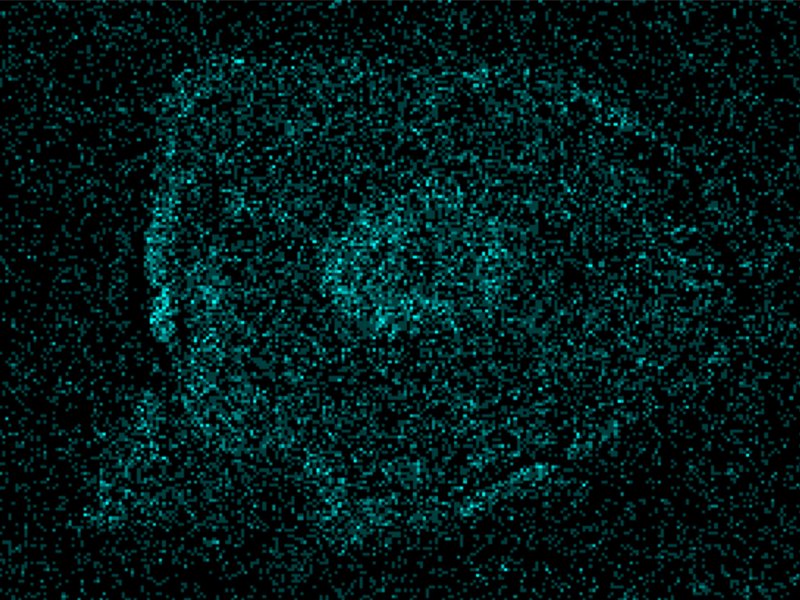
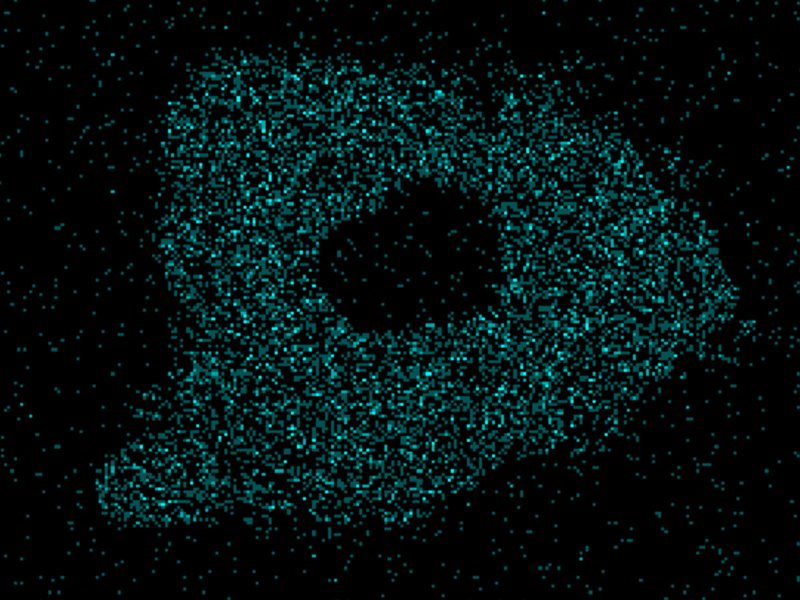
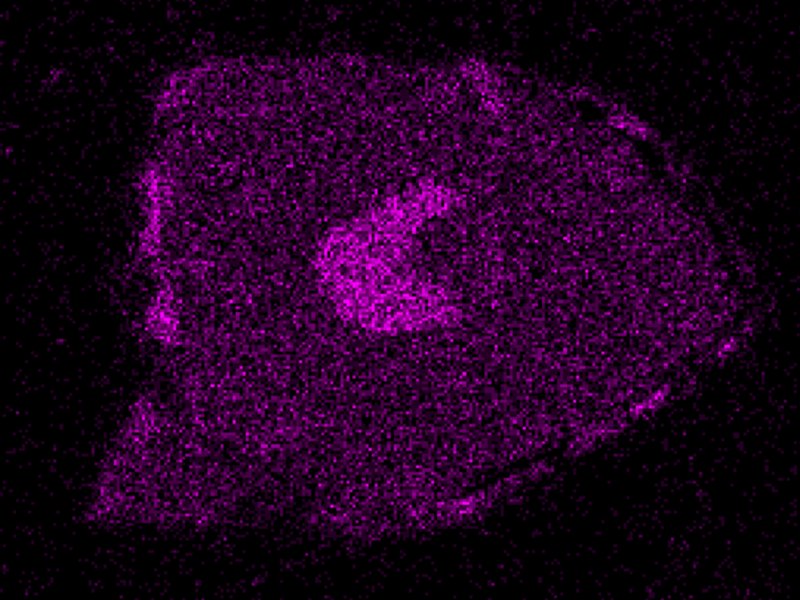
EDS Mapping
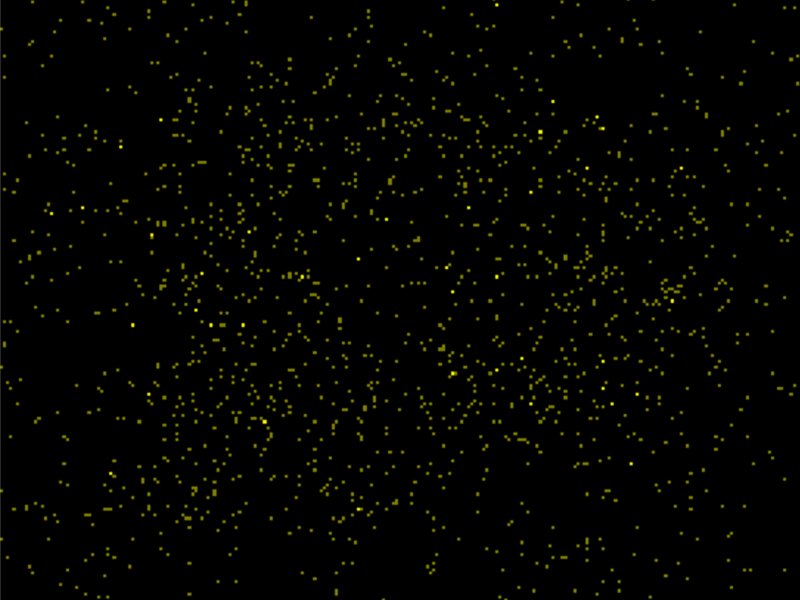
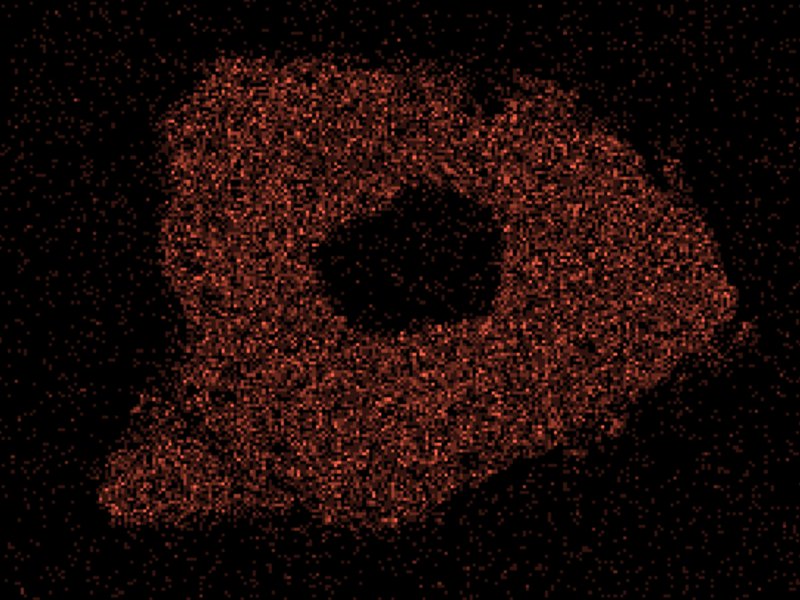
Each of the 17 grains were also mapped in an attempt to identify the included phases. Zircon 109 is shown here as an example. A large, two-phase inclusion is visible in the center of the grain. The left half, (pink on the map) has a strong Si signal; this is quartz. The right half (green and red) has Al and minor K; this is likely feldspar.
Phase Mapping
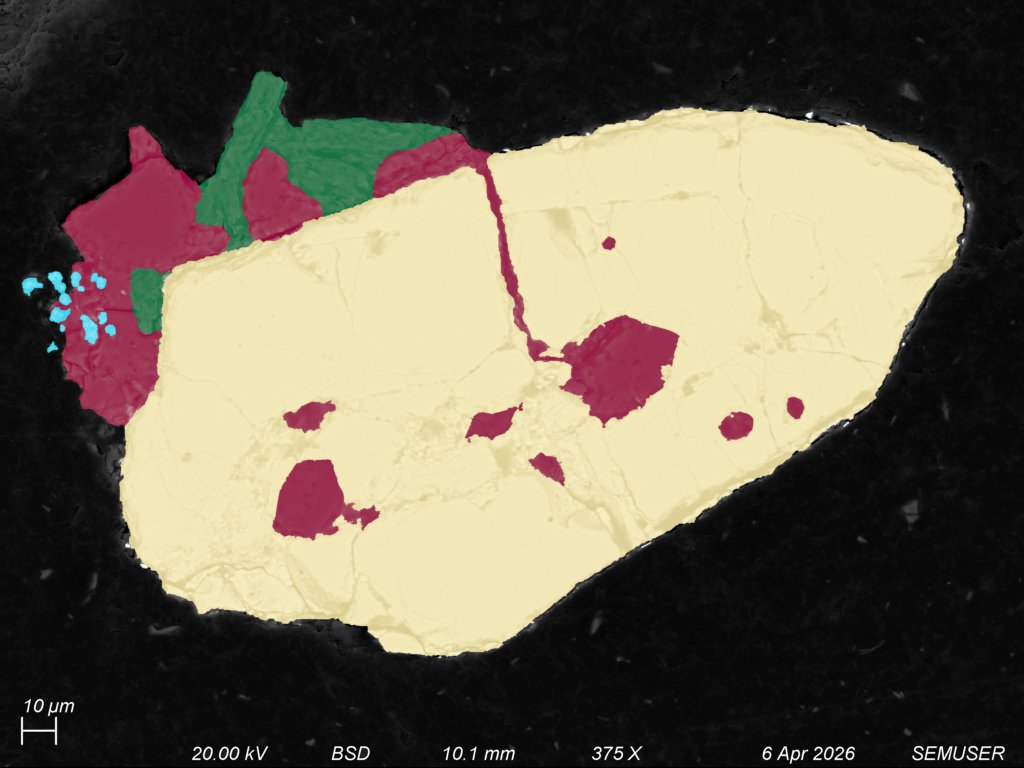
Using a combination of BSE and EDS modes, inclusions from 17 zircons were identified, nearly all of them quartz. Accessory phases include muscovite and Fe-Ti oxides. Color-enhanced maps were made in GIMP. Grain 213 is shown below.
Deep Zoom Images
The following Deep Zoom images allow for seamless web-viewing of high-resolution mosaicked images. Panel one is the reflected light map of the entire zircon mount. The reader is encouraged to explore the map and find the zircons which were imaged under the electron beam. Panel two shows zircon 064 at 5,000x magnification, a composite of 110 images. Panel three shows zircon 122 at 10,000x magnification, a composite of 672 images. Try to follow specific fracture traces across the grains, and see if you can identfy colloidal silica leftover from the polishing process. The final panel shows zircon 122 under BSE, to facilitate comparison between SE and BSE modes.
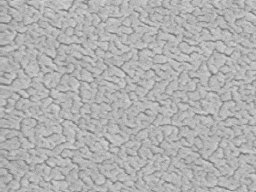
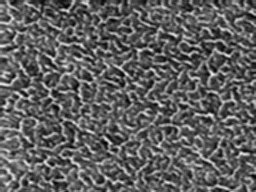
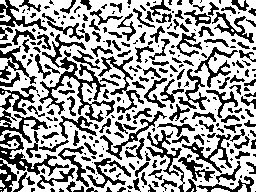
Future Work
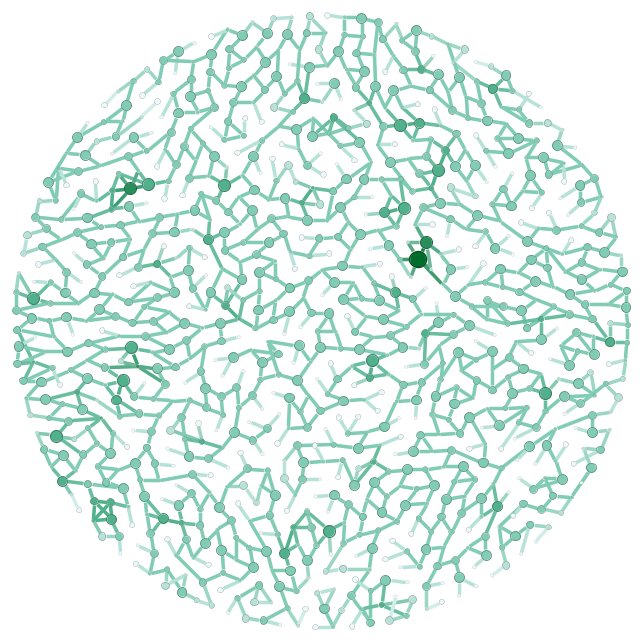
An unrealized goal of this project was the automatic detection of fracture networks across an entire zircon crystal. Progress toward this goal is so far limited to samples with wider fractures relative to total surface area. The conductive gold coating used to prepare many samples for SEM imaging was an ideal test of the network processing workflow. In this case, the network of gold grains, not the fractures between them, was analyzed. Network detection was done with NEFI 2.0 (MPI-INF). The image gallery below steps through the NEFI 2.0 workflow using a small section of a high resolution SE micrograph of a gold coated sample (FOV ~900 nm). Preprocessing steps include contrast enhancement, color inversion, and blurring, segmentation is done through Otsu's method, and the Guo-Hall algorithm is used for thinning and graph detection. The longest connected component (lcc) is used to avoid edge effects.


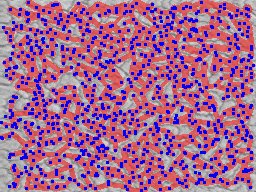
Once detected, networks were converted to .graphml with Python. Graph visualization and analysis was done with Gephi. Of the many parameters that can be calculated from a graph, the clustering coefficient and average shortest path length were of particular interest. When ratioed, these parameters provide a measure of the network's "small-worldedness," a somewhat nebulous metric that is most applicable to transport phenomena. In a small world network, transport is more efficient when compared to random networks with the same number of nodes and edges. Many natural networks are small worlds, including geologic ones [2]. With a sigma value of about 6.5, the network of gold grains in a sputter coating is (perhaps unsurprisingly) a small world. The reader is left to consider why this may be.
Acknowledgements
Thank you to Sean O'Neill for his help with this project throughout the Spring 2026 session of OPT 307.
AI Disclaimer
Portions of the HTML code for this website were generated and/or modified with GitHub Copilot and ChatGPT. The contents of the website, including text and images, is the author's own work.
References
1. Valley, J. W., Cavosie, A. J., Ushikubo, T., Reinhard, D. A., Lawrence, D. F., Larson, D. J., ... & Spicuzza, M. J. (2014). Hadean age for a post-magma-ocean zircon confirmed by atom-probe tomography. Nature Geoscience, 7(3), 219-223.
2. Valentini, L., Perugini, D., & Poli, G. (2007). The “small-world” topology of rock fracture networks. Physica A: Statistical Mechanics and its Applications, 377(1), 323-328.