Multiscale Imaging and Quantitative Analysis of Upconverting Nanoparticles (UCNPs) Distribution on TEM Grid
Junyi Lin, Department of Mechanical Engineering, University of Rochester
Email: junyi.lin@rochester.edu
Introduction
Upconverting nanoparticles (UCNPs) are widely used as optical probes due to their unique luminescence properties and sensitivity to local environments. Their performance strongly depends on spatial distribution when deposited on substrates such as transmission electron microscopy (TEM) grids. In drop-cast systems, nanoparticle concentration governs dispersion behavior, influencing surface coverage, inter-particle spacing, and aggregation.
These factors directly impact heat transfer profile and the accuracy of temperature measurement. At low concentrations, particles are well-separated but sparse, limiting statistical robustness. At high concentrations, aggregation complicates segmentation and measurement. Therefore, understanding concentration-dependent morphology is essential for optimizing both imaging and downstream analysis.
This work investigates UCNP distribution across a range of concentrations using a correlative multiscale imaging approach, combining light microscopy (LM), scanning electron microscopy (SEM), transmission electron microscopy (TEM), and energy-dispersive X-ray spectroscopy (EDS), along with image processing and particle size analysis.
Method and Materials
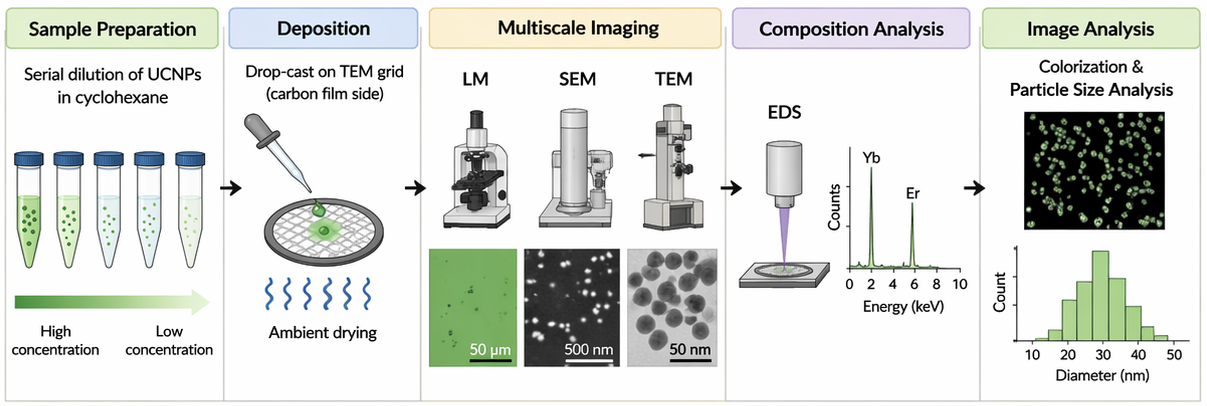
Figure 1. Workflow of the project. Figure for representation purpose; not physically exact.
Sample Preparation
UCNPs were dispersed in cyclohexane to form a stock solution. Serial dilutions were performed to obtain a range of concentrations (from 1/100 to 1/400). For each sample, ~10 µL of solution was drop-cast onto the carbon film side of TEM grids and allowed to dry under ambient conditions.
Microscopy Characterization
A multiscale imaging workflow was employed:
- Light Microscopy (LM): Used for large-area inspection of the TEM grid to evaluate droplet coverage, uniformity, and potential defects.
- Scanning Electron Microscopy (SEM): Used to characterize particle distribution, surface morphology, and aggregation behavior across concentrations.
- Transmission Electron Microscopy (TEM): Used for high-resolution imaging of individual UCNPs to examine particle size, shape, and internal structure.
- Energy-Dispersive X-ray Spectroscopy (EDS): Used to confirm elemental composition and spatial distribution of constituent elements (Yb, Y, Na, F, and C).
Image Processing and Particle Analysis
SEM images (primarily from the Carbon/Formvar sample at 1/100 concentration) were used for quantitative analysis. The workflow included:
- Background removal and contrast adjustment
- Thresholding to isolate particles
- Binary segmentation and noise filtering
- Particle identification and labeling
- Extraction of particle metrics (area, perimeter)
A histogram of particle size distribution was generated, and statistical metrics (mean and standard deviation) were computed.
Results
Low-Magnification Imaging
Light microscopy images of the TEM grid show the overall nanoparticles coverage and distribution after drop-cast deposition. The UCNP solution spreads across the carbon film, forming a relatively continuous coverage with visible variation in local density. Regions near the copper grid bars exhibit minor differences in texture and contrast, indicating non-uniform drying behavior.
SEM imaging at low magnification further reveals structural features of the grid, including damaged regions and debris accumulation. These areas introduce local heterogeneity that can influence particle distribution and should be considered when selecting regions of interest for higher-magnification analysis.
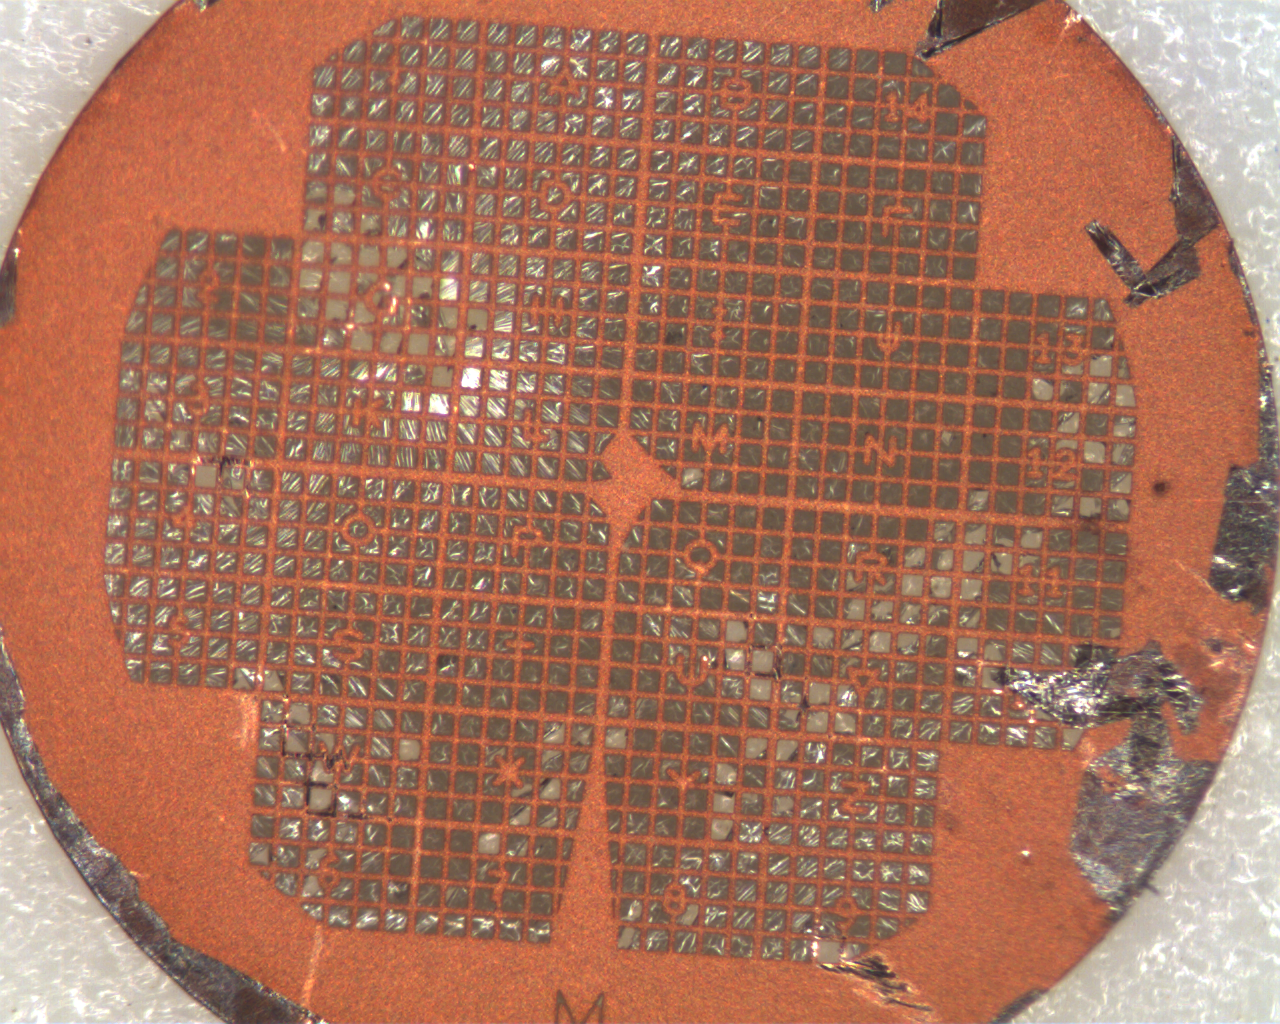
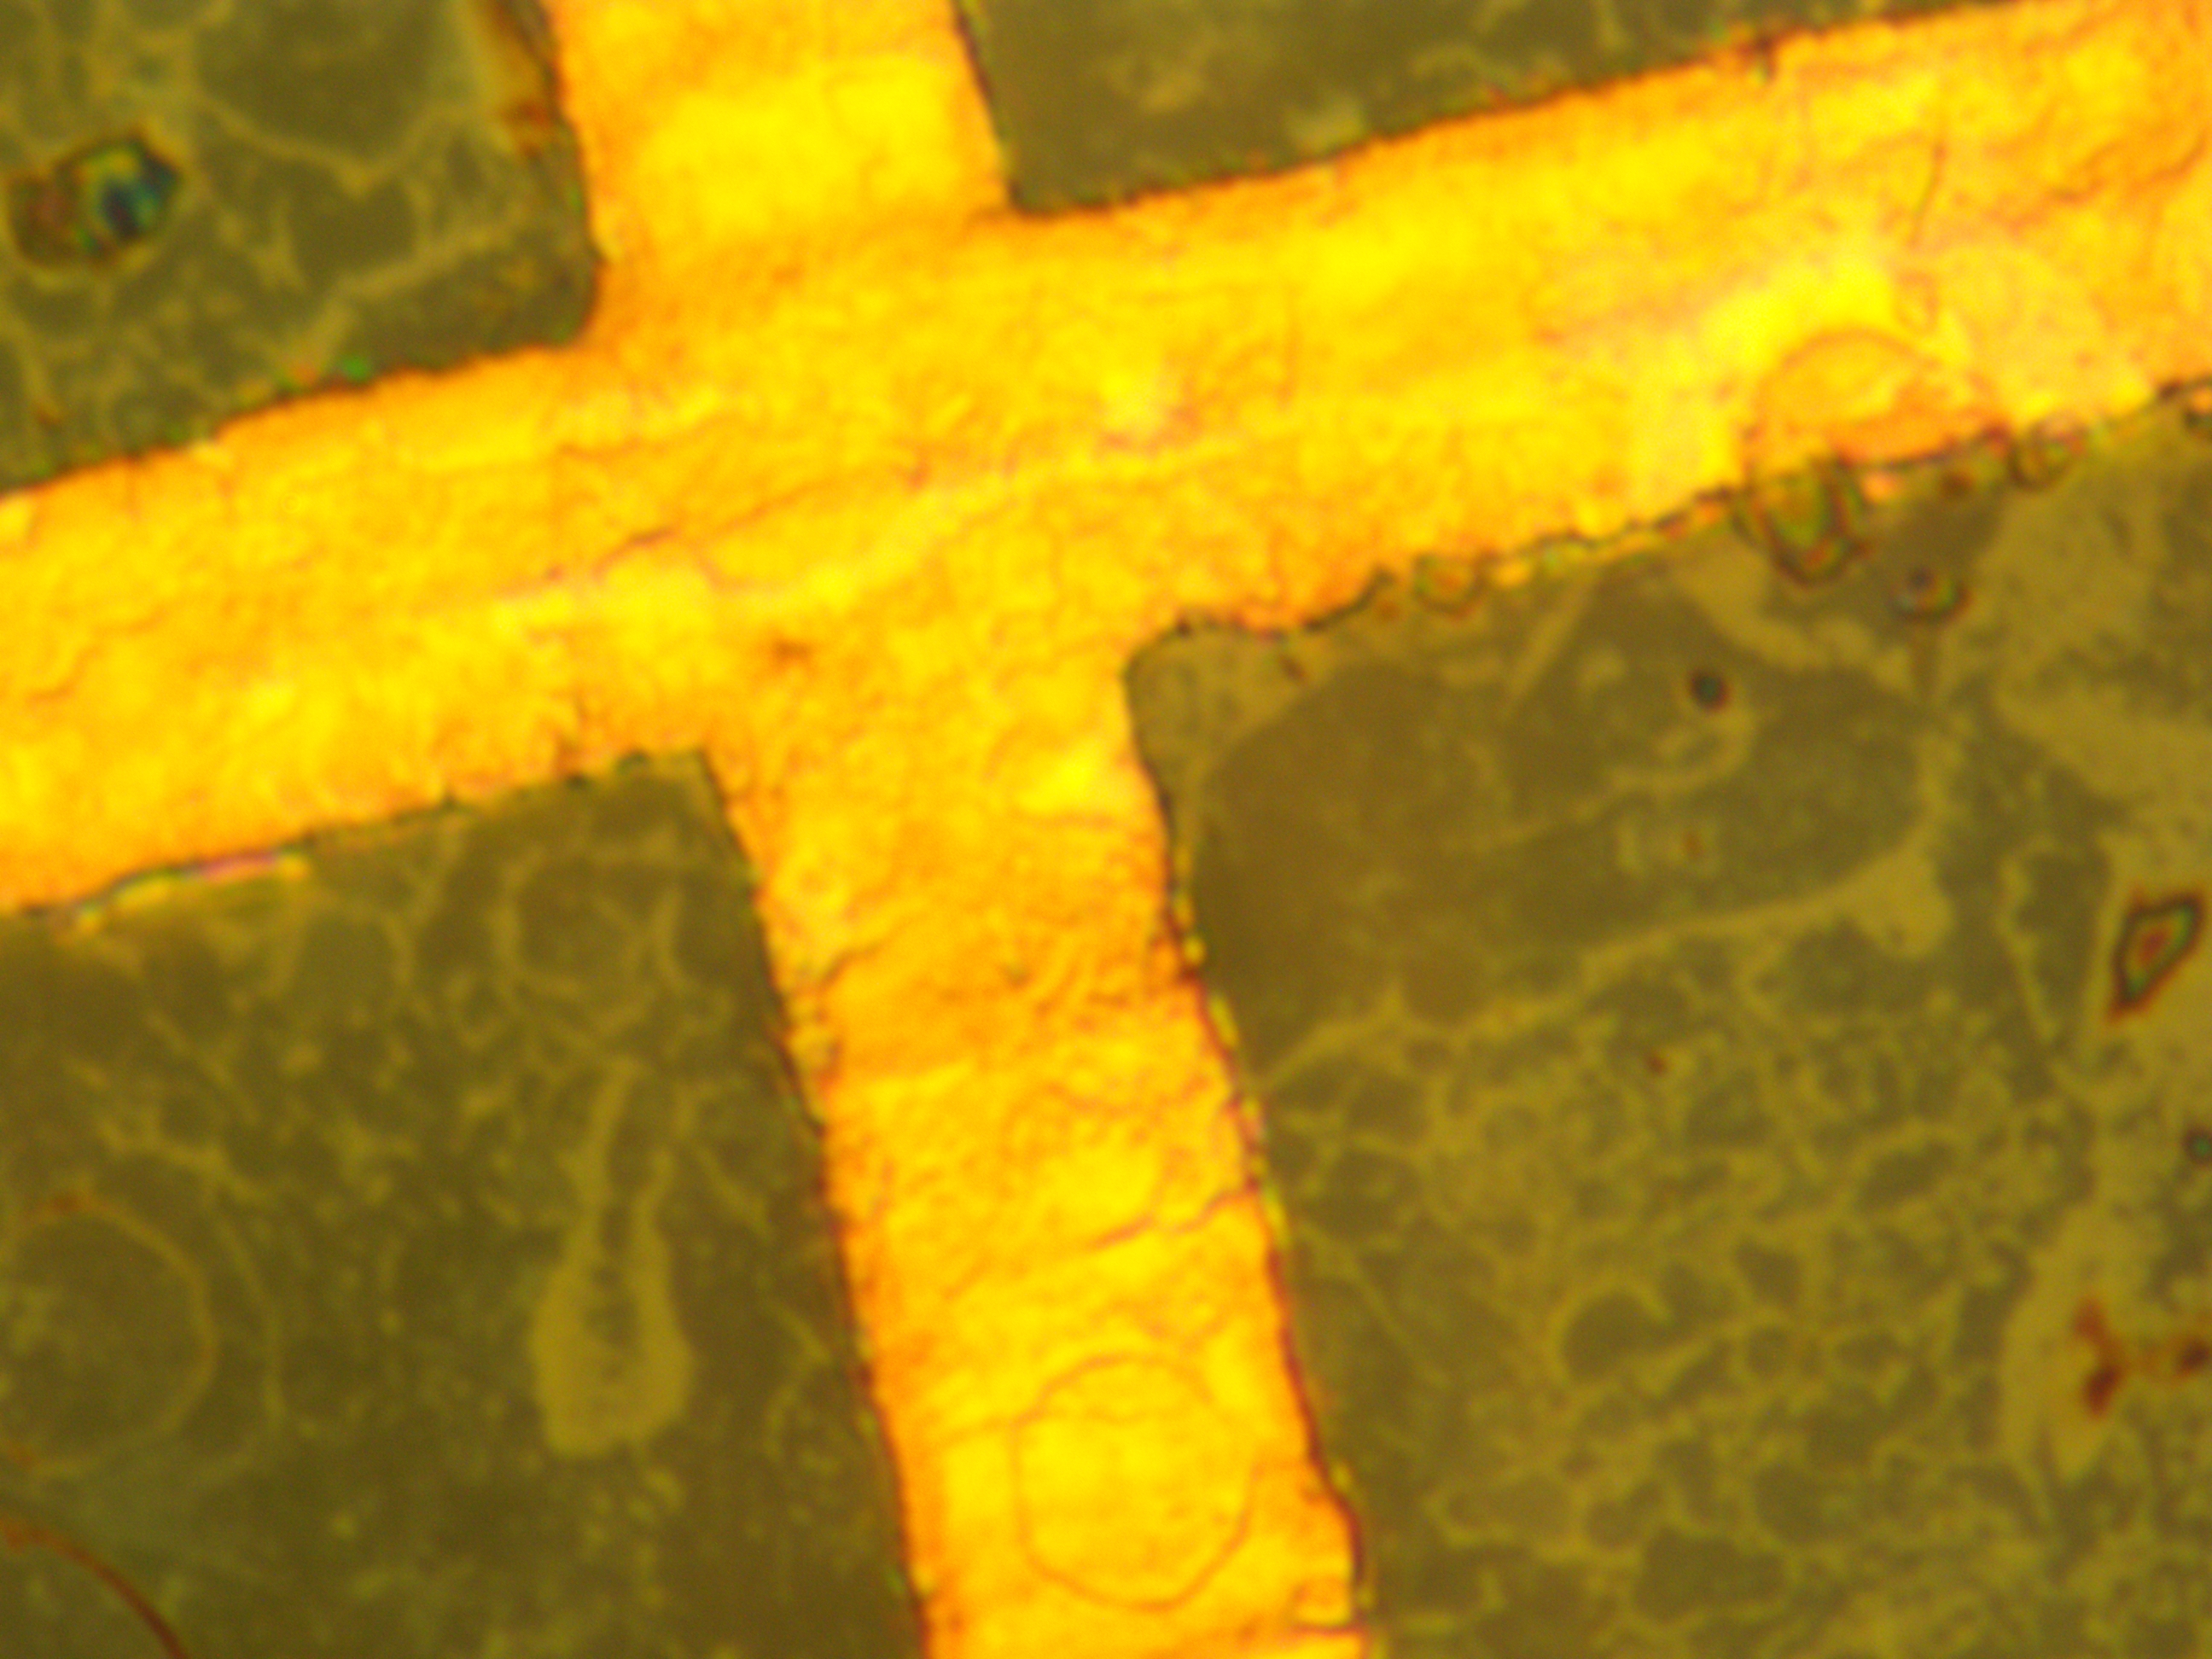
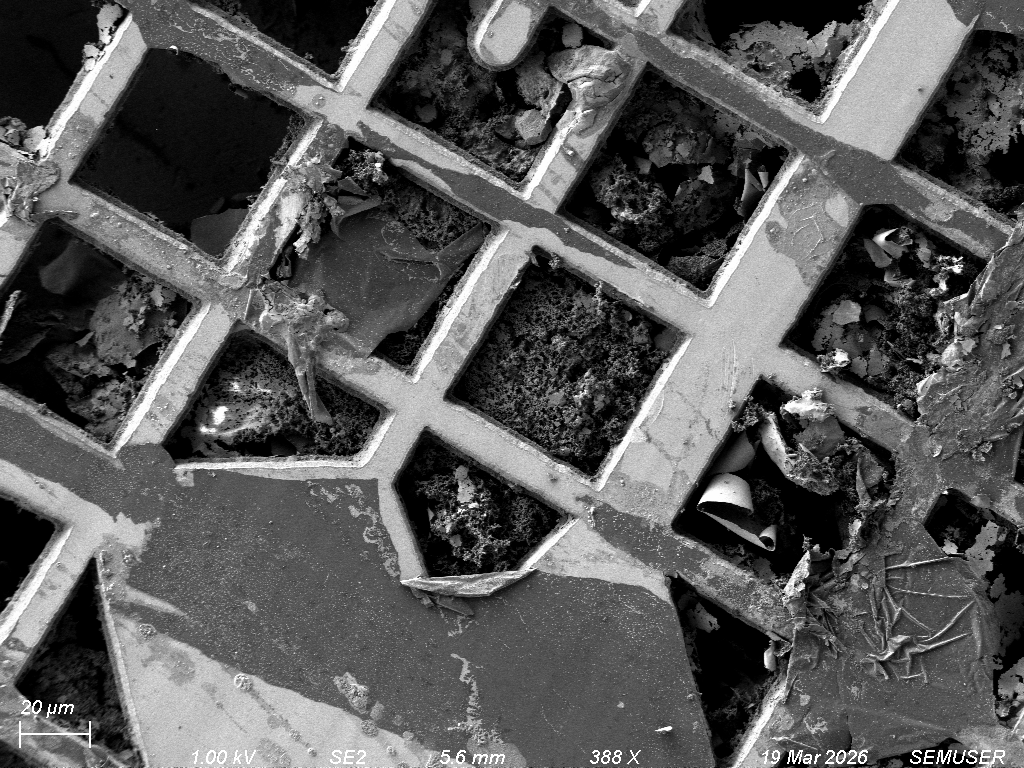
Figure 2. (Left) Overview of the TEM grid under light microscopy; (Middle) Detail of the grid surface under light microscopy; (Right) Low-magnification SEM image.
High-Magnification EM Imaging and Composition Analysis
SEM images at higher magnification reveal the morphology and distribution of UCNPs on the carbon film. Particles appear as bright spots against the darker background, with varying degrees of aggregation depending on local concentration. Some regions show well-dispersed particles, while others exhibit clusters, particularly near grid bars or damaged areas.
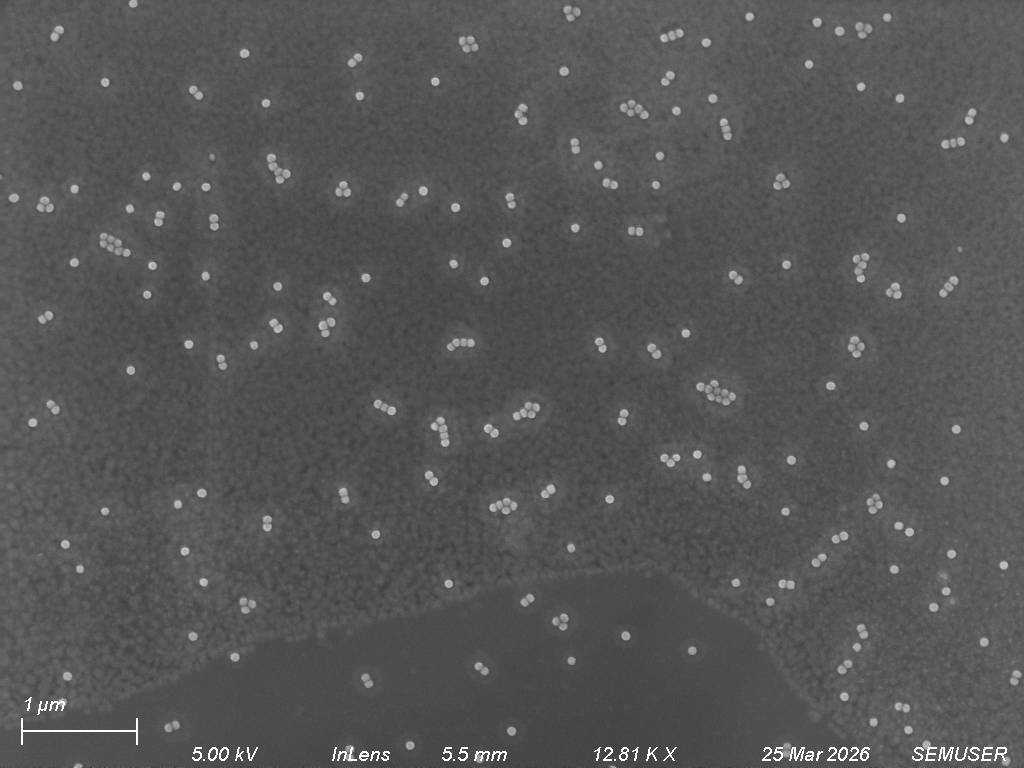
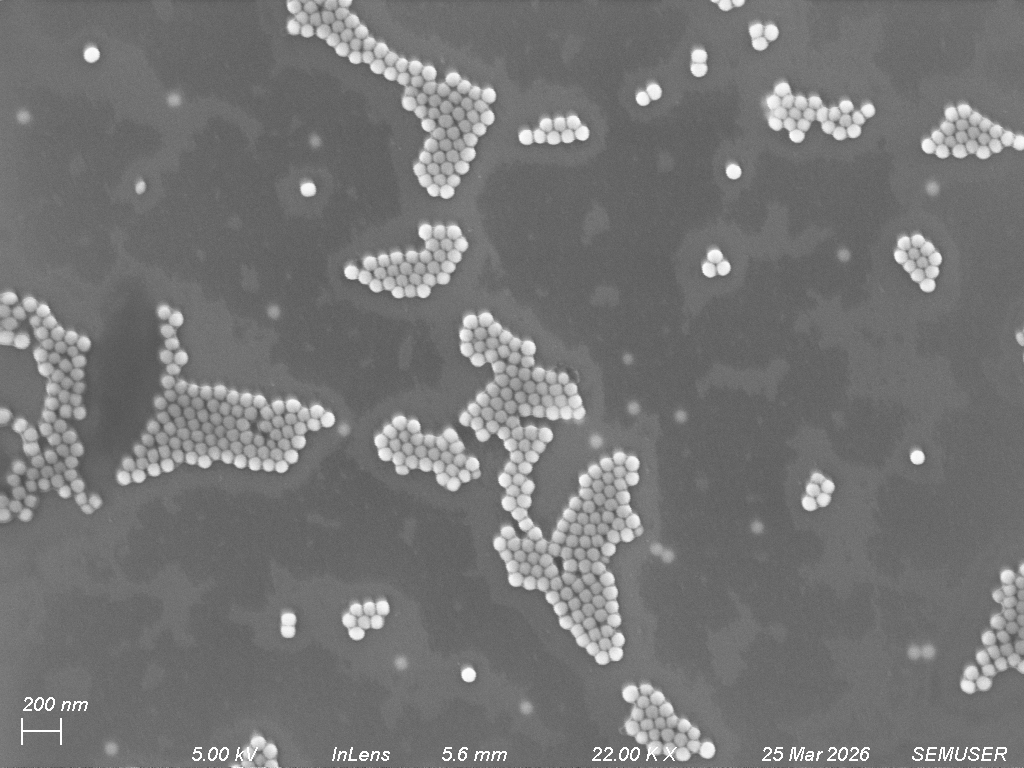
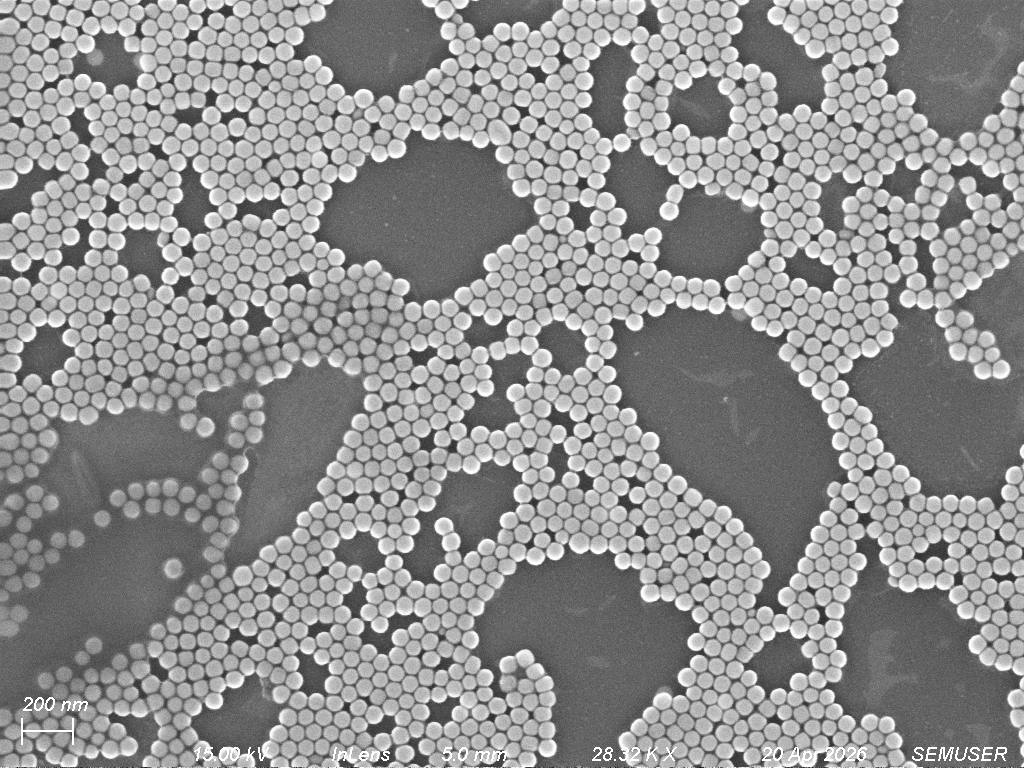
Figure 3. SEM images at high magnification for different UCNPs concentrations: (Left) 1/400; (Middle) 1/200; (Right) 1/100.
TEM imaging provides detailed insights into individual particle characteristics. The UCNPs display a range of sizes and shapes, with some degree of polydispersity. EDS mapping confirms the elemental composition consistent with the expected stoichiometry of Yb, Y, Na, F, and C, validating the presence of UCNPs and their distribution across the grid.
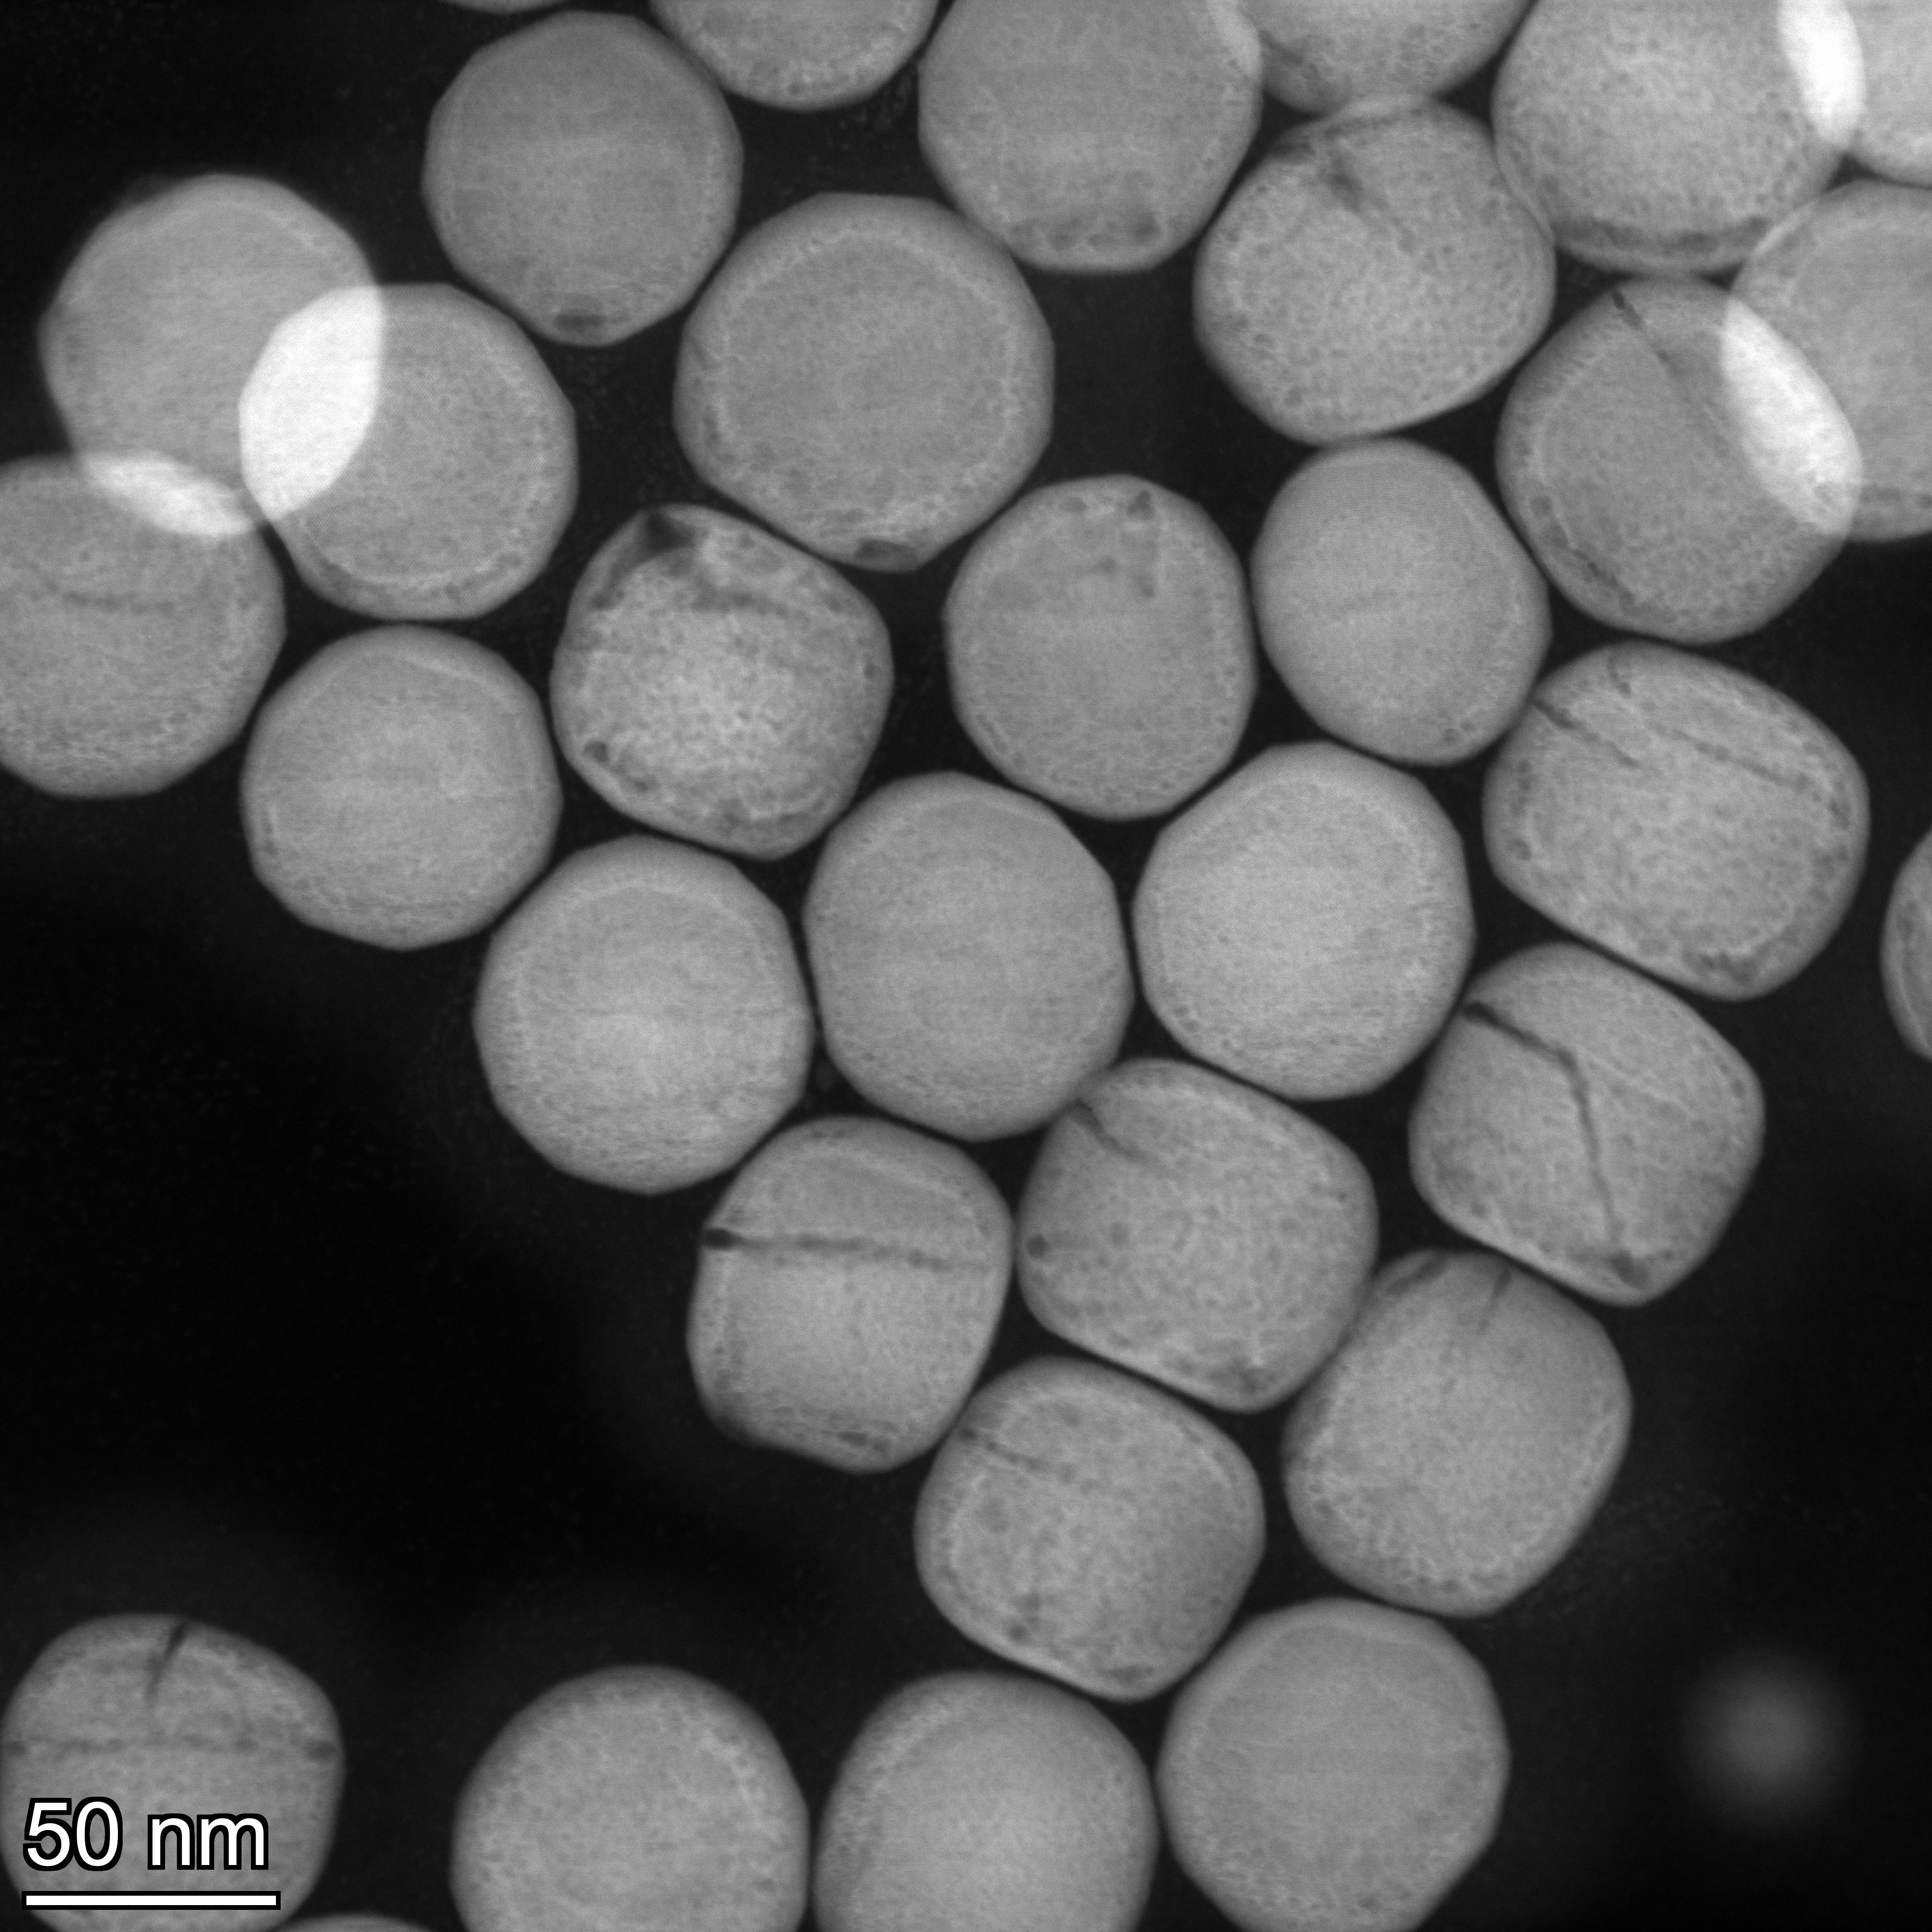

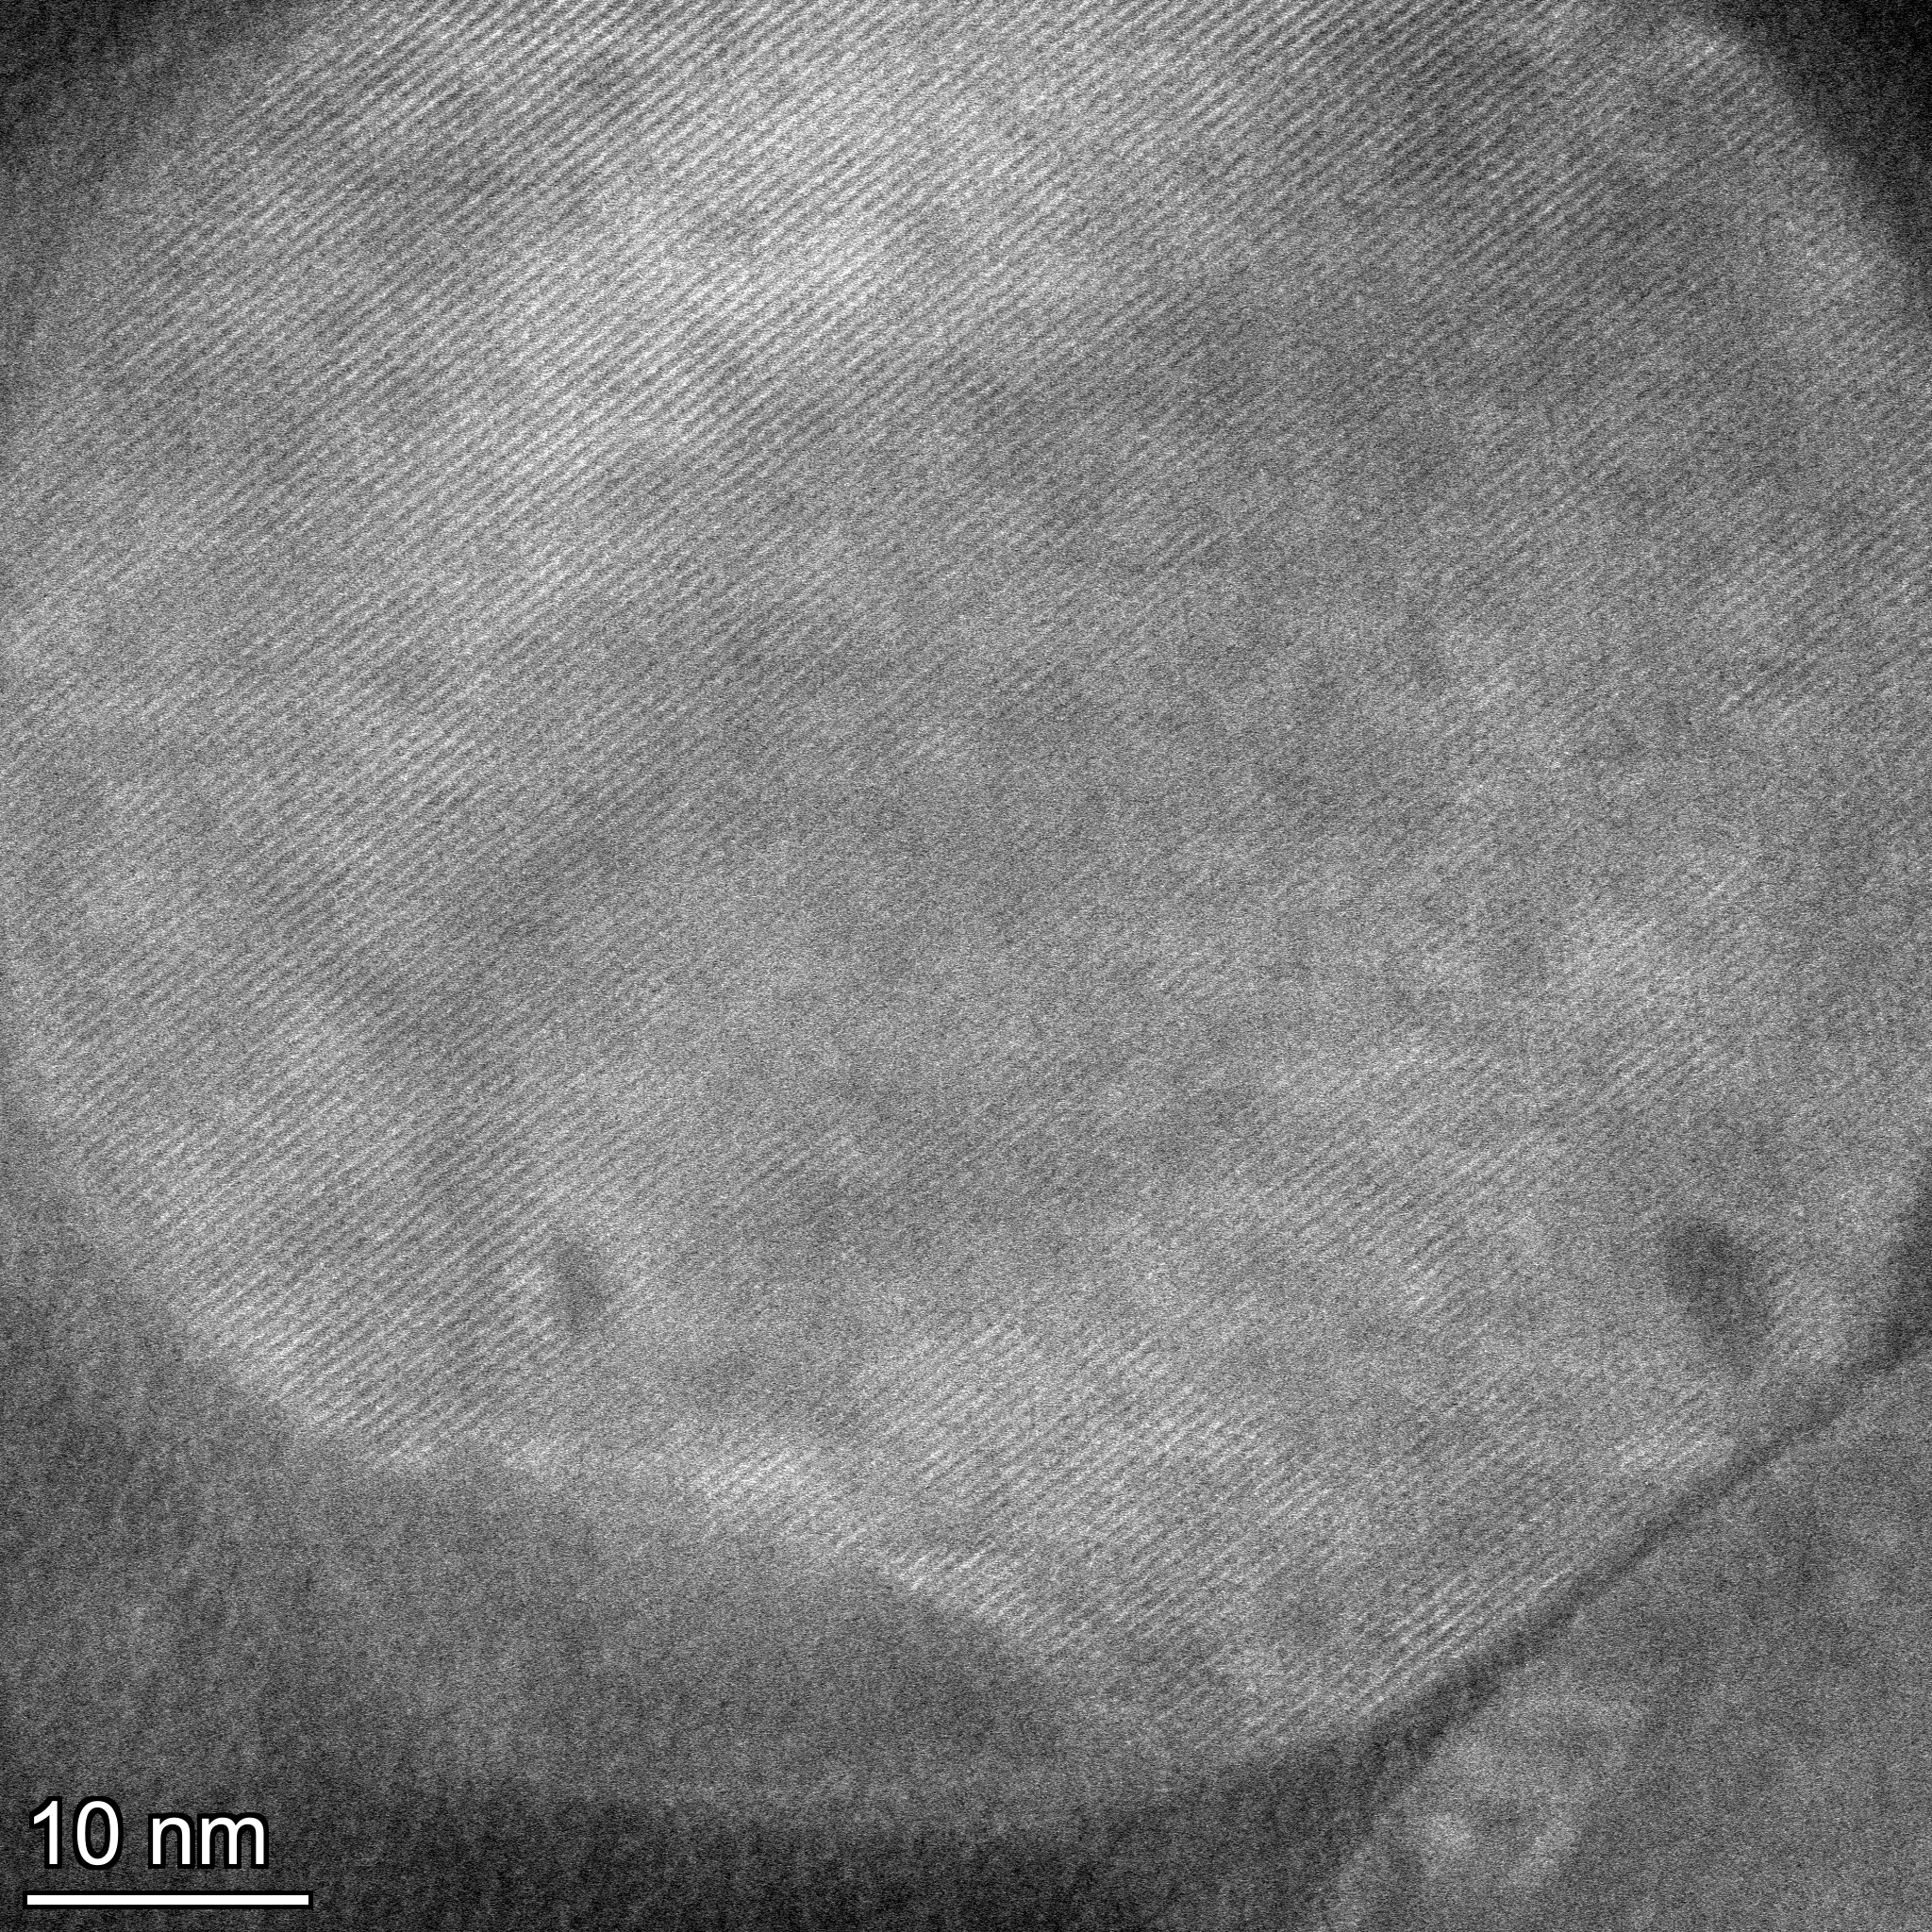
Figure 4. TEM images of UCNPs: (Left) Low-magnification view
showing uniform particle morphology and relatively narrow size
distribution. (Middle) Single-particle detail highlighting
faceted geometry and surface contrast. (Right) High-resolution
image revealing internal structure and lattice fringes,
indicating crystalline nature of the nanoparticles. 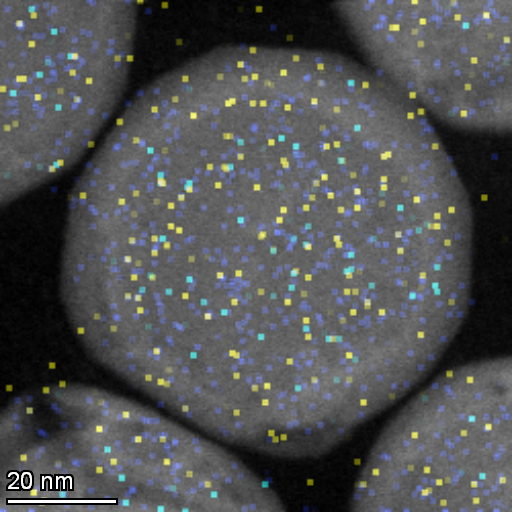
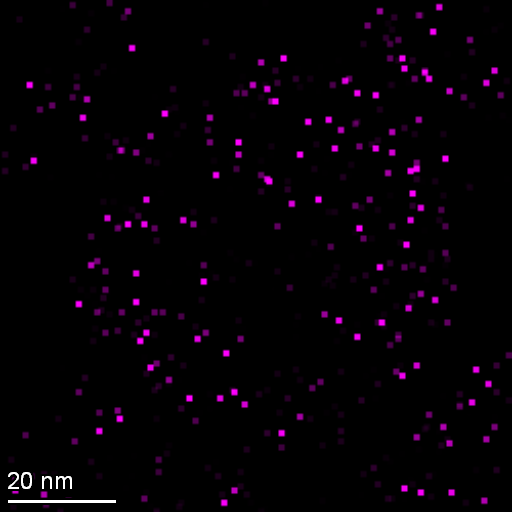
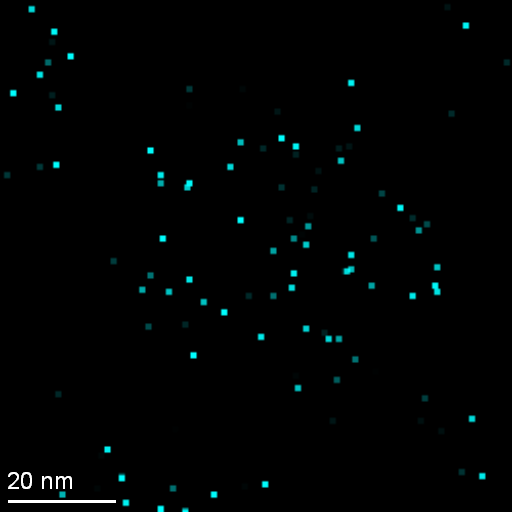
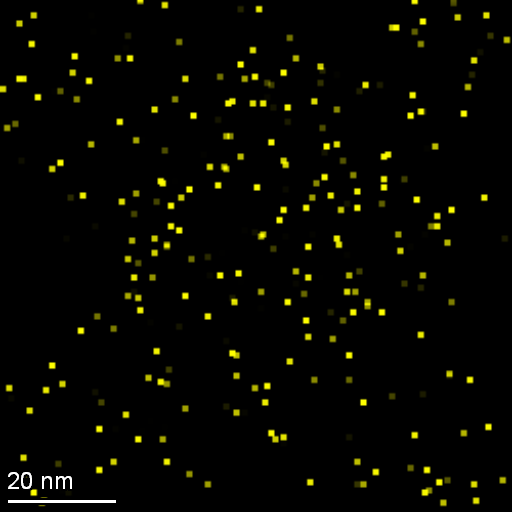
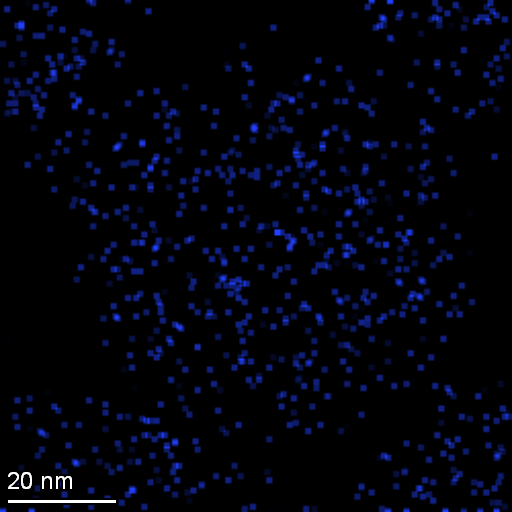
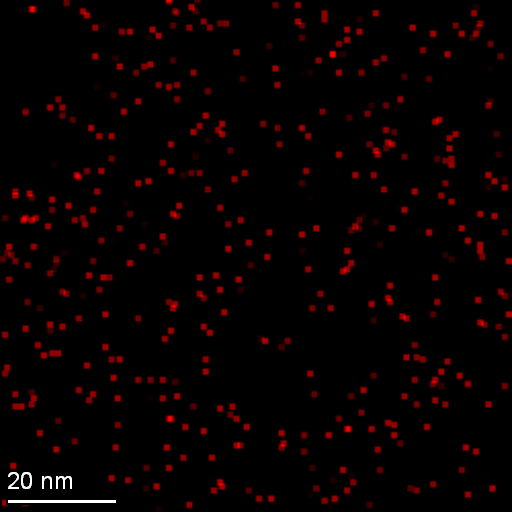
Figure 5. EDS elemental maps of UCNPs, from left to right: Composite color map showing overall distribution of elements; Yb map highlighting the presence of ytterbium; Y map indicating yttrium distribution; Na map confirming sodium presence; F map showing fluorine distribution; C map revealing carbon background and potential contamination.
Image Processing and Quantitative Analysis
Particle analysis was performed on the SEM image of the Carbon/Formvar sample at 1/100 concentration. After segmentation and particle identification, a size distribution was obtained.
The histogram shows a relatively narrow distribution, with a calculated mean particle diameter of 65.24 ± 14.89 nm. While the overall distribution is consistent with TEM observations, high particle density and aggregation introduce segmentation challenges, which may contribute to slight broadening of the distribution.
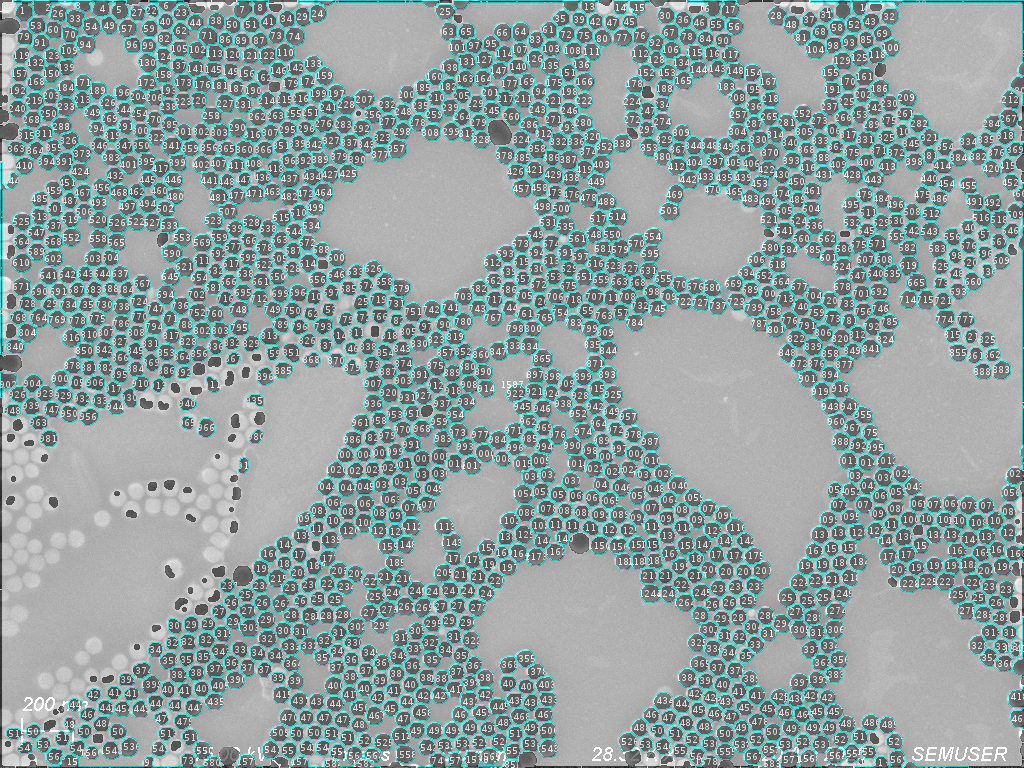
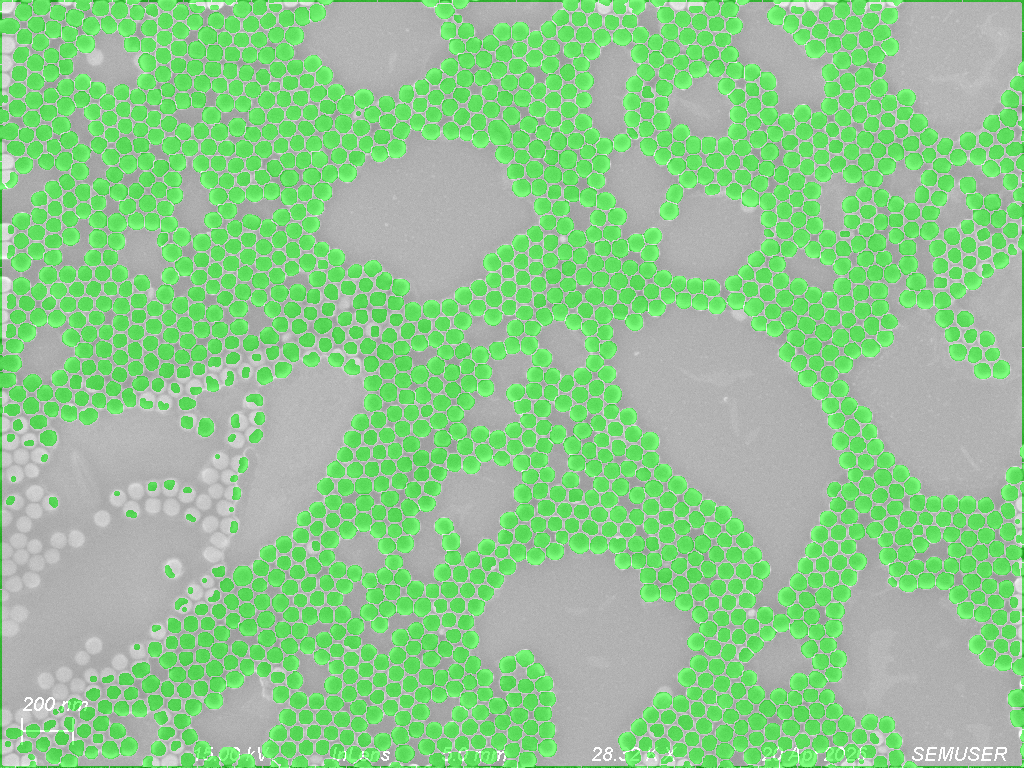
Figure 6. (Left) Image of particles detection with ImageJ; (Right) Processed SEM image with identified particles highlighted in green.
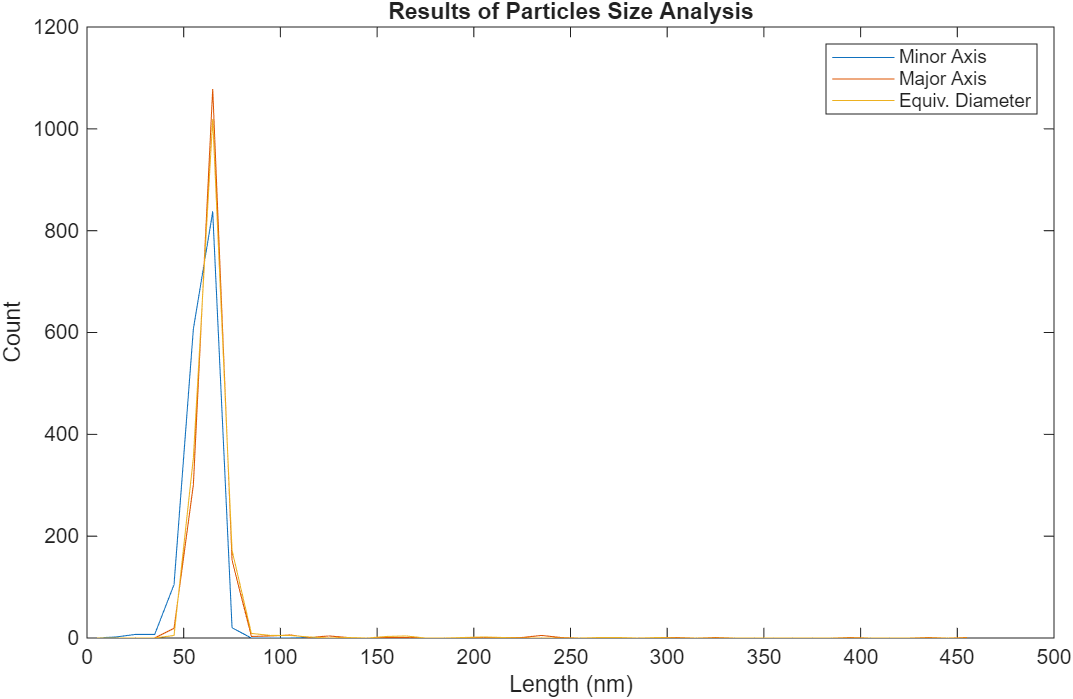
Figure 7. Histogram of particle size distribution
Discussion
The results demonstrate that UCNP concentration is a dominant factor governing particle dispersion and deposition behavior on TEM grids. SEM imaging revealed a clear progression from sparse, well-separated particles at low concentrations to increasingly dense packing and aggregation at higher concentrations. This trend is consistent with solvent evaporation-driven deposition, where higher particle loading promotes clustering and reduces inter-particle spacing. Such aggregation significantly impacts both imaging clarity and segmentation reliability, particularly during quantitative analysis.
Despite concentration-dependent differences in spatial distribution, TEM imaging confirmed that individual UCNPs maintain relatively consistent morphology across samples. The particles exhibited uniform size, faceted geometry, and crystalline structure, indicating that synthesis quality remained stable and that observed clustering was primarily caused by deposition effects rather than intrinsic particle variability. EDS elemental mapping further validated the expected UCNP composition through consistent distributions of Yb, Y, Na, and F, confirming that the imaged particles corresponded to the intended nanoparticle system.
Particle size analysis yielded a mean diameter of 65.24 ± 14.89 nm, reflecting a moderately narrow size distribution that aligns with TEM observations. However, increasing concentration introduced segmentation challenges due to particle overlap and aggregation, which can artificially broaden measured distributions and reduce analytical precision. These findings suggest that while higher concentrations improve overall particle visibility and surface coverage, excessive loading compromises quantitative accuracy.