Searching for Micrometeorites in Urban Rooftop Sediment
What is a Micrometeorite?
Micrometeorites are extraterrestrial particles between 10 µm and 2 mm in diameter that have made their way through Earth’s atmosphere [1]. They represent the largest flux of extraterrestrial material to the Earth, likely delivering between 20,000 and 60,000 tons of material annually [2]. Micrometeorites provide important information about the history our solar system and the delivery of materials to the Earth, including compounds that were necessary for the formation of life [3]. They may contain delicate materials that do not survive atmospheric entry in larger meteorite samples, offering unique insight [2].
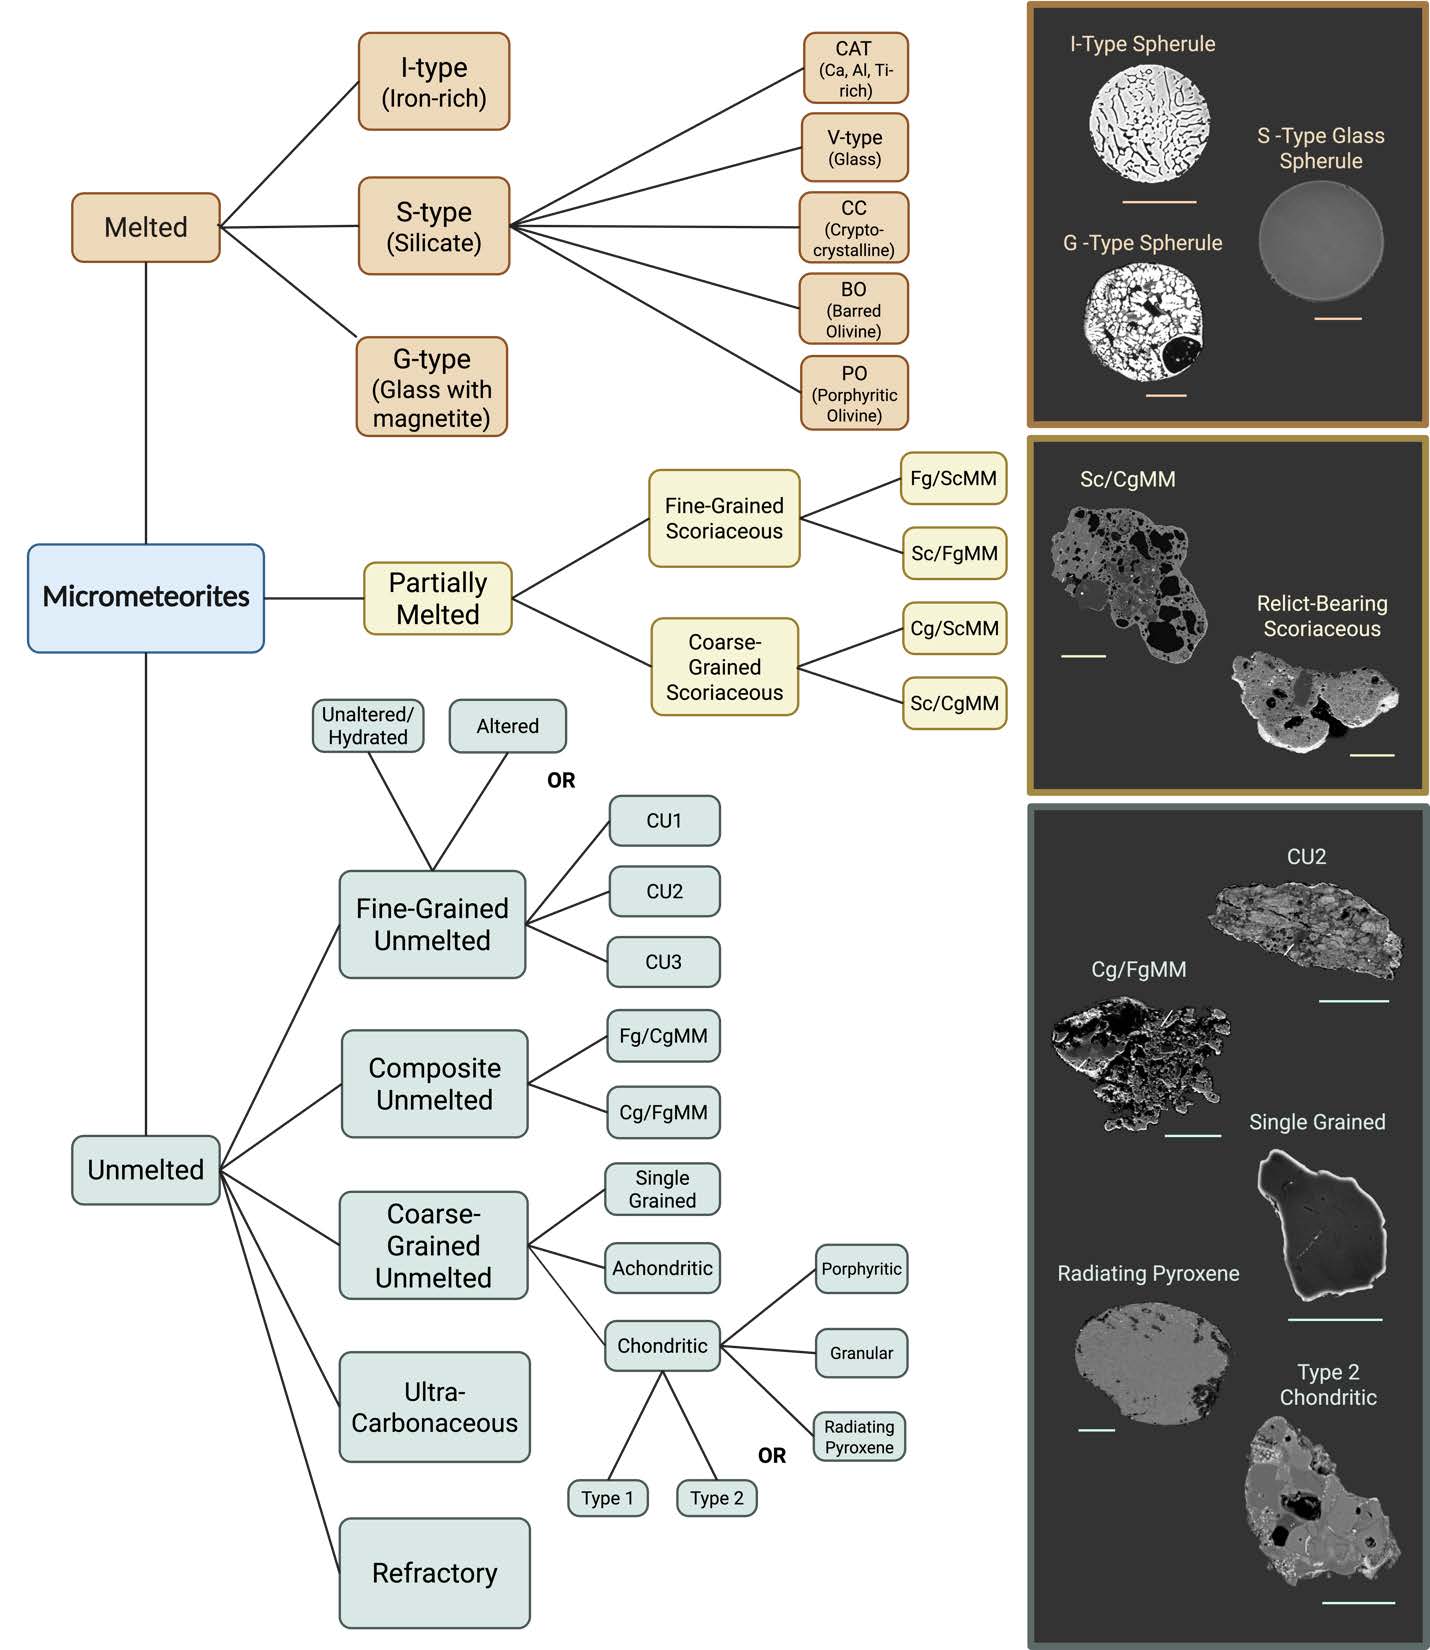
Because they are so small, micrometeorites cannot always be linked to known meteorite groups and have warranted their own classification scheme (Figure 1). Micrometeorites possess a wide range of textures and compositions, but often display key characteristics that allow them to be identified. For example, many micrometeorites are melted in the atmosphere, developing a spherical shape. These are known as cosmic spherules. Micrometeorites may also be identified by dendritic (or branching) crystal morphologies, magnetite rims, chondritic chemical compositions, or the presence of a Ni-bearing metal bead. Not all micrometeorites are fully melted, and may retain some of their original mineral phases and textures.
The majority of micrometeorites are collected from Antarctica, where anthropogenic contaminants are limited and extraterrestrial material is easily identified [5]. However, there have been increasing efforts to search for micrometeorites in populated urban locations. Multiple successful urban collections have been developed, containing thousands of individual micrometeorites obtained from flat rooftops and gutters [6]. Identifying micrometeorites in urban environments is challenging due to the abundance of misleading anthropogenic particles, so more thorough analysis is required.
While some features can be identified with a light microscope, the SEM is extremely useful for helping to identify micrometeorites. Backscattered electron (BSE) and secondary electron (SE) signals provide high-resolution and high-depth-of-field images that allow micrometeorite morphologies to be characterized. BSE imaging also enables the identification of different mineral phases based on contrast. The elemental compositions of these phases can then be determined using energy-dispersive X-ray spectroscopy (EDS). With these techniques in hand, I was curious to determine if micrometeorites could be collected on the University of Rochester campus. I was also interested to analyze which types of natural and industrially produced contaminants I would encounter during my search.
Methods
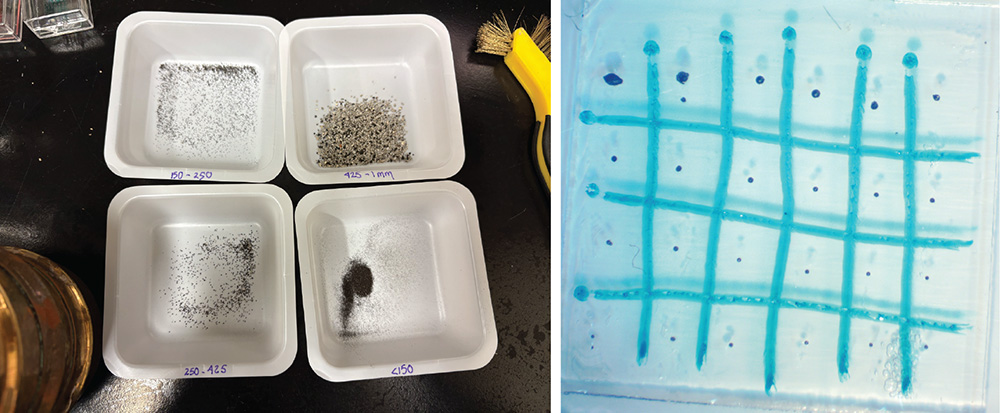
Sediment was collected from the rooftop of Wegmans Hall (Figure 2) and the gutter of a local home.
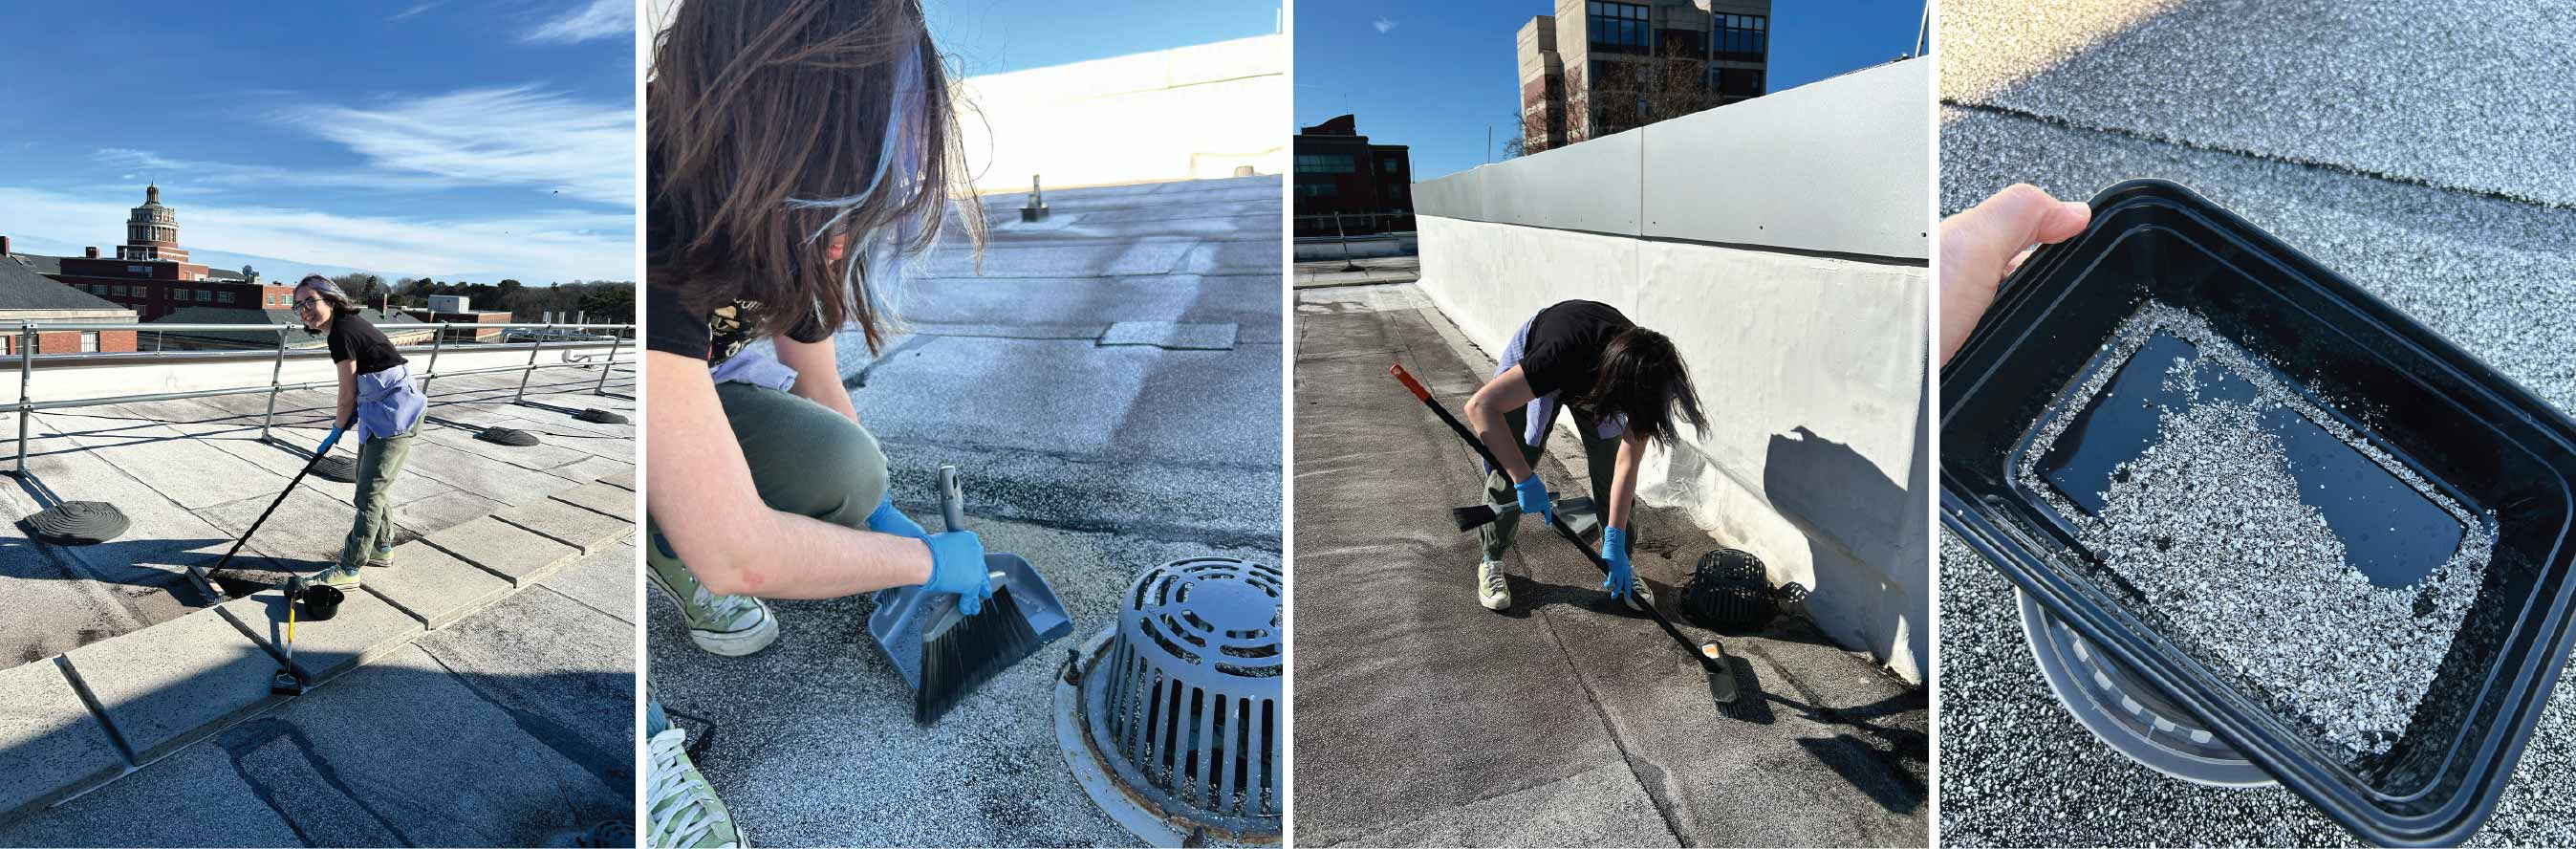
Sediment was magnetically separated, ultrasonically cleaned for 15 minutes, dried, and sieved into multiple size fractions. Approximately 1 gram of magnetic sediment was recovered. Particles less than 1 µm in diameter were examined under the optical microscope. Grains of interest were handpicked and mounted onto glass sides with double-sided tape (Figure 3). Four confirmed micrometeorites that had been extracted from Antarctic soil were also mounted to be analyzed for comparison.
Samples were then sputter-coated with approximately 10 µm of gold and examined under the optical microscope and in the SEM. After initial analysis, a subset of samples were mechanically polished and mounted in epoxy to view their interior structures.
Antarctic Micrometeorites
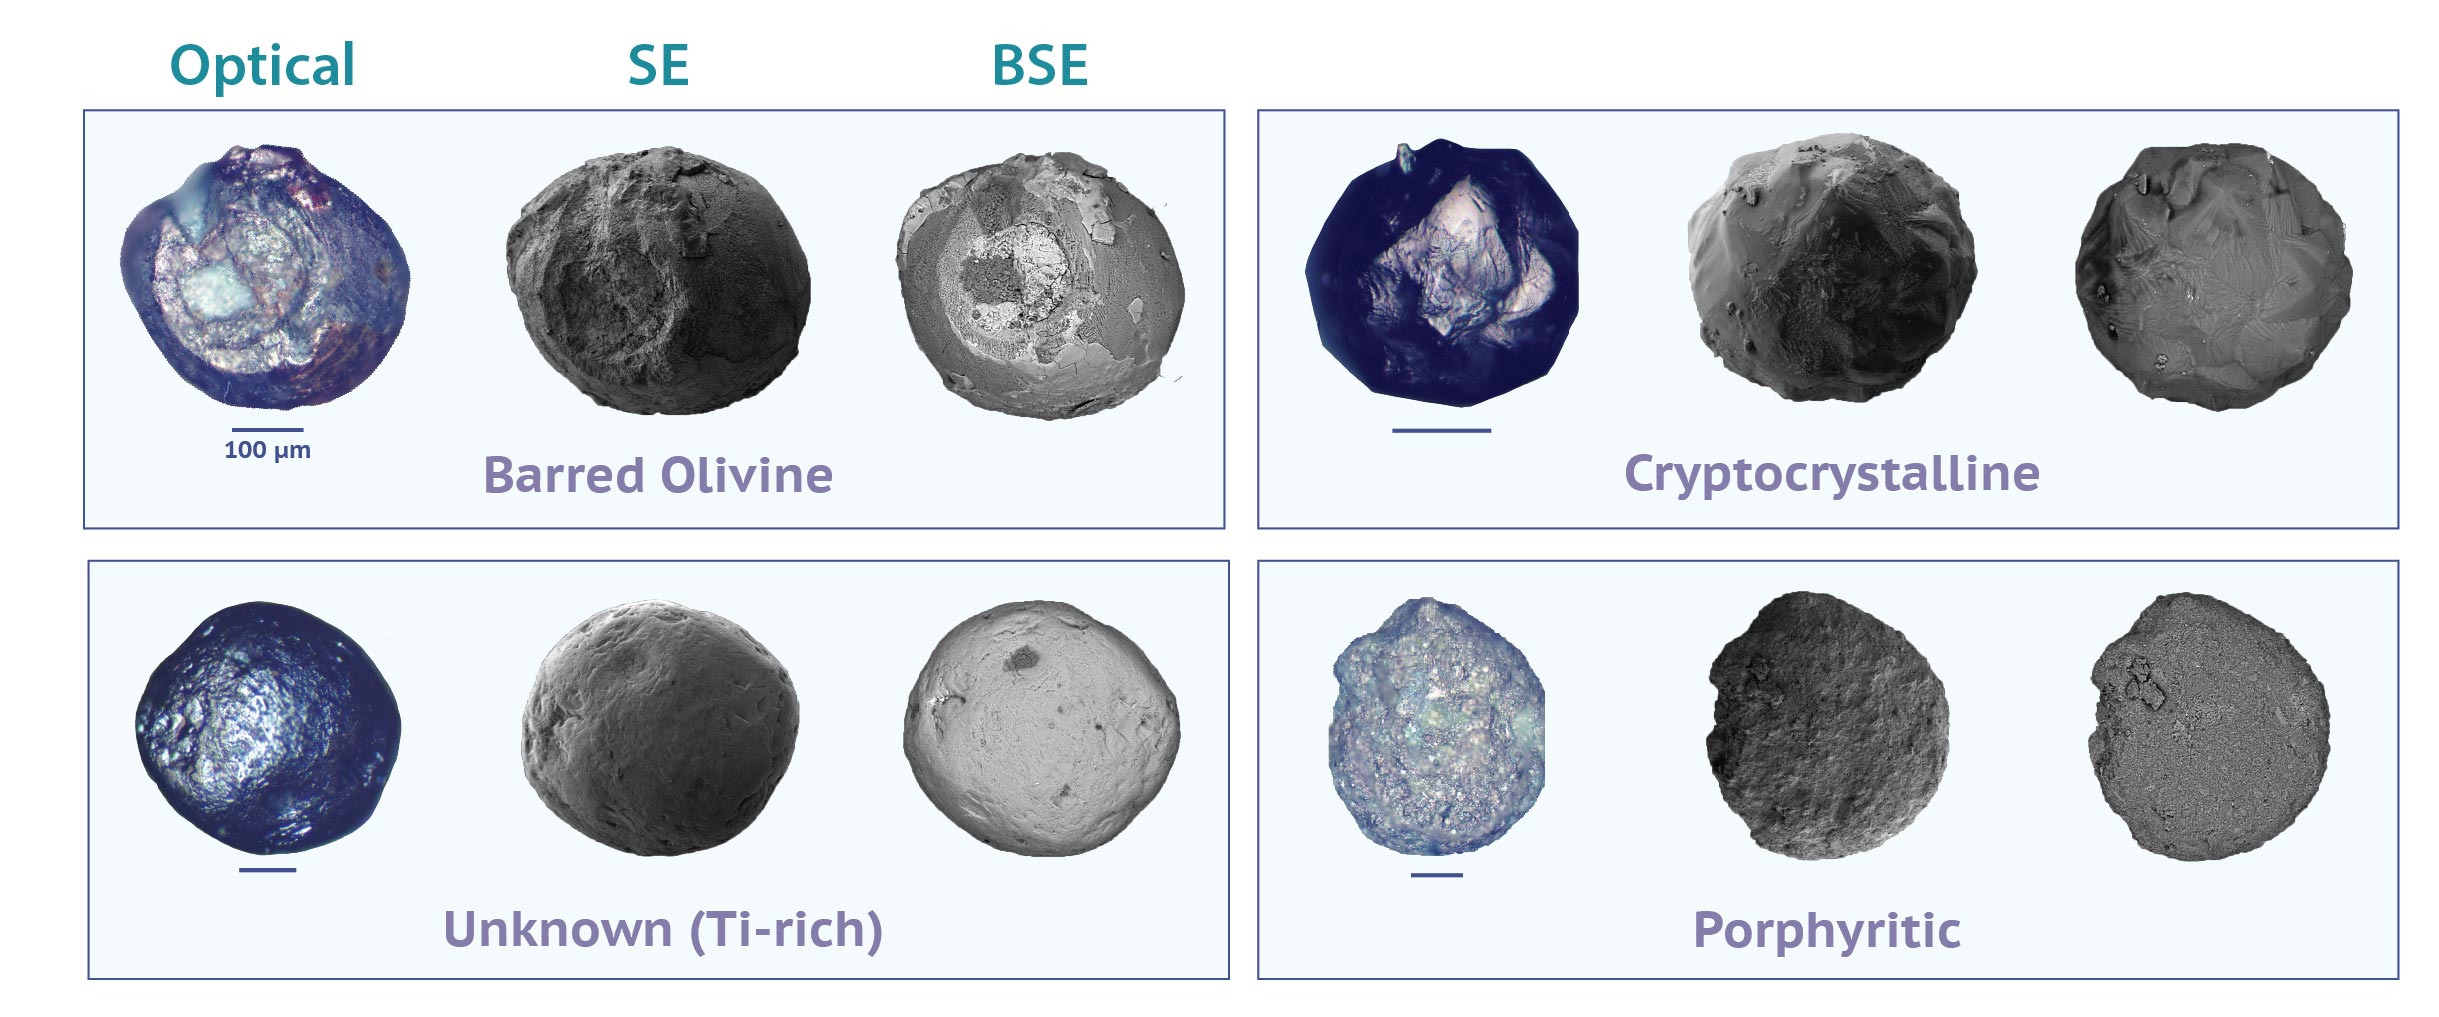
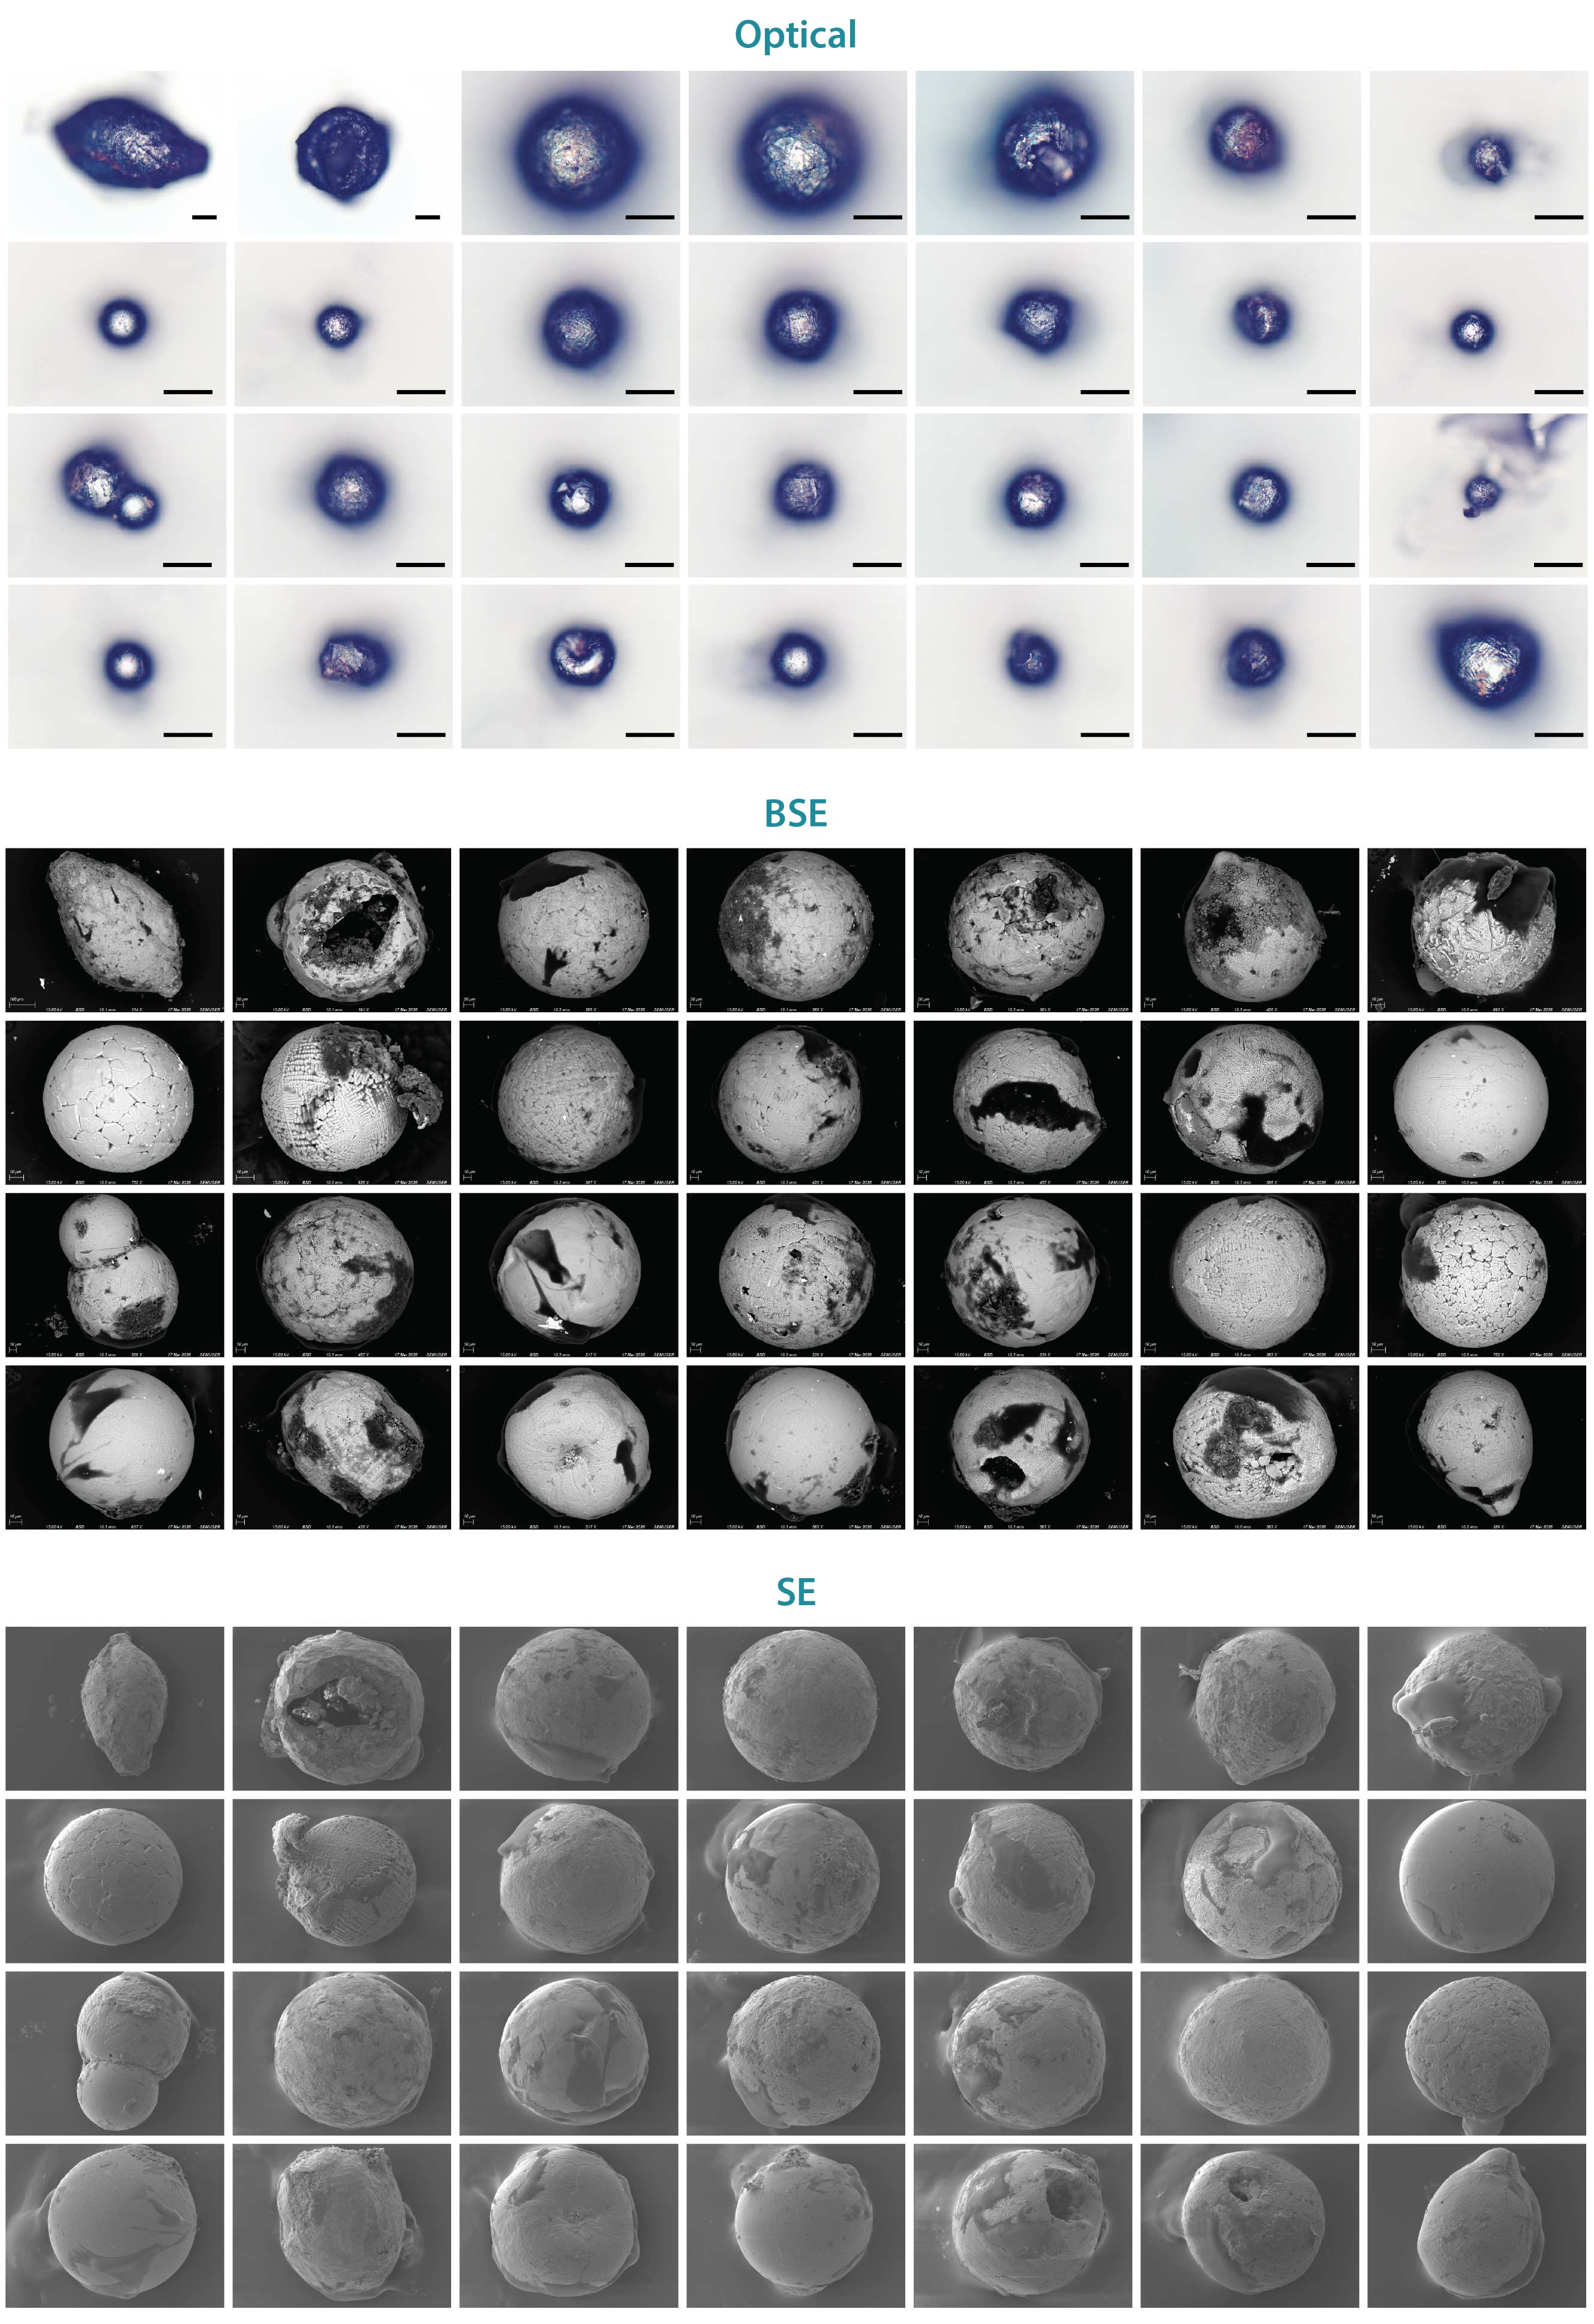
The four confirmed Antarctic micrometeorites were imaged using optical and scanning electron microscopy (BSE and SE) (Figure 4). They were classified based on criteria outlined in Genge et al. (2008) [4].
Urban Micrometeorite
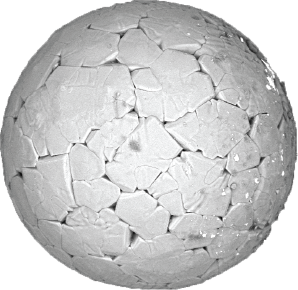
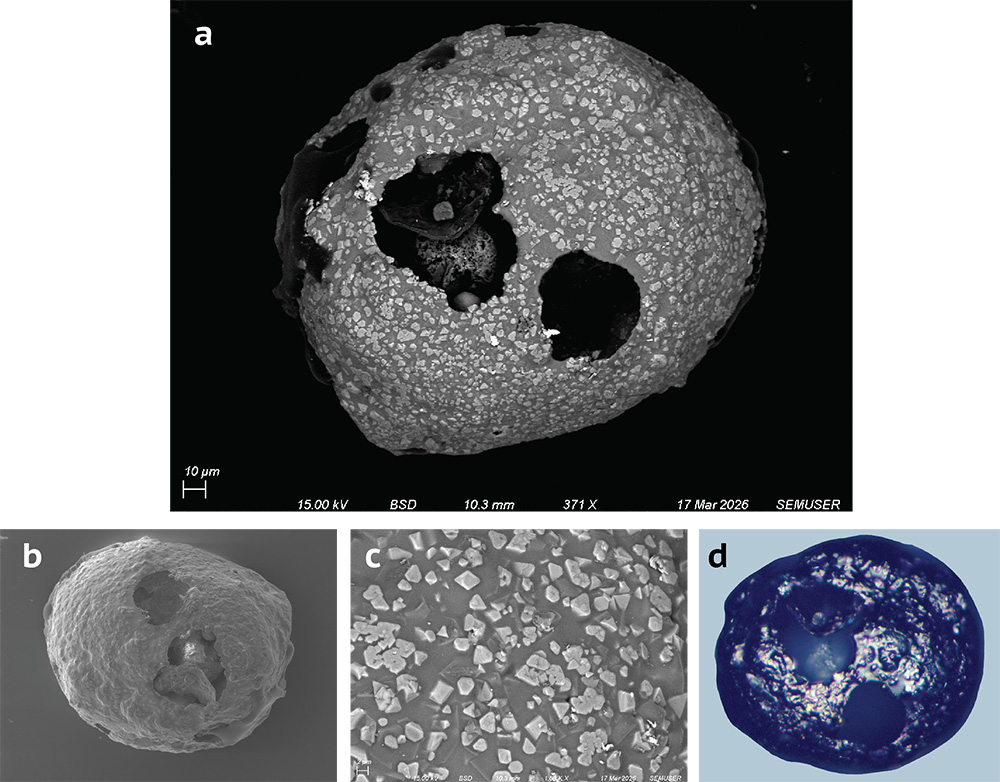
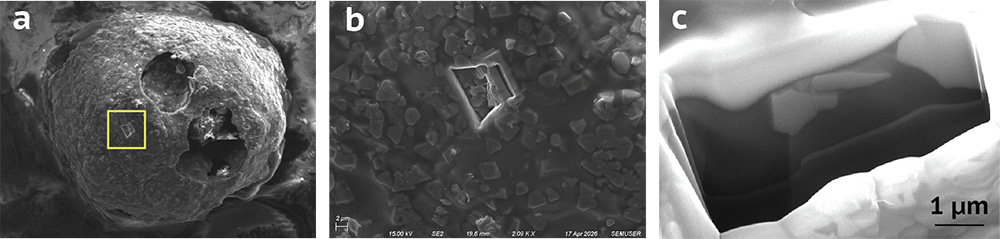
Out of the 35 spherules identified, one was determined to be a scoriaceous micrometeorite (Figure 5). This means it was only partially melted, and has retained some of its original mineral phases. It was identified based on its distinctive texture and composition, which set it apart from anthropogenically produced particles. Crystals of magnesioferrite (a Mg-Fe-oxide in the magnetite series) are intermixed with silicate minerals, likely olivine and pyroxene. Large vesicles are present where gases have escaped.
EDS
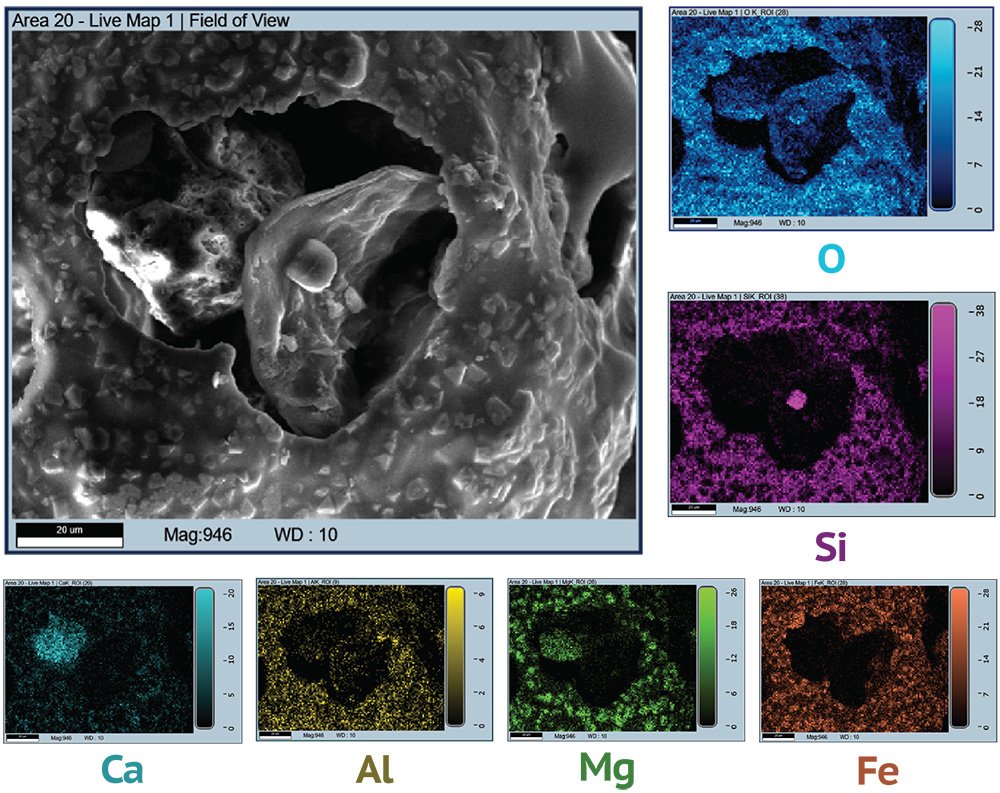
Energy dispersive X-ray spectroscopy (EDS) was used to map the distribution of elements in a section of the sample (Figure 6) and infer which mineral phases are present. The oxide crystals stand out from the silicates, appearing dark on the Si map.
FIB
Focused Ion Beam (FIB) milling was used to carve a trench into the sample in order to view crystals below the sample surface. A ~2x4 µm section was polished using the ion beam. SE imaging highlights at least three different mineral phases (Figure 7).
Industrial Spherules
The remaining 34 spherules were most likely anthropogenically produced. They were examined using optical, BSE, and SE imaging.
Iron Oxide Spherules
Most of the spherules are composed of iron oxide with minor amounts of other elements (Figure 8). It is possible that some of these spherules may be extraterrestrial in origin, and could be classified as I-type cosmic spherules. However, it is impossible to tell from the analysis conducted here, as none display characteristics that are unique to micrometeorites. More thorough compositional analysis, including identification of specific mineral phases, as well as isotopic analysis, could be used to confirm their origin.
Silicate Spherules
A few of the spherules have silicate compositions (Figure 9). This difference can be observed most clearly in the BSE images, taken under the same contrast settings. Silicate appears darker than iron oxide since it is less dense. One silicate spherule also contains a bright rim of iron oxide. Elemental analysis indicates these particles are likely anthropogenic. Possible sources of glassy spherules include road dust and mineral wool.

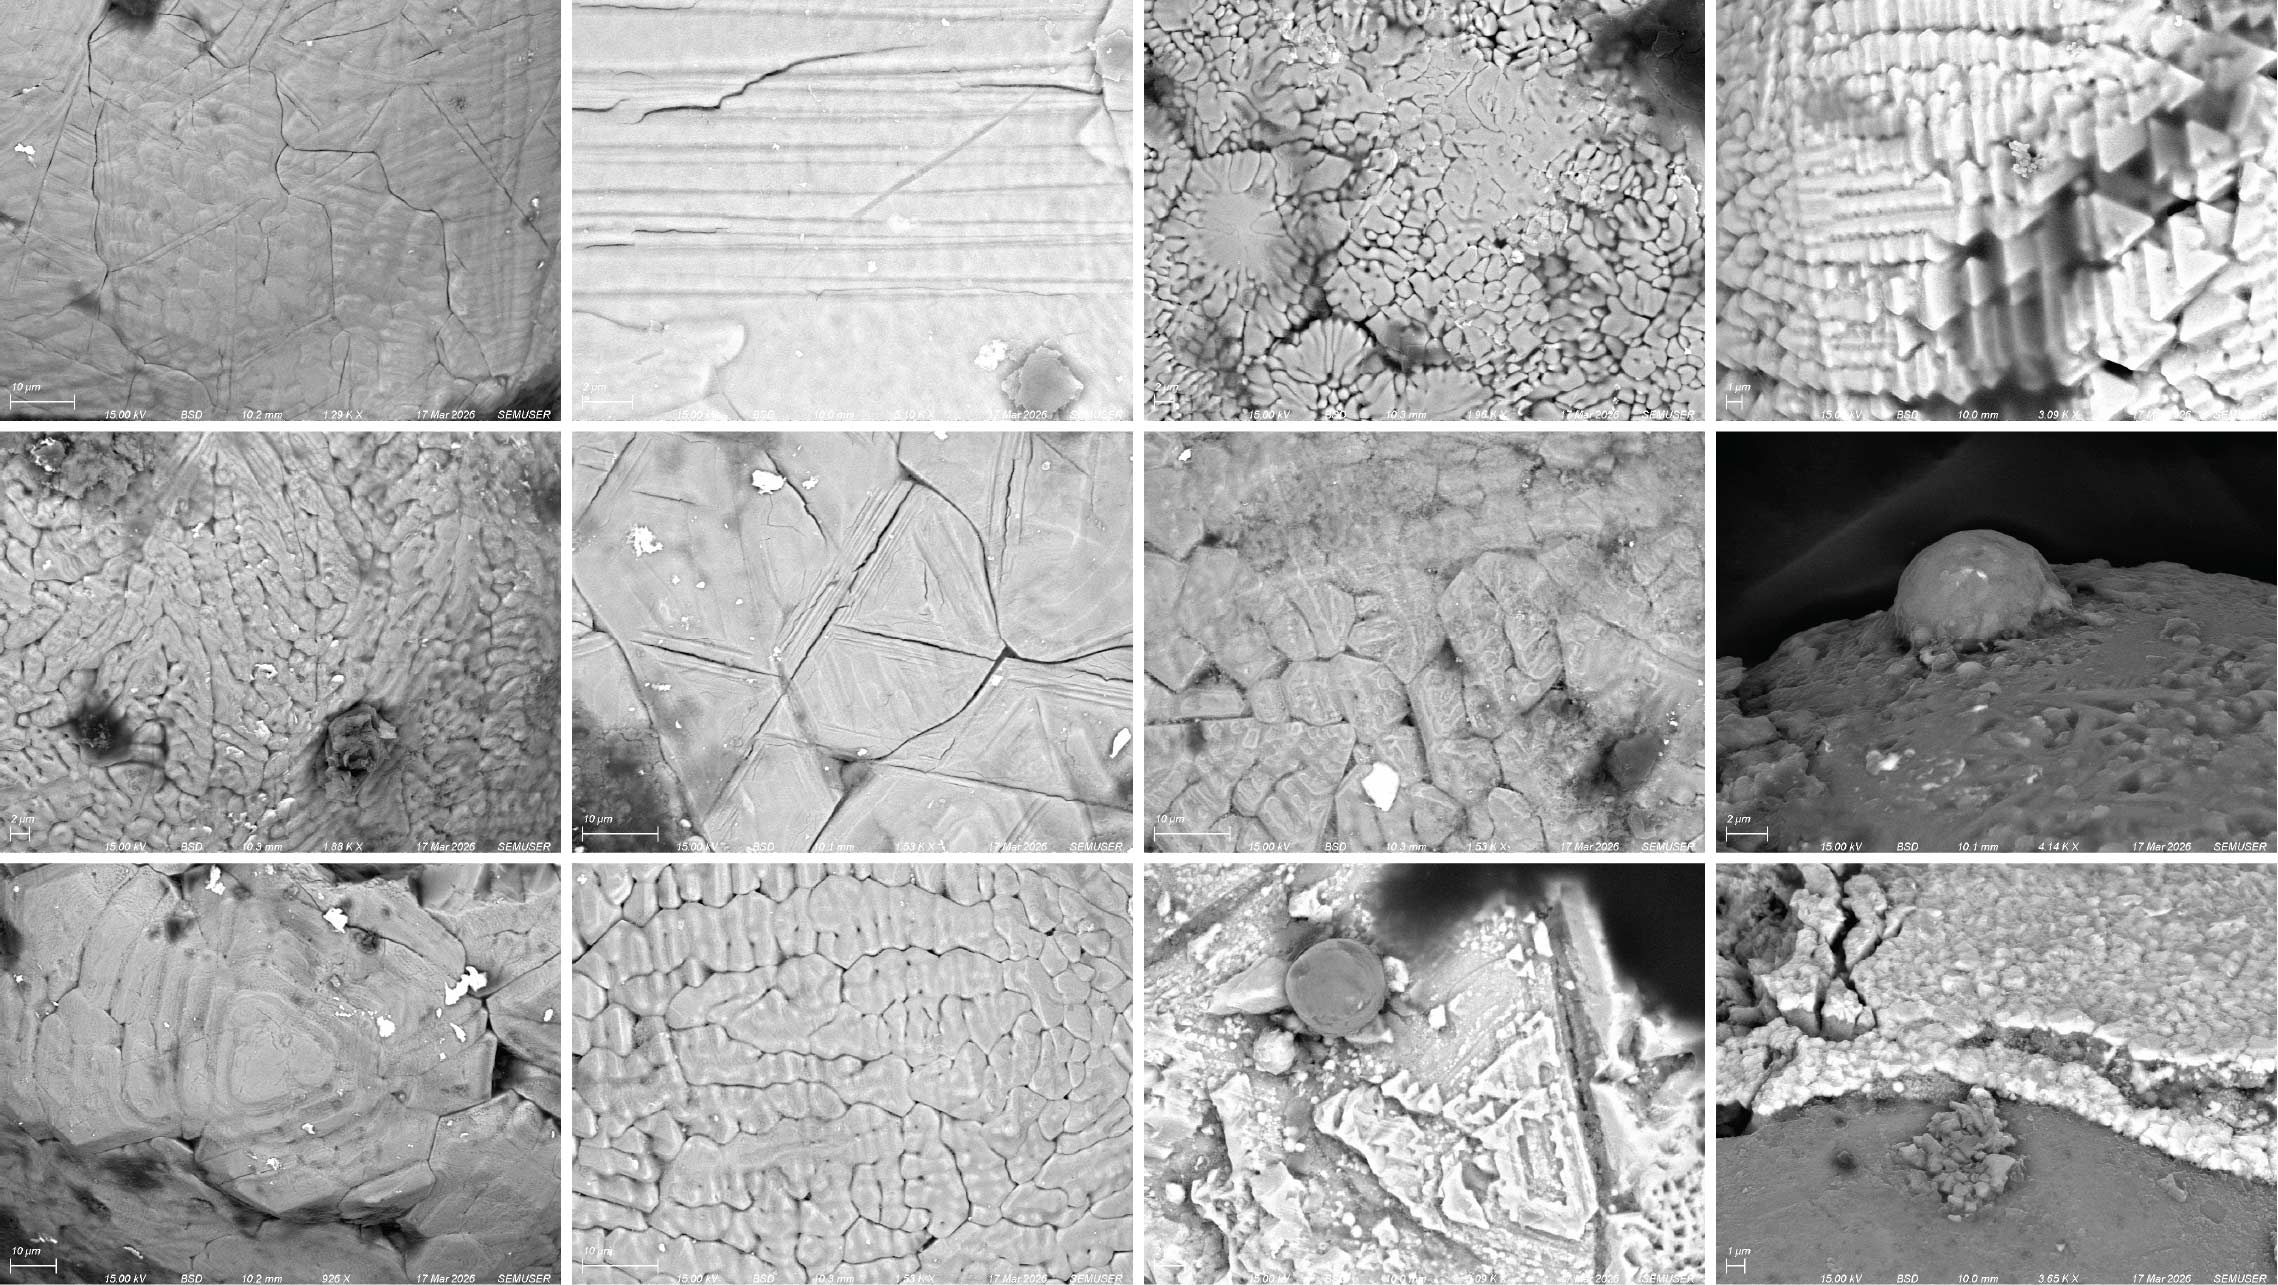
Exterior Textures
Interior Textures
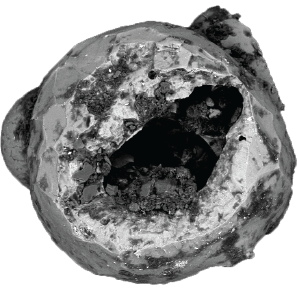
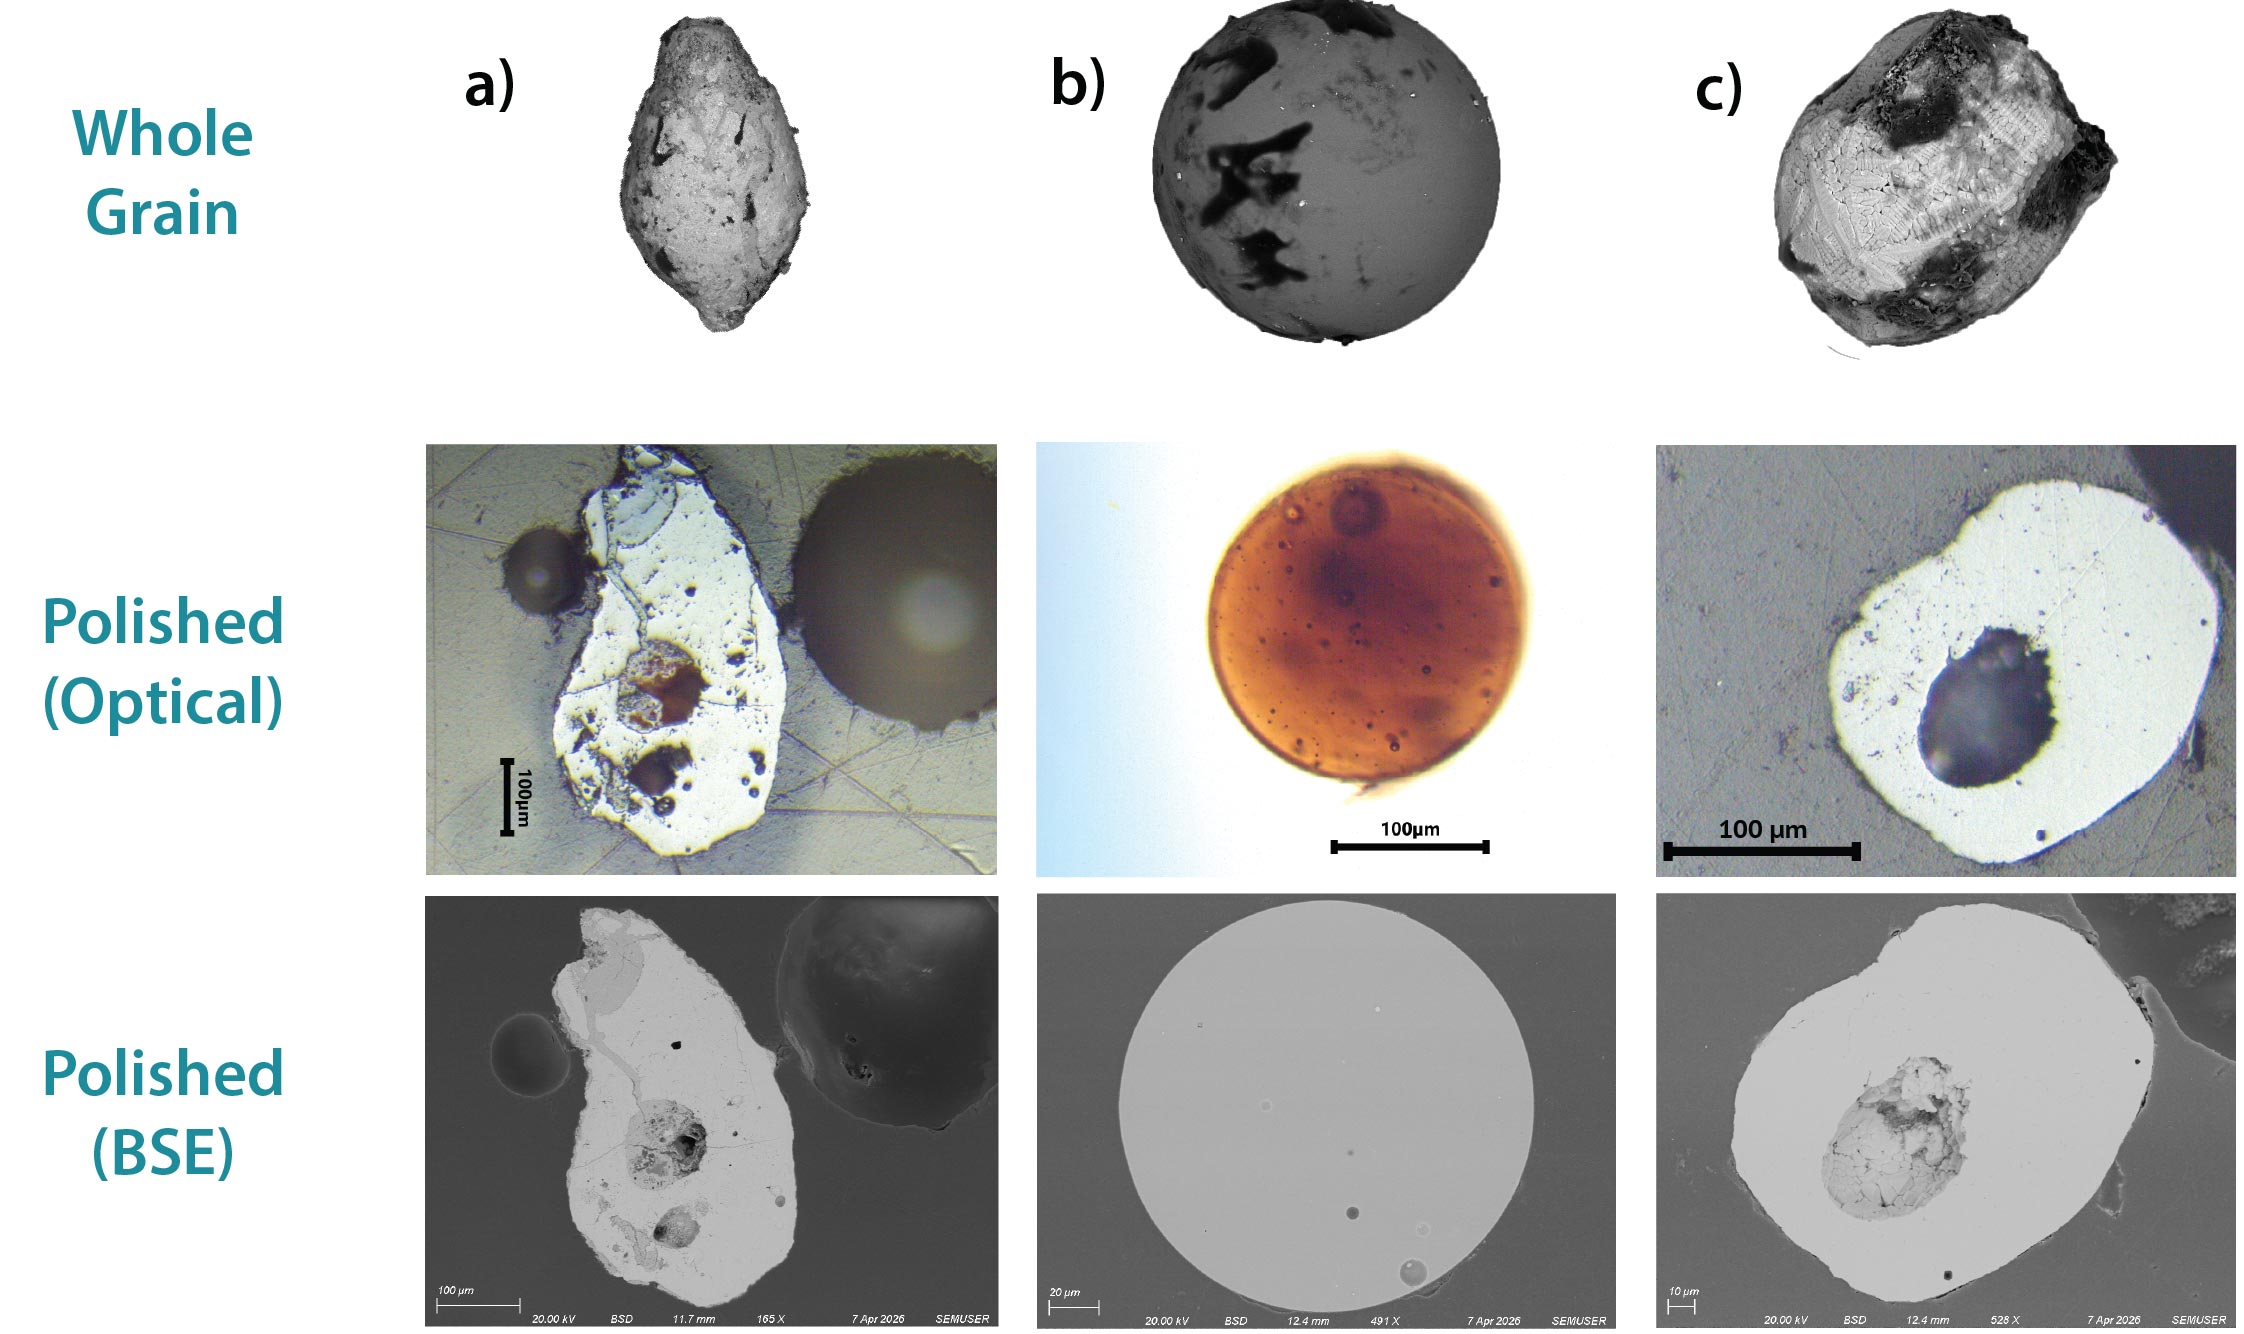
Several spherules were polished in a mechanical polisher using 1 µm alumina powder and colloidal silica. Their interiors were imaged (Figure 11). The polished samples were mostly homogeneous throughout, though two contained interior cavities.
Chemical Comparison: EDS
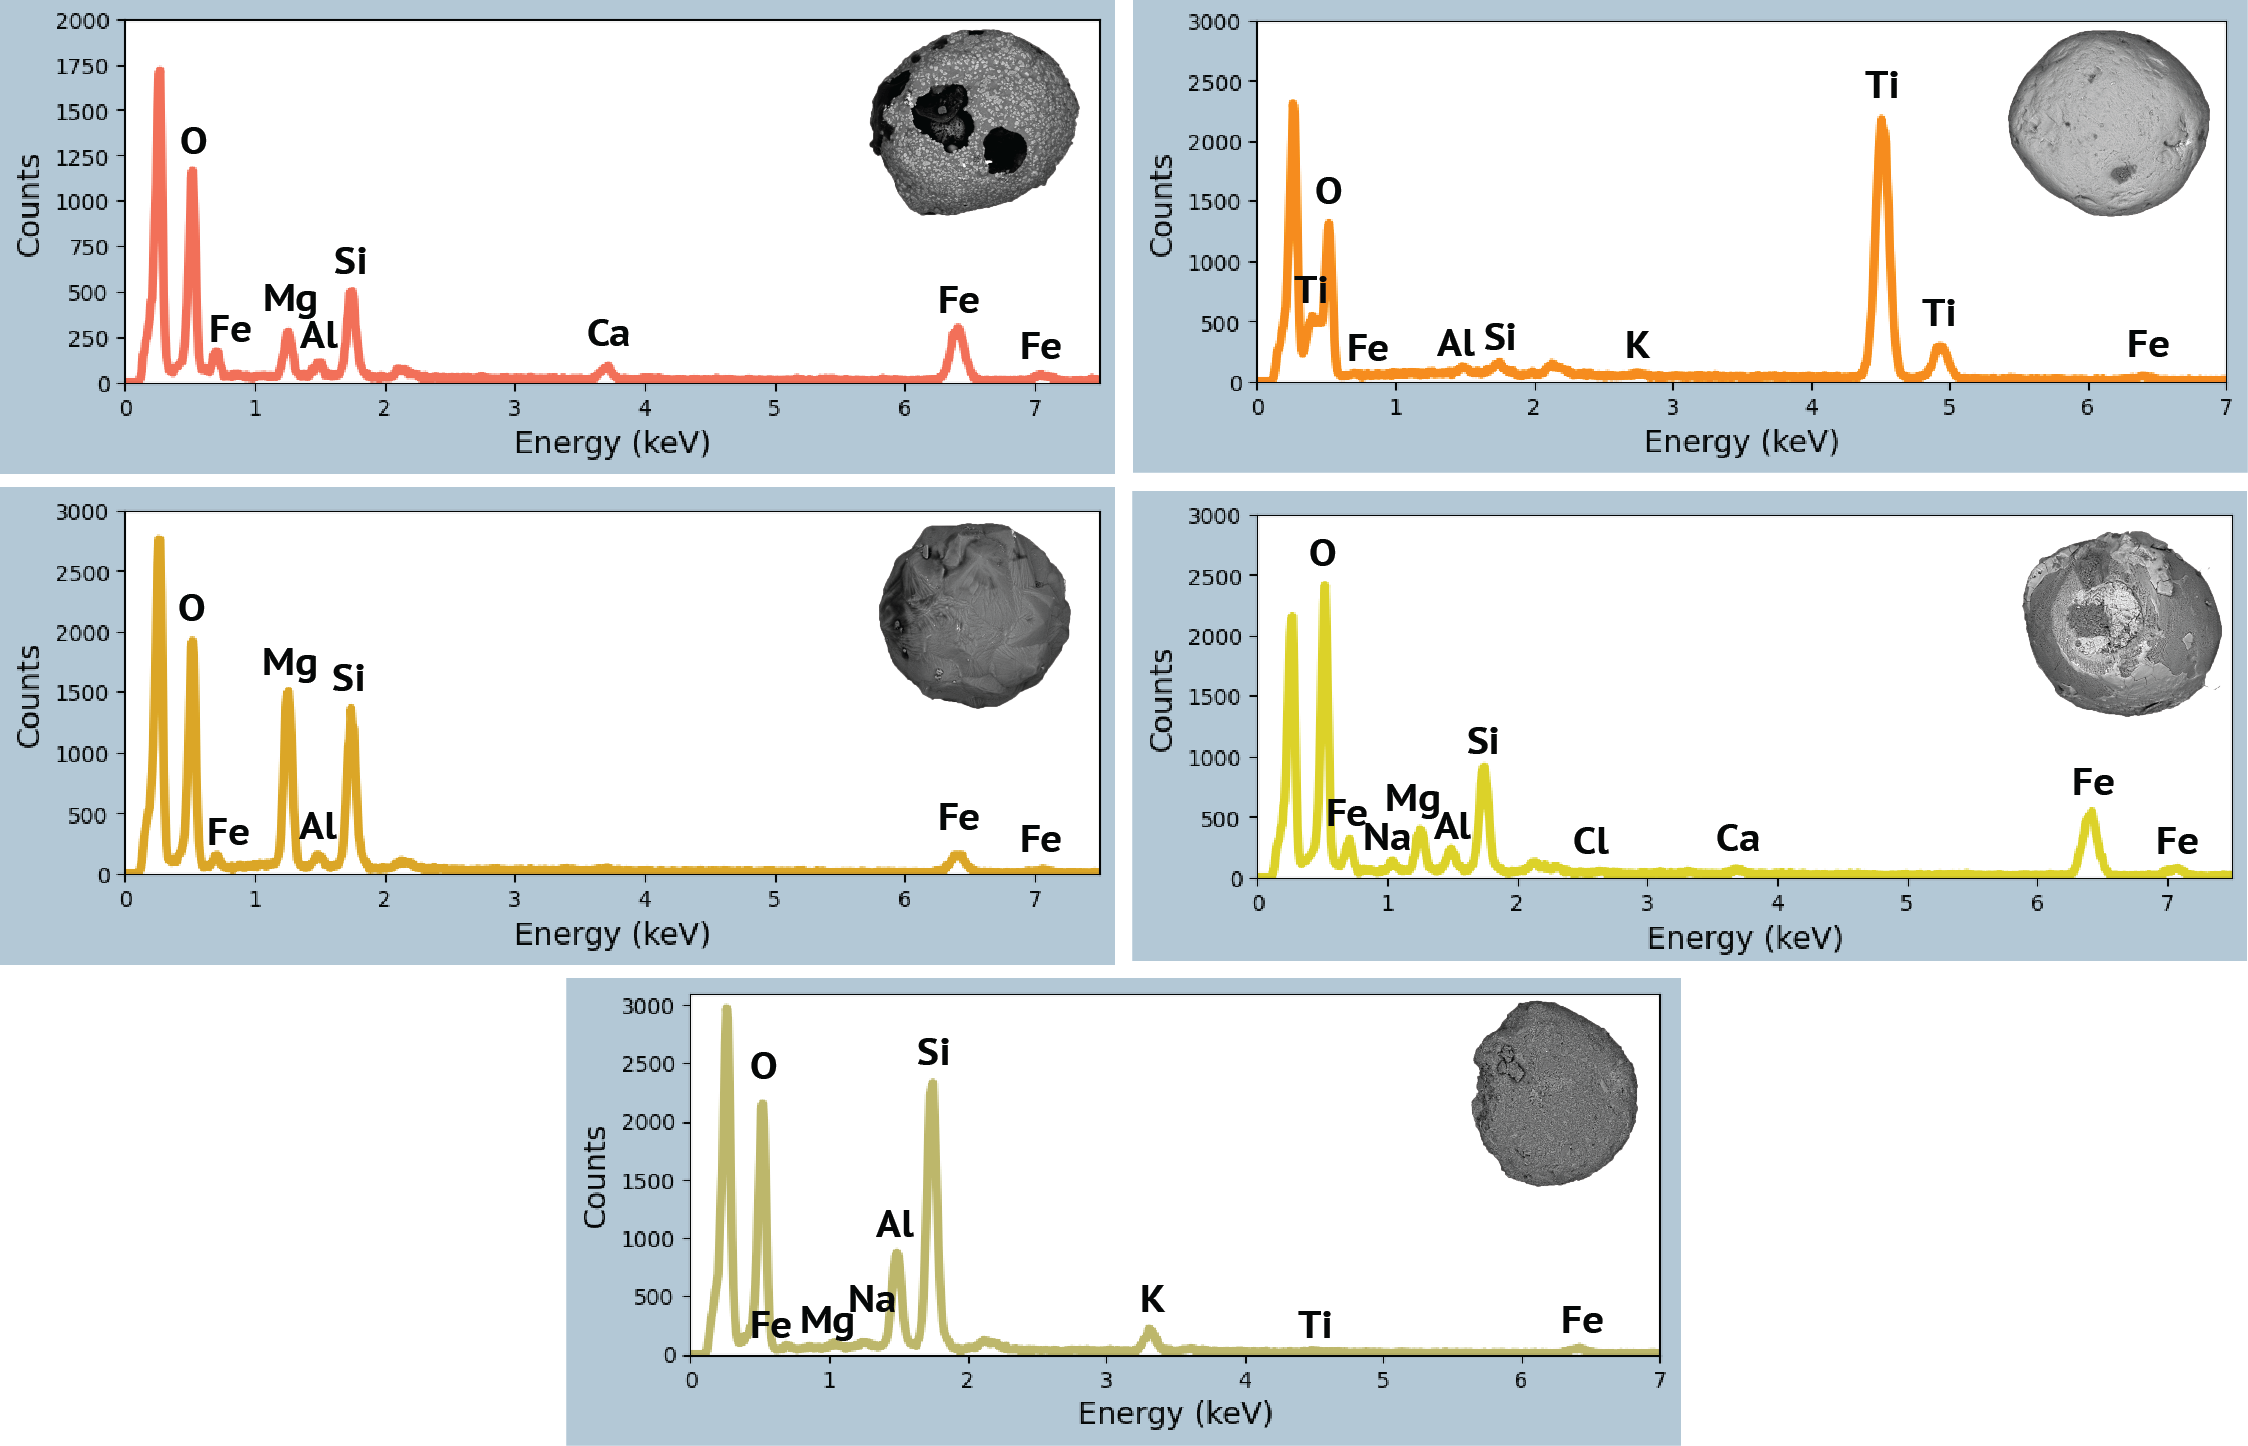
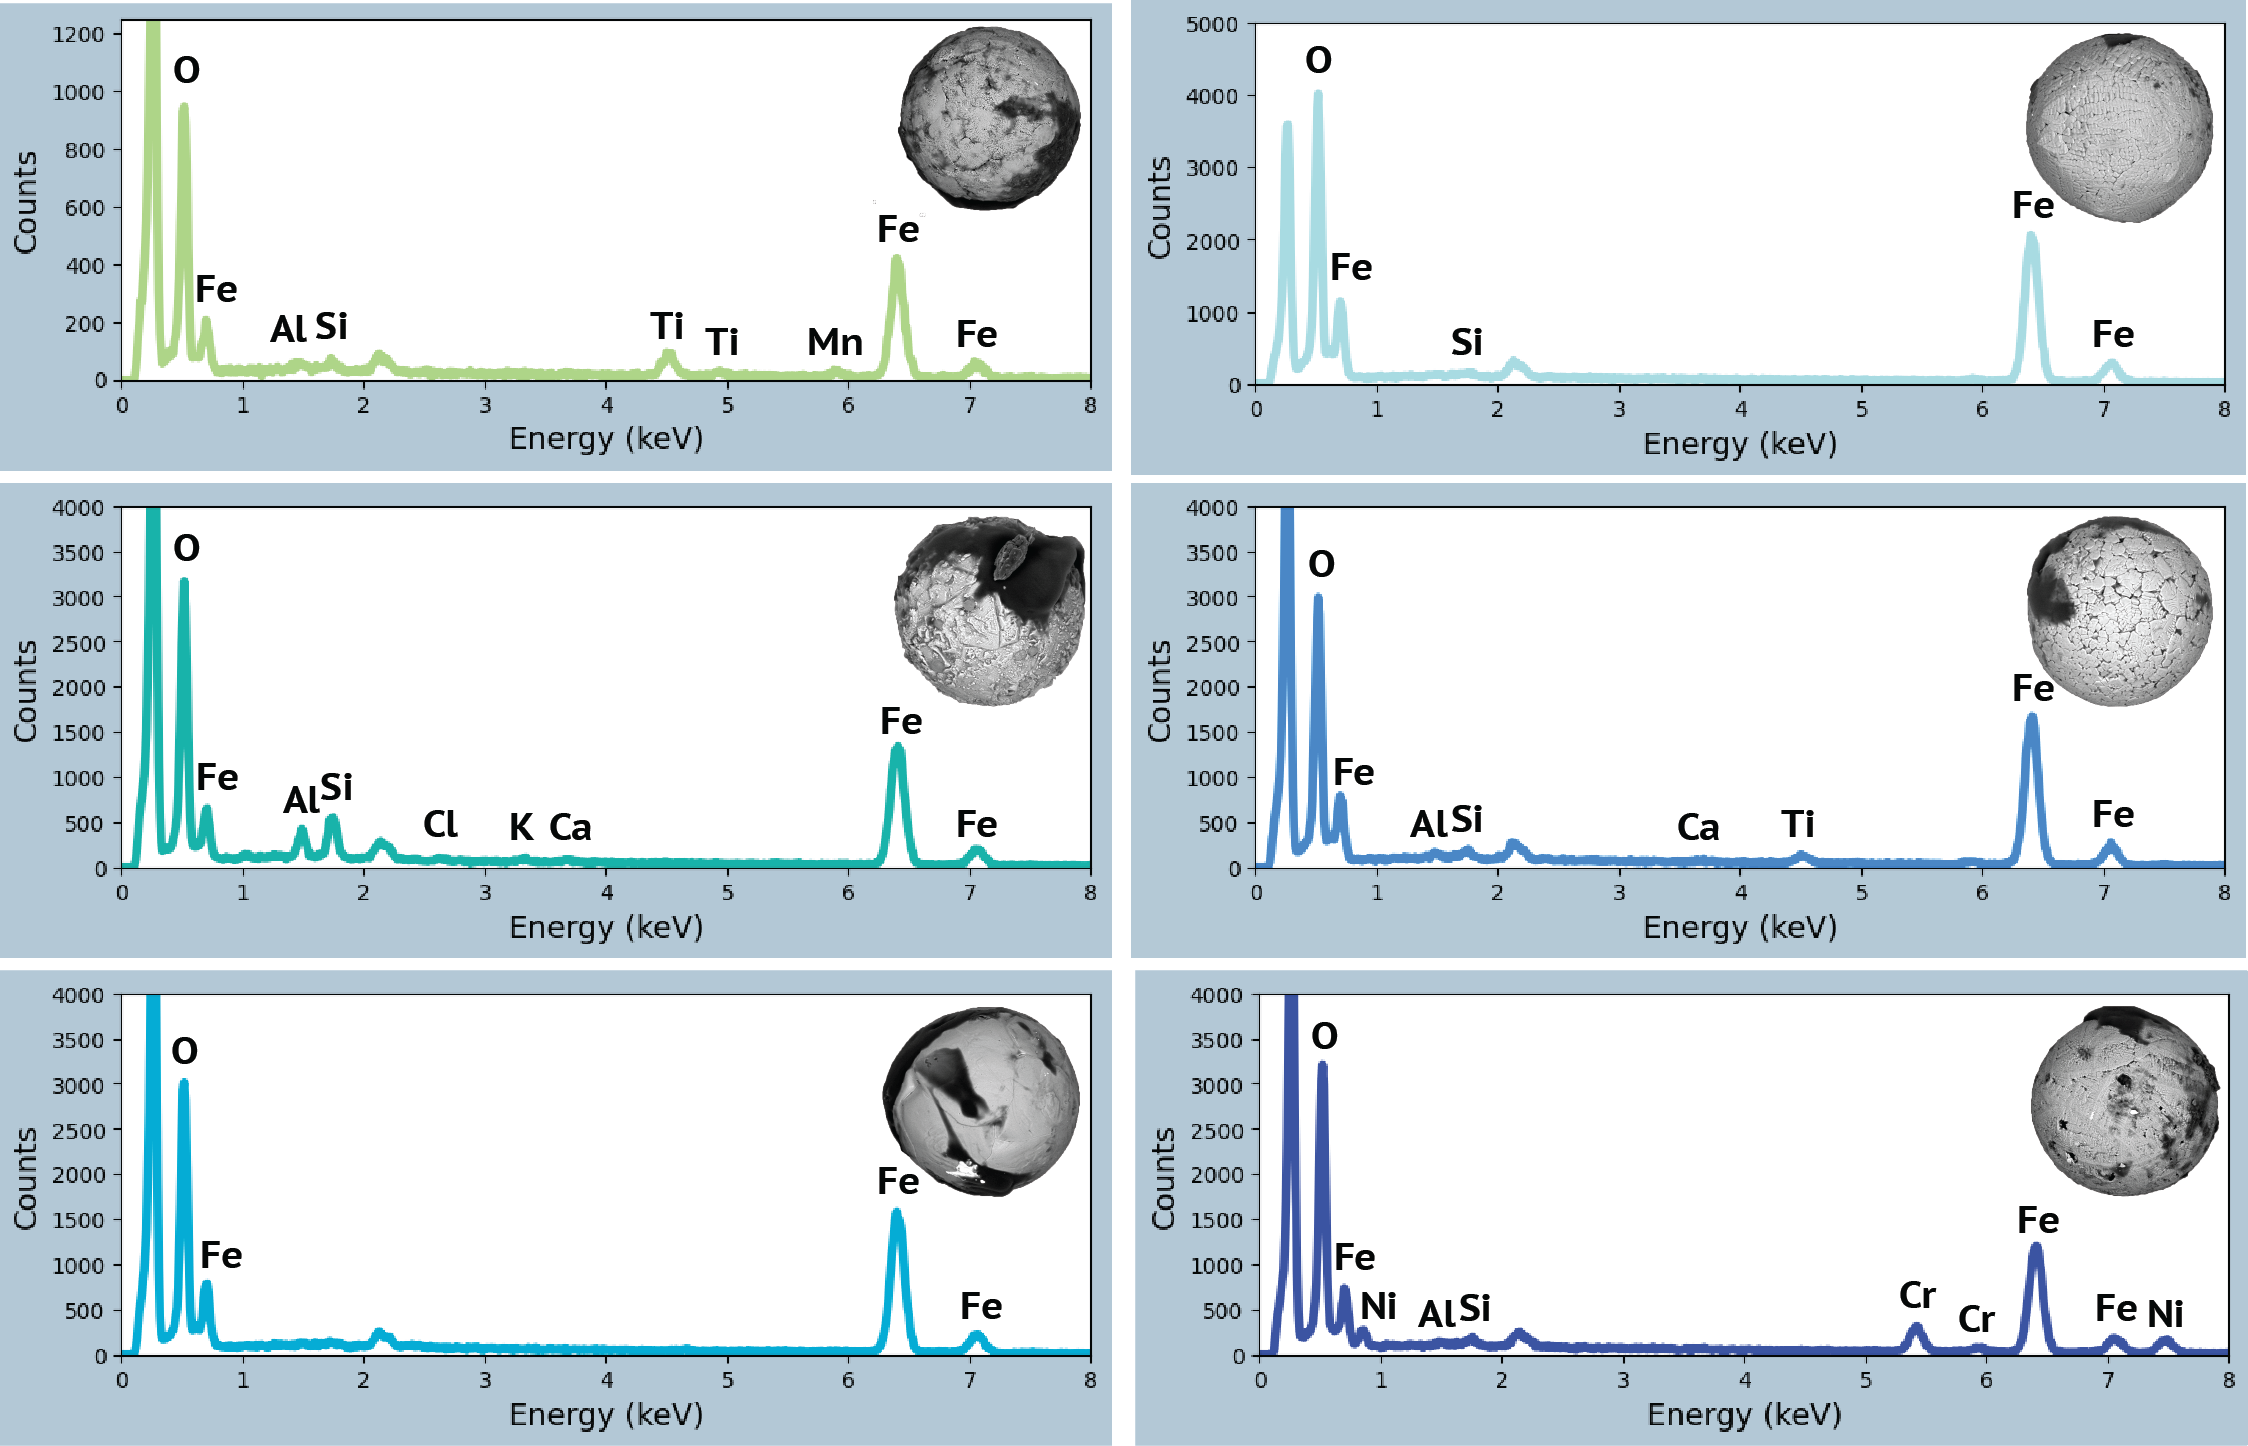
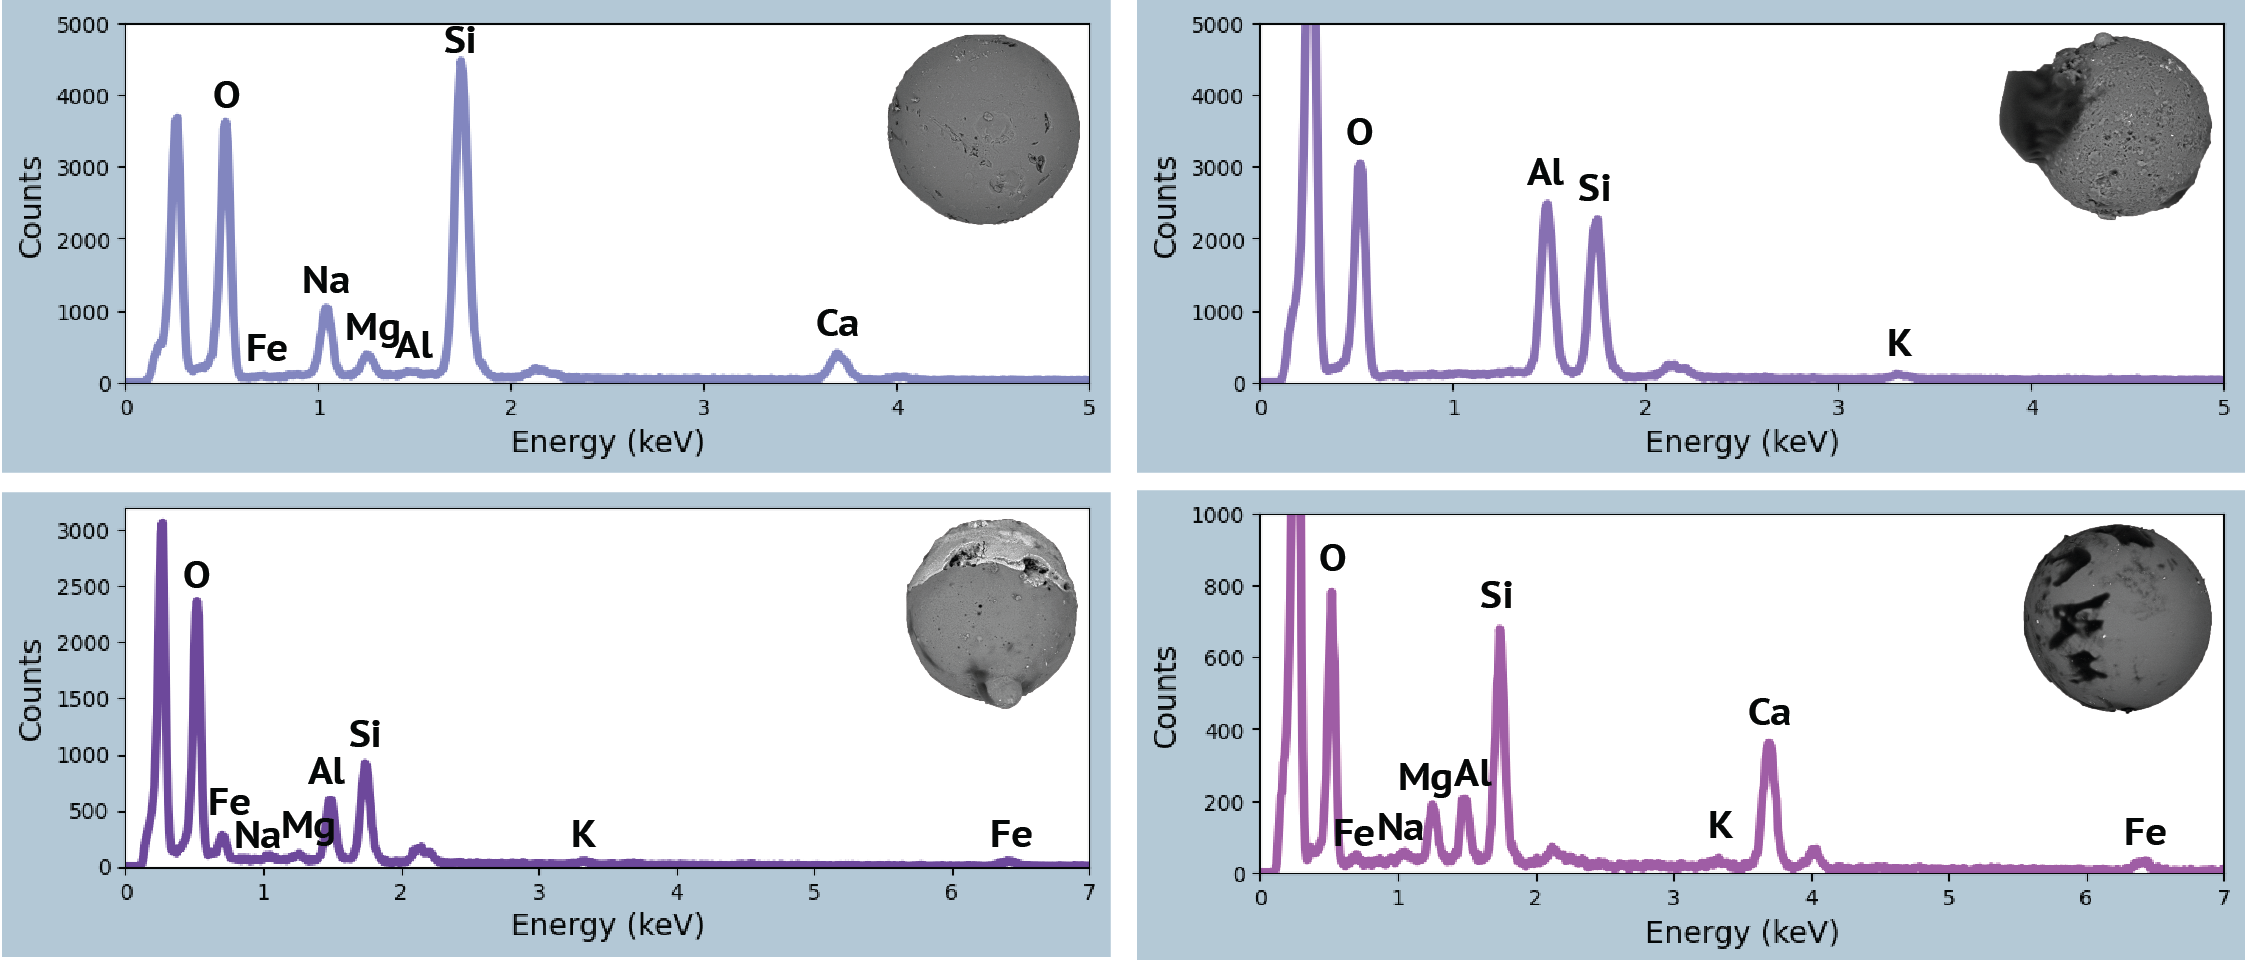
EDS spectra were collected for all of the spherules and confirmed micrometeorites at an accelerating voltage of 20 kV. Data were collected as .csv files and plotted using python (Figures 12-14). Gold peaks from the sputter-coating and carbon peaks from the tape are unlabeled.
Micrometeorites
Iron Oxide Spherules
Silicate Spherules
Other Interesting Finds
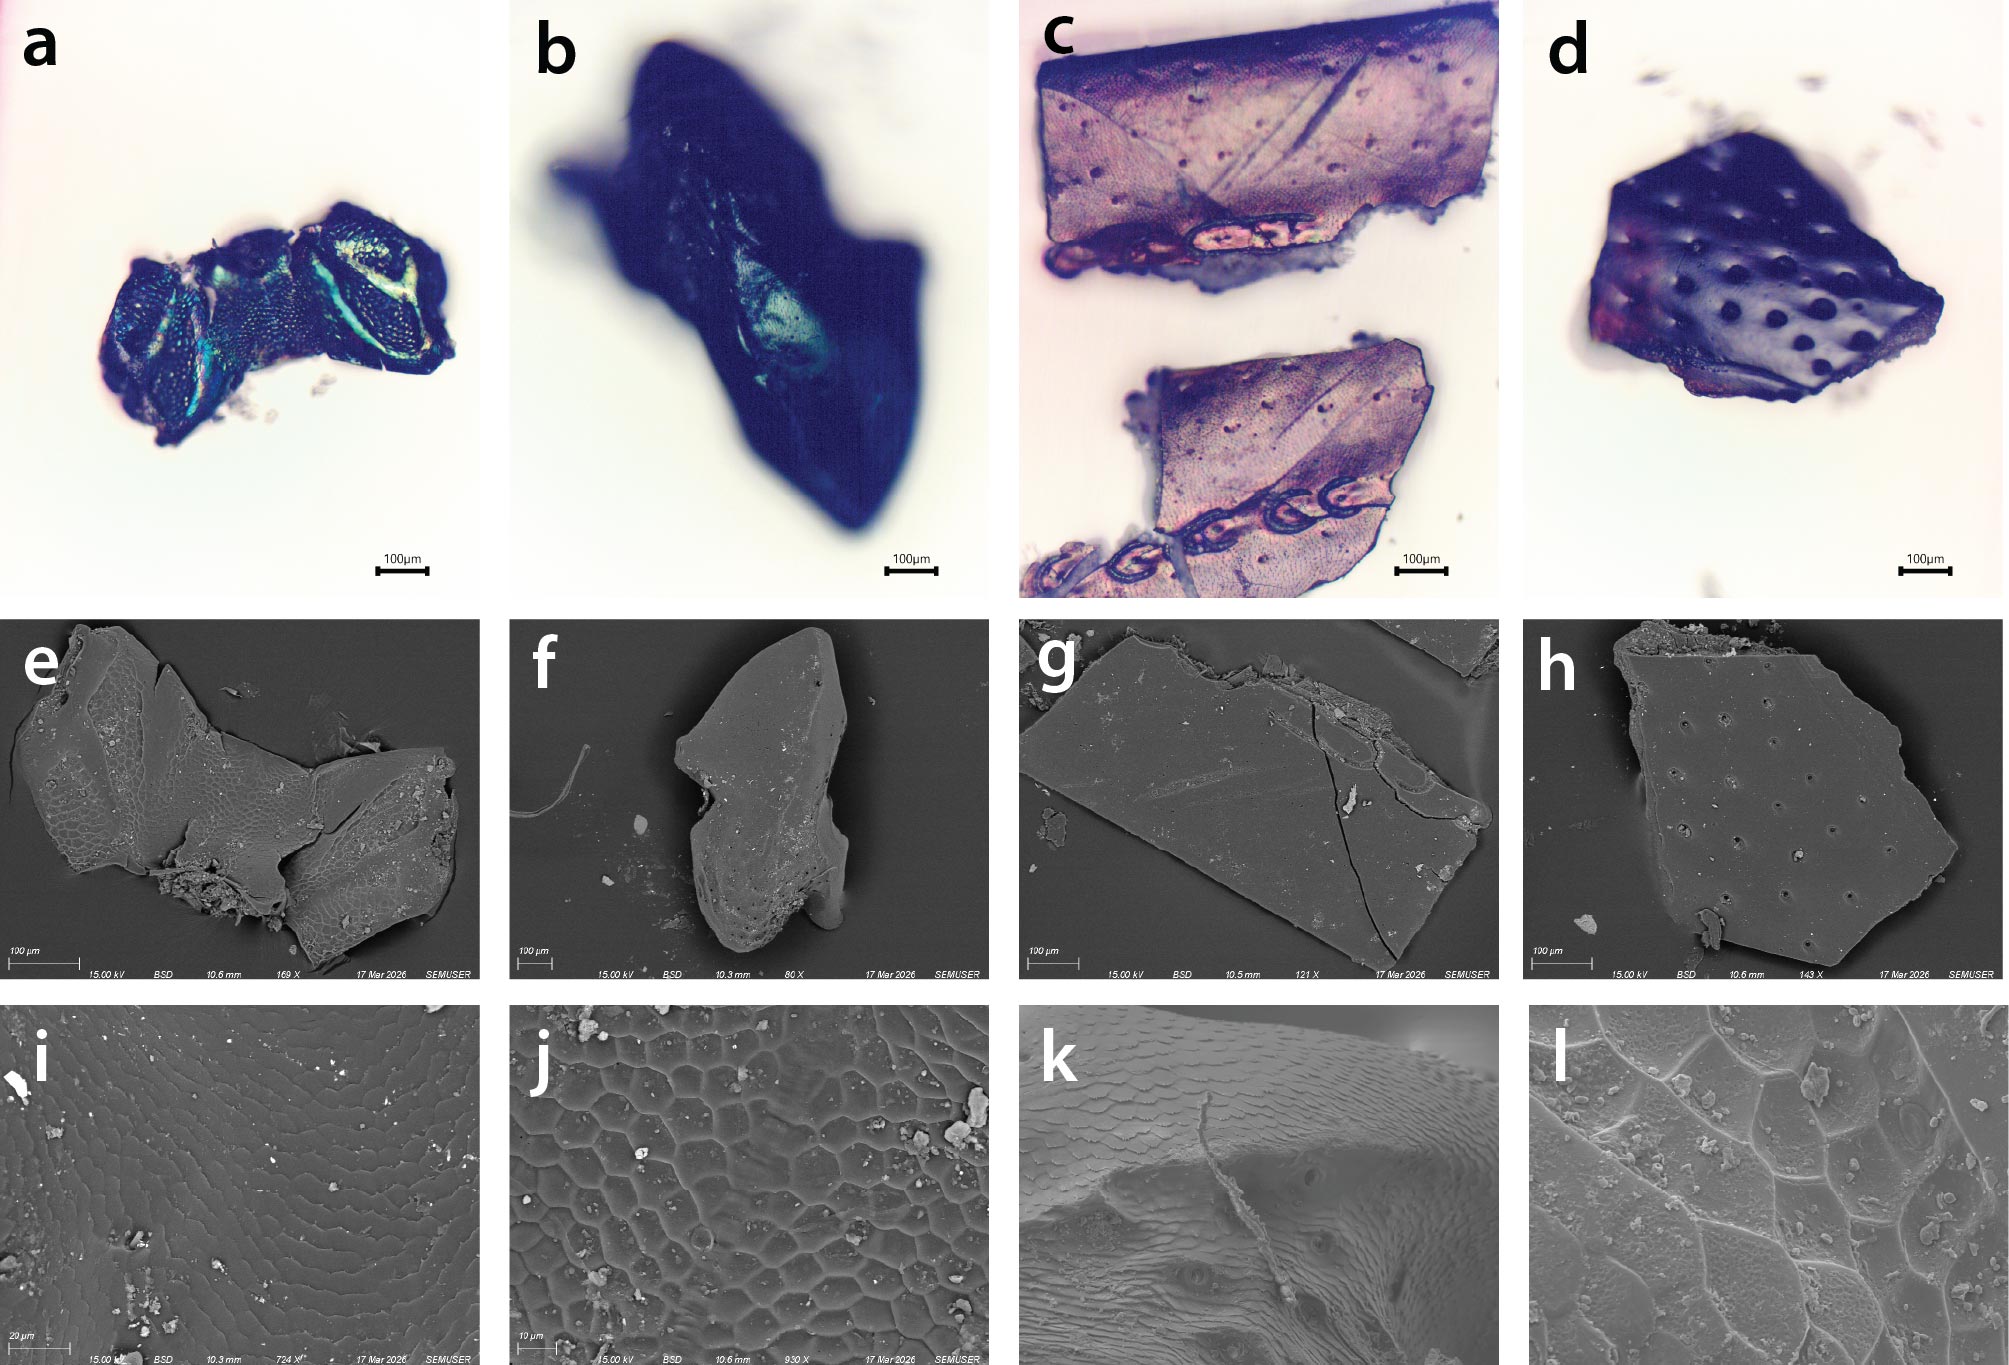
Not many spherules were found in the gutter sample. However, there were some other interesting particles, including mineral grains (Figures 15) and bug shell fragments (Figures 16), which were also imaged.

Conclusion
From only one gram of magnetic sediment, I was able to recover one confirmed micrometeorite from the rooftop of Wegmans Hall. This suggests there are likely many more micrometeorites on rooftops across campus. The SEM was instrumental in helping me to identify and classify this micrometeorite. It is possible that some of the other spherules I identified could also have an extraterrestrial origin. Future work could be done to conduct isotopic anlyses on these spherules to determine if any possess an extraterrestrial signature.
Acknowledgements
Many thanks to Minako Righter, Josh Walters, and UR Facilities for helping provide access to the Wegmans Hall rooftop. Thanks also to Sean O’Neil for his help throughout the project and especially with FIB.
References
[1] Rubin, A.E., Grossman, J.N., 2010. Meteorite and meteoroid: New comprehensive definitions. Meteorit Planet Sci 45(1), 114-122.
[2] Love, S.G., Brownlee, D.E., 1993. A Direct Measurement of the Terrestrial Mass Accretion Rate of Cosmic Dust. Science 262(5133), 550-553.
[3] Maurette, M., 2006. Micrometeorites and the mysteries of our origins. Springer, Berlin ; New York.
[4] Genge, M.J., Engrand, C., Gounelle, M., Taylor, S., 2008. The classification of micrometeorites. Meteorit Planet Sci 43(3), 497-515.
[5] van Ginneken, M., Wozniakiewicz, P.J., Brownlee, D.E., Debaille, V., Della Corte, V., Delauche, L., Duprat, J., Engrand, C., Folco, L., Fries, M., Gattacceca, J., Genge, M.J., Goderis, S., Gounelle, M., Harvey, R.P., Jonker, G., Ruggiu, L.K., Larsen, J., Lever, J.H., Noguchi, T., Peterson, S., Rochette, P., Rojas, J., Rotundi, A., Rudraswami, N.G., Suttle, M.D., Taylor, S., Van Maldeghem, F., Zolensky, M., 2024. Micrometeorite collections: a review and their current status. Philos T R Soc A 382(2273).
[6] Larsen, J., 2019. On the trail of stardust : the guide to finding micrometeorites : tools, techniques, and identification. Voyageur Press, an imprint of The Quarto Group, Beverly, MA.