Dept. of Chemical Engineering
Structural Analysis Results and Discussion
Note: Since the goal of the structural analysis was high resolution imaging of the carbon particles, a very short working distance with a large accelerating voltage was used to image the samples. As a result the depth of field was not optimized and some charging did occur which resulted in noticeable beam drift under very high magnification. Images selected below were chosen based on quality level and information availability.
Micrographs for the corroded cathode may be seen in Figure 3 below while the micrographs for the fresh cathode are presented in Figure 4. It appears that the freeze fracture method did an excellent job of preserving the cathode structure and allowing for a clean cross sectional view of the cathode carbon structure, which appears to look similar to other cathode micrographs found in literature [2]. In both cases the structure appears to be porous with carbon particle diameters in the tens of nanometers range, as expected [1]. These particles do not seem to be noticeably different in size or shape between the fresh and corroded cathode, however, the particle agglomerates do appear to differ.
It is possible that the preferential location for carbon corrosion is located at the connecting points of the particles. If this were the case, then the images below would seem to indicate that as the cathode corrodes, the particle agglomerates collapse in upon themselves resulting in larger agglomerates with less distinct carbon particles. Looking at the 50k magnification images of the corroded UEA in Figure 3, there does appear to be larger "chunks" of carbon with barely discernable particles embedded within them. Additionally, and this is of course subjective, the porosity appears to have decreased with the corroded cathodes when compared to a fresh cathode. This would indicate there does exist some structural collapse resulting from carbon corrosion.
As an additional note, the micrographs of the fresh cathode do a particularly good job of showing how the platinum is dispersed on the carbon particles. Despite small physical vibrations causing irregularities in the micrograph, the 300k magnification image of the fresh UEA shows small brighter dots present on the larger carbon particles. These dots are in fact the platinum particles, which are generally in the 1 to 5 nanometer diameter range [1]. It is truly fascinating to be able to observe this and one of the more pleasant surprises experienced while completing this work.
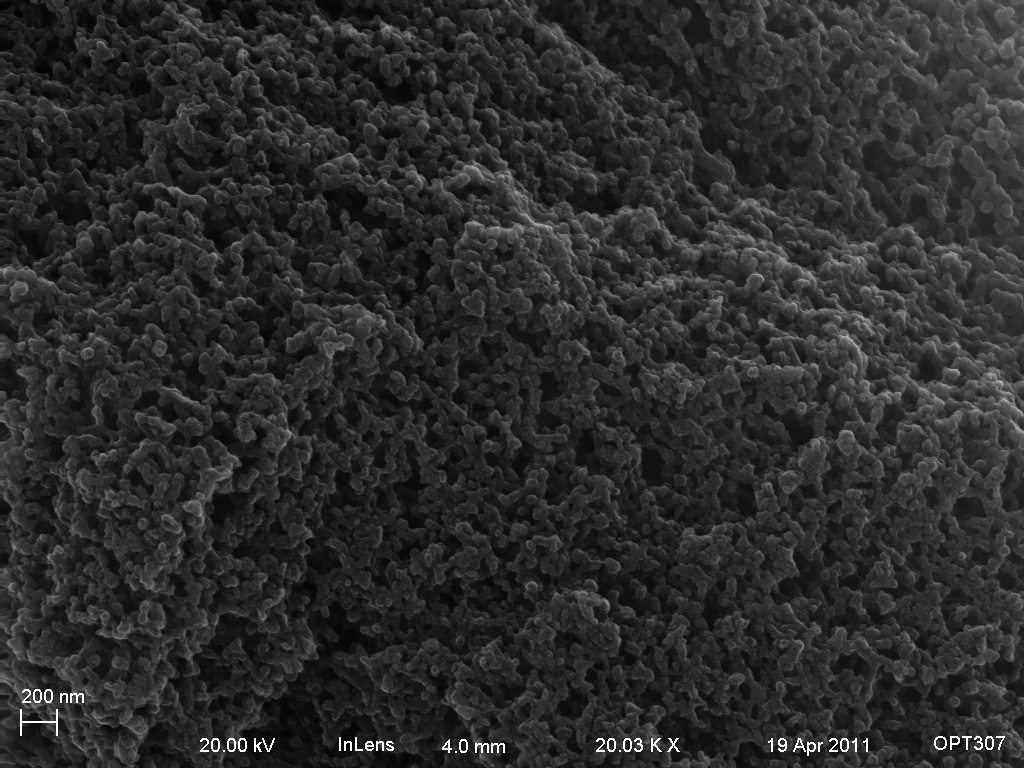

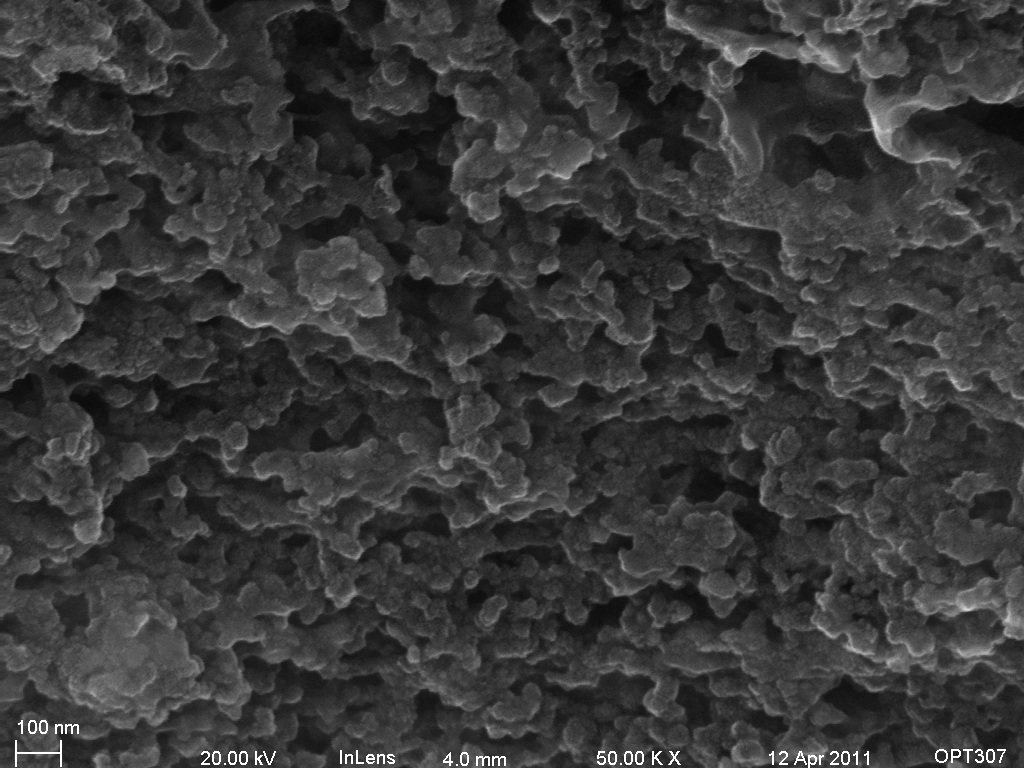
Figure 3: Field emission SEM micrographs of a cathode with 12% by weight carbon loss.
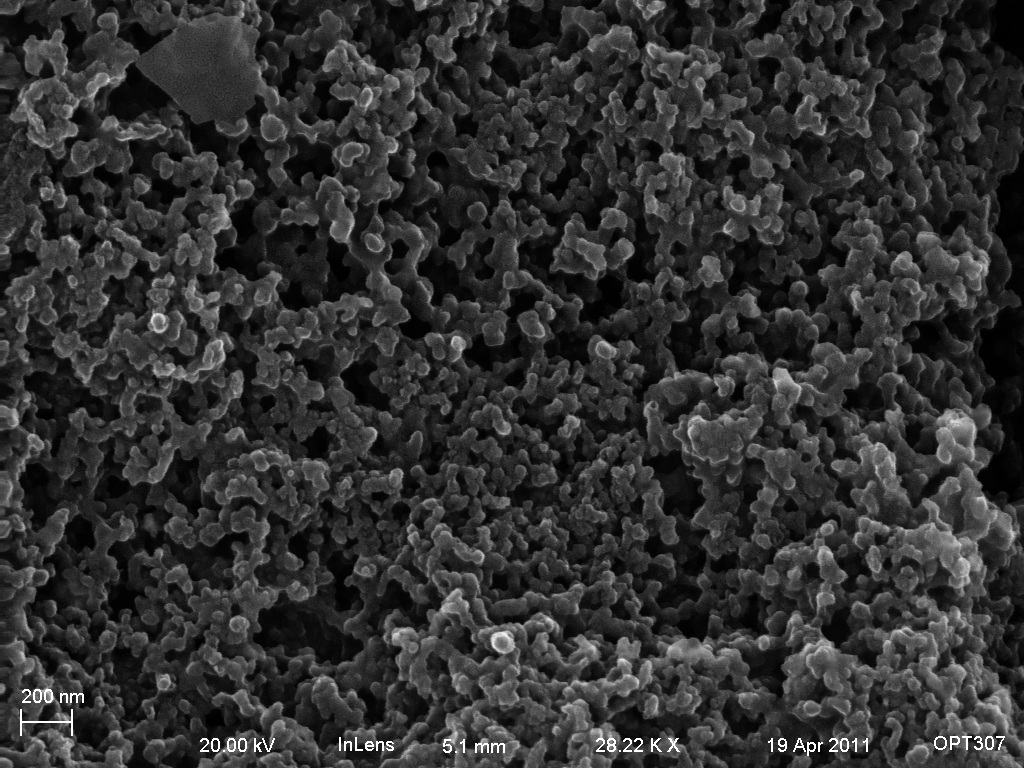
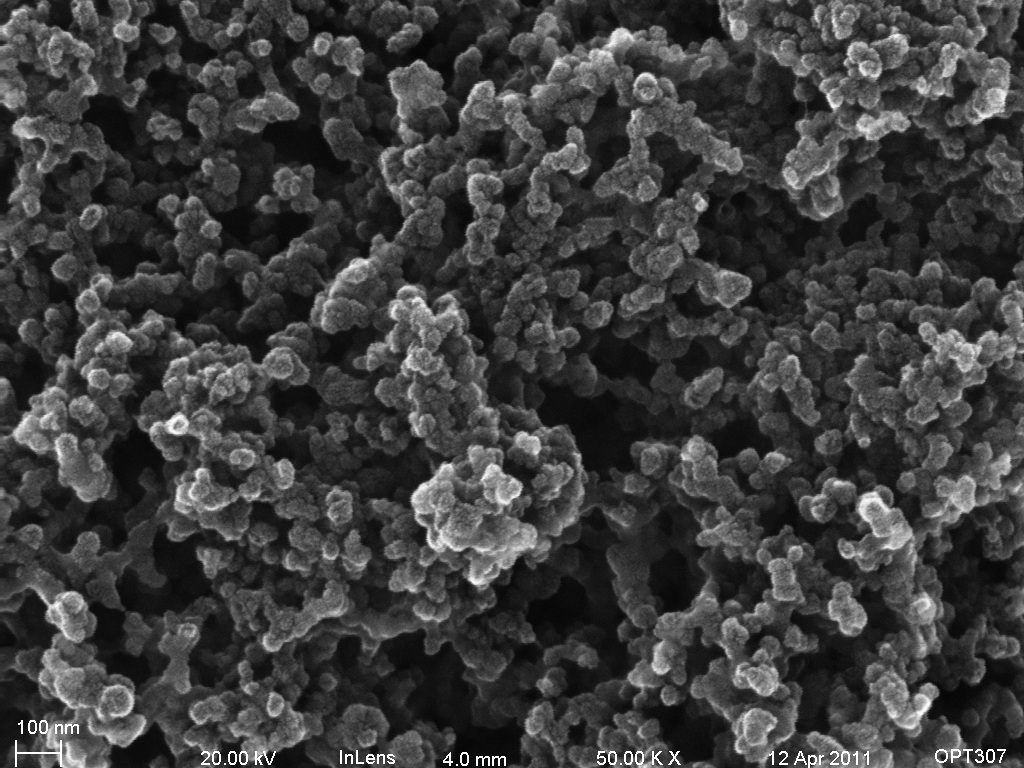
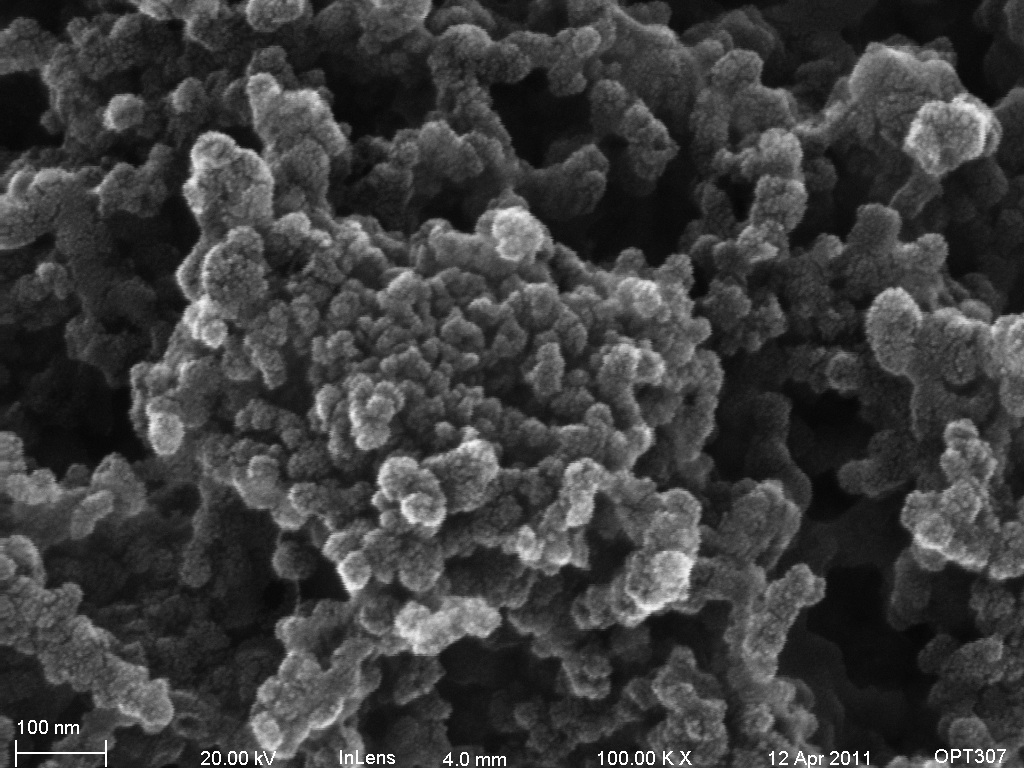
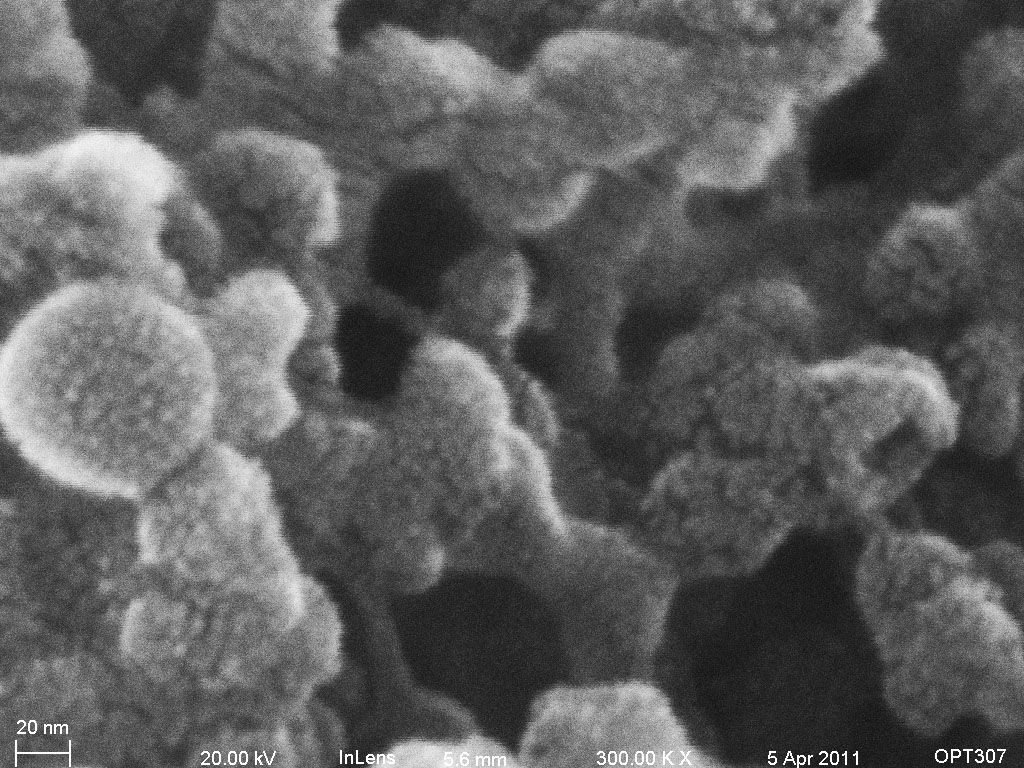
Figure 4: Field emission SEM micrographs of a fresh cathode.
In addition to the micrographs collected, x-ray microanalysis was done on the two samples to qualify the presence of different elements in the samples. As expected, there exists carbon and platinum, the two main ingredients in the cathode. However I also observed oxygen, fluorine, and iron. The oxygen is likely a result of platinum oxides formed in the cathode electrode. There is evidence that the platinum oxide adsorbance can be quite strong and take on the order of minutes to hours to desorb. Since these samples were only in vacuum for about 30 minutes before the spectra were taken, it is not surprising to observe oxygen. The fluorine is likely present from the ionomer which is used to coat the cathode catalyst, providing an avenue for ionic transport. Finally, the iron may simply be a byproduct of the catalyst processing. The presence of iron in an MEA is cause for major concern because it is a known membrane chemical decomposition catalyst. There were no significant differences observed between the corroded and fresh MEA samples.
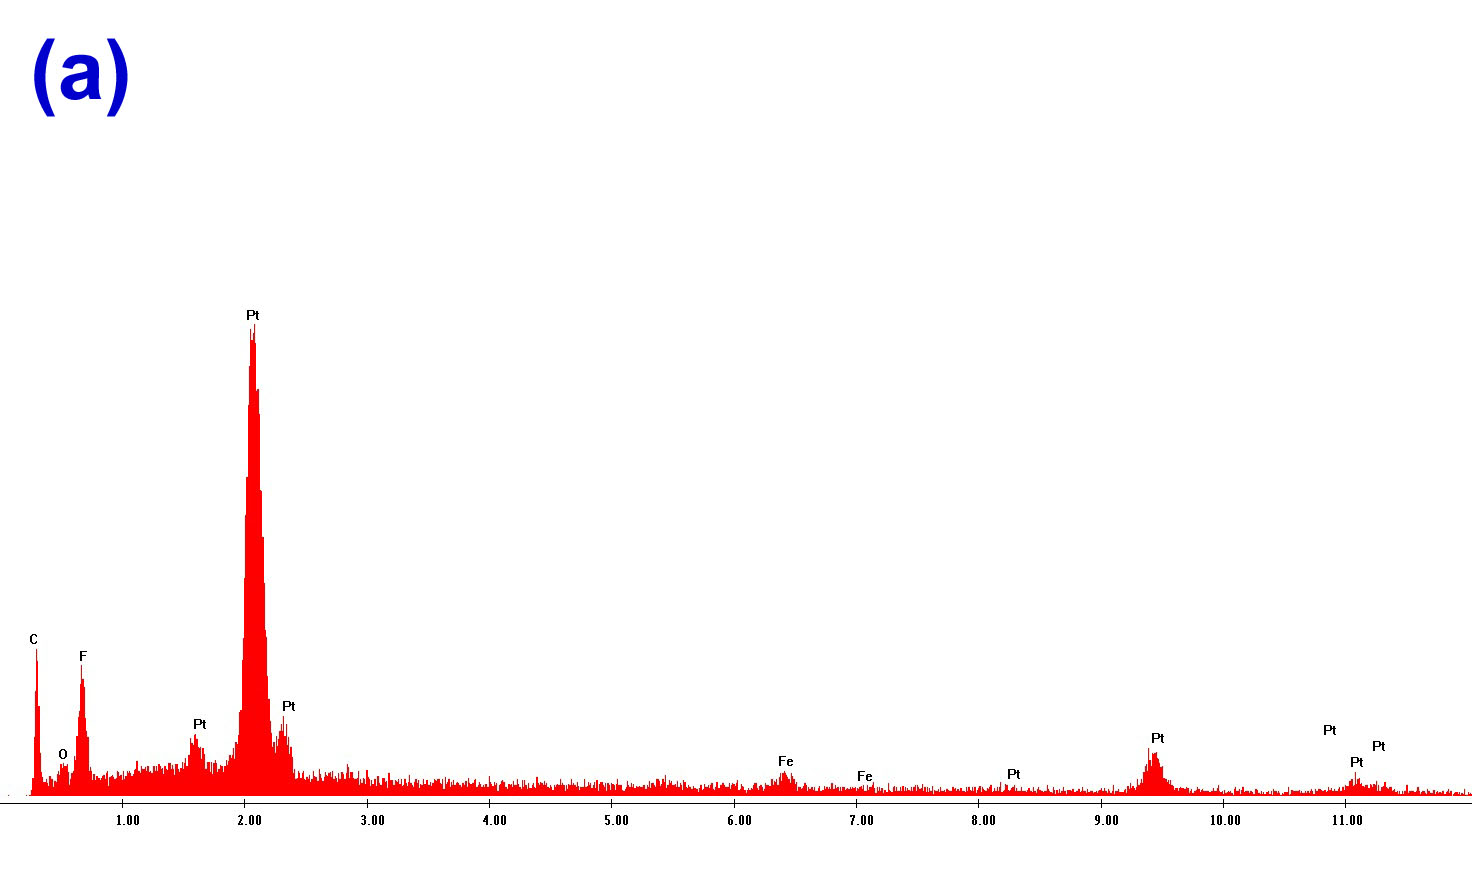
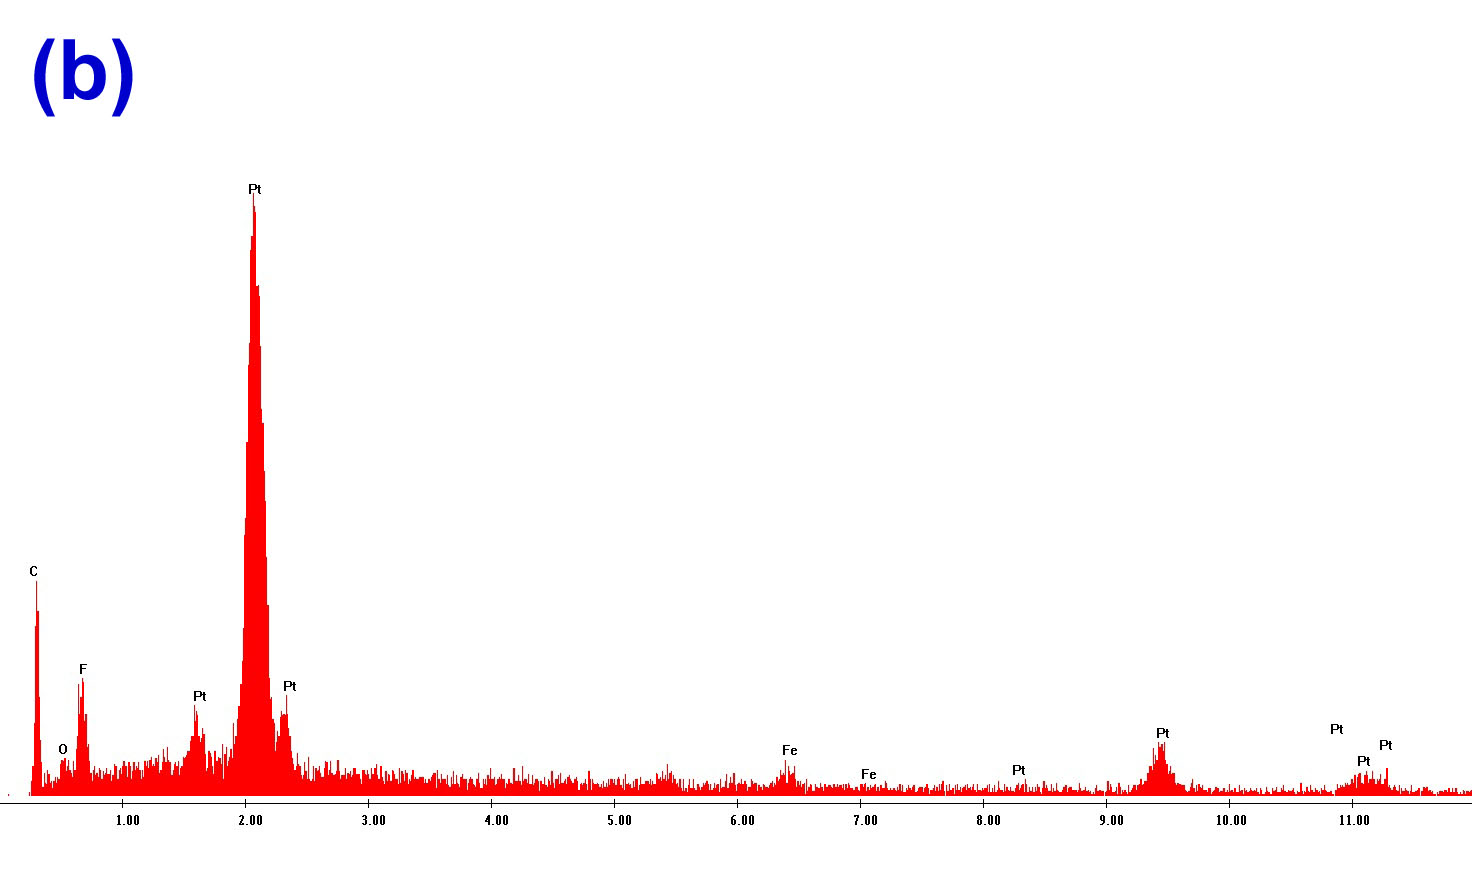
Figure 5: X-ray microanlysis for the (a) corroded MEA and the (b) fresh MEA.