Dept. of Chemical Engineering
Thickness Measurement Results and Discussion
Micrographs using the back scattered electron detector of a low resolution ESEM can be seen in Figure 1. Three distinct layers are observed in these micrographs which are, from top down, the anode electrode, proton exchange membrane, and the cathode electrode. To confirm the correct orientation of the MEA, one can simply look at the brightness contrast between the anode and cathode. The higher density of platinum in the cathode results in a higher average atomic number. This then translates to more back scattered electrons and thus a brighter image. The surrounding material is epoxy with some gas diffusion layer fibers, material not of interest to this investigation.
It can be seen from the thickness measurements in Figure 1 that there exists more variation in the corroded UEA than in the fresh UEA. This may indicate that carbon loss can result in non-uniform collapse of the porous cathode structure.
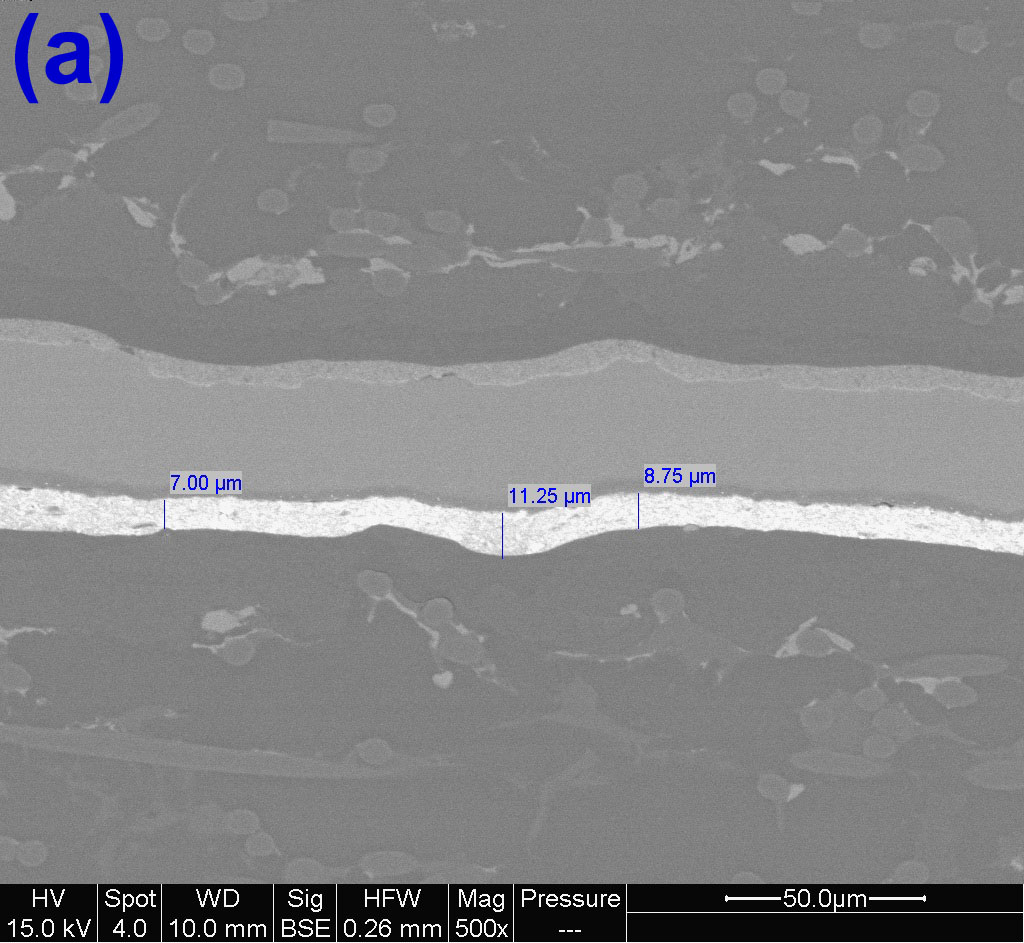

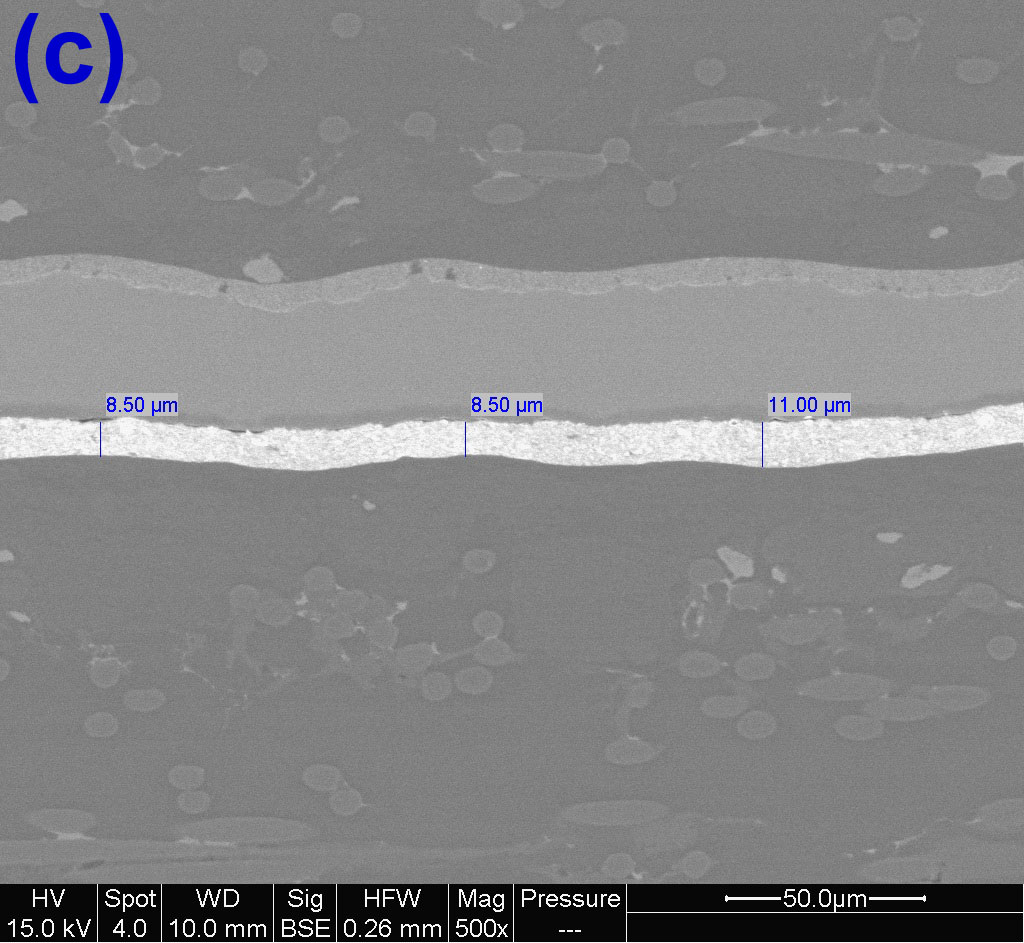
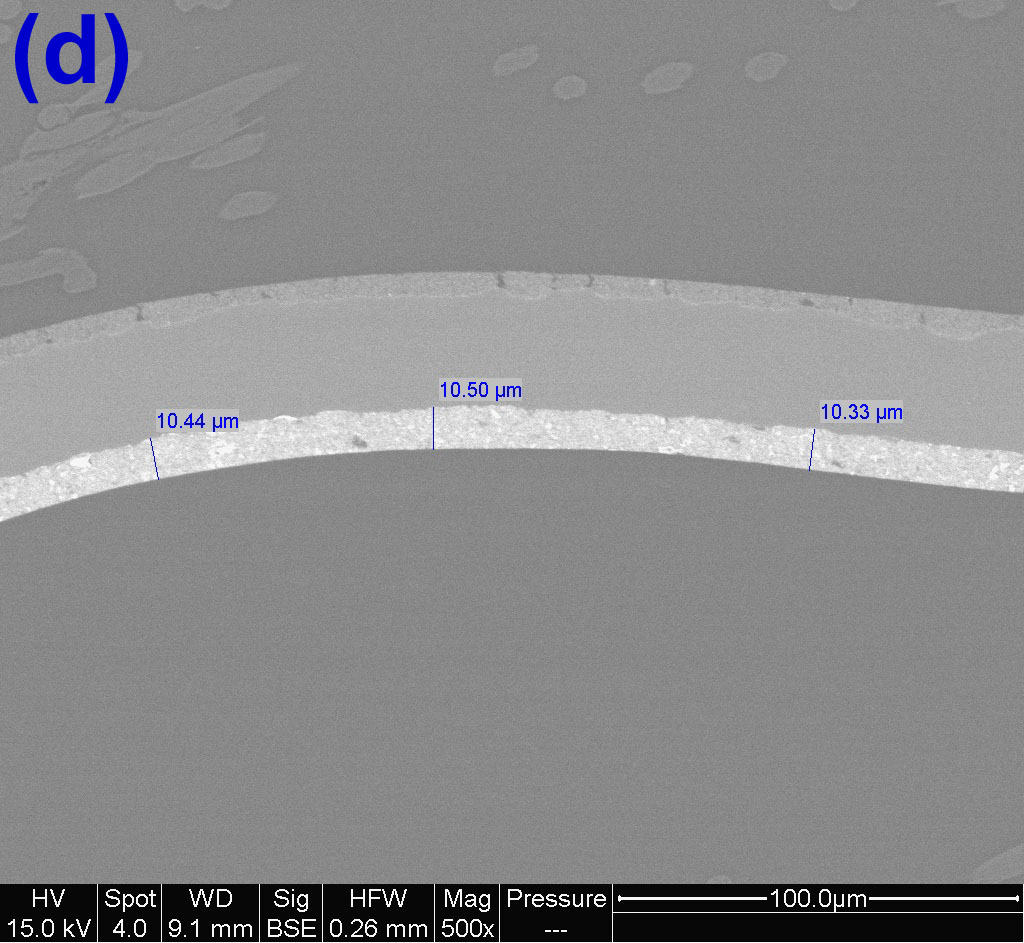
Figure 1: MEA cross-section micrographs using the ESEM for cathode thickness measurements of (a) the cathode gas inlet of the corroded MEA, (b) the cathode gas middle of the corroded MEA, (c) the cathode gas outlet of the corroded MEA, and (d) the cathode gas middle of the fresh MEA.
As an additional check, measurements were done with the samples that were prepared for structural analysis, as can be seen in Figure 2. In both micrographs, the cathode is shown with the membrane in the lower part of the image. Here the thickness difference is also observed, though only two measurements are shown for brevity.
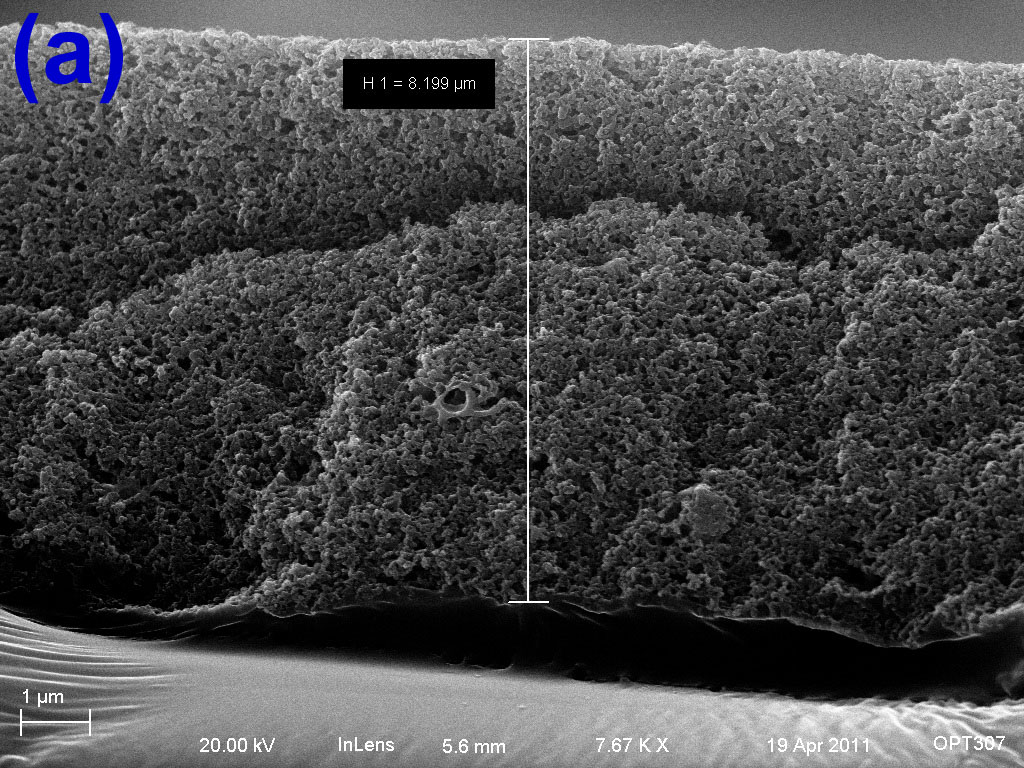
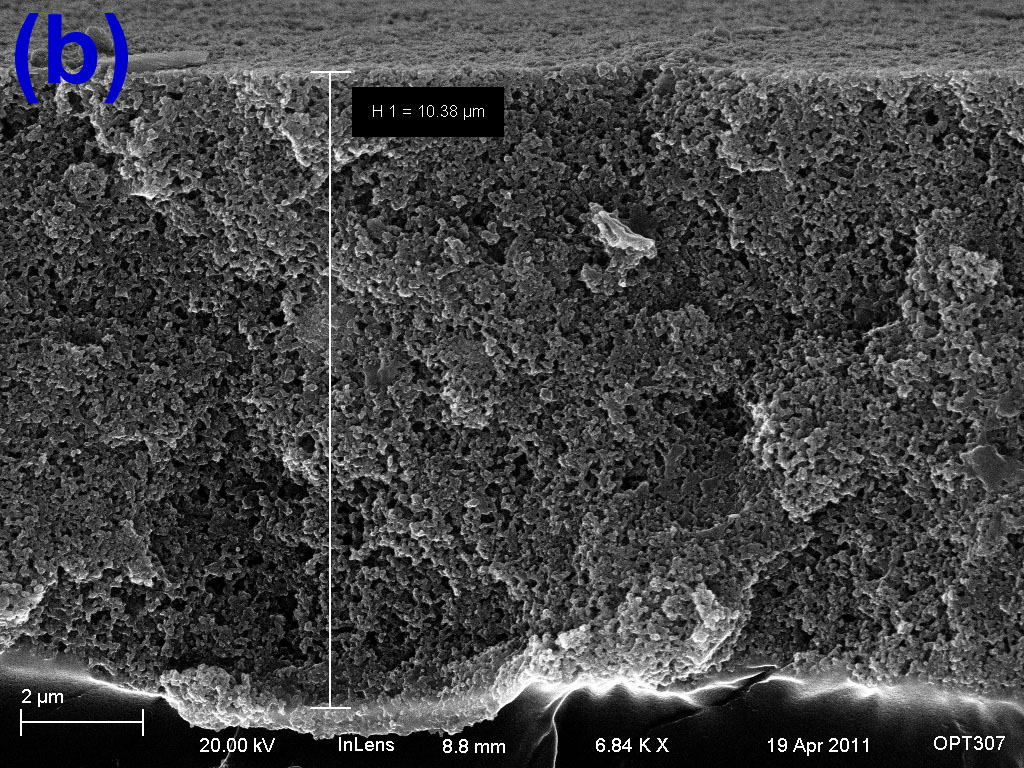
Figure 2: MEA cross-section micrographs using the FESEM for cathode thickness measurements of (a) the cathode gas middle of the corroded MEA, and (b) the cathode gas middle of the fresh MEA.
It has been shown that cathode thickness can be reduced by carbon weight loss, and that it induces variability into the cathode thickness. Since a uniform thinning was not observed, it is difficult to say how carbon weight loss transfers to cathode thinning. However, since the cathode appears to be a very porous structure, it can be hypothesized that once enough carbon is lost, the cathode may collapse, resulting in a thickness decrease greater than the percent of carbon lost. Additional work in this area is necessary to better design catalyst supports to withstand carbon loss.