Results
Some selected data is presented below.
Light Microscopy
This cross polarized image taken from a thin section of a calcite vein in the Marcellus Shale shows the internal structure of the vein. Calcite crystals grew into an open fracture from the walls towards the center, and crystals show an elongate shape. Small crystals near the wall of the fracture indicate early crystal growth.
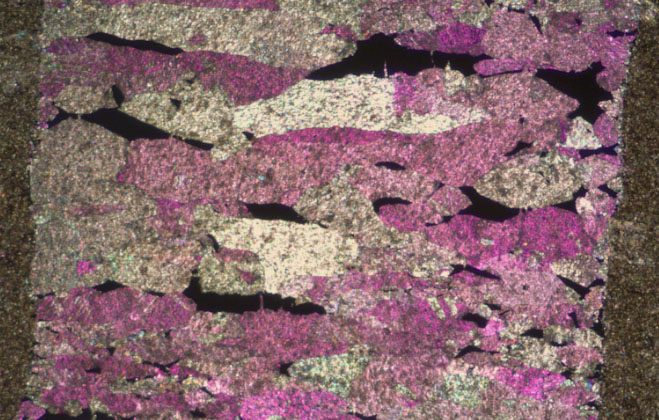
Thin section viewed in cross polarized light. The width of the calcite vein is 6mm.
Atomic Force Microscopy
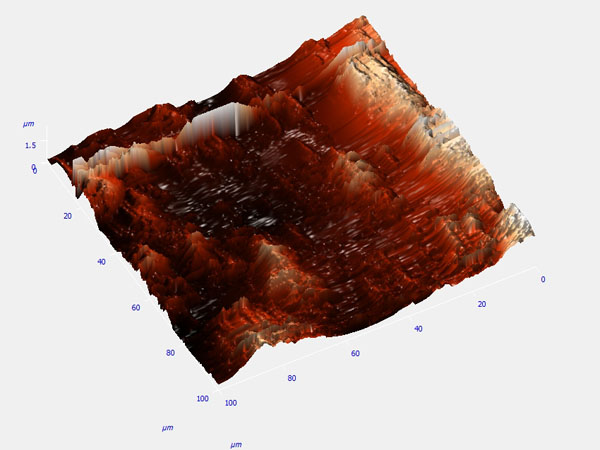
Here we present two 3-D maps of bedding surfaces in the Marcellus shale. These maps show how the individual grains are organized into beds. There may be some component of bedding parallel fluid flow due to the spaces between beds.
 |
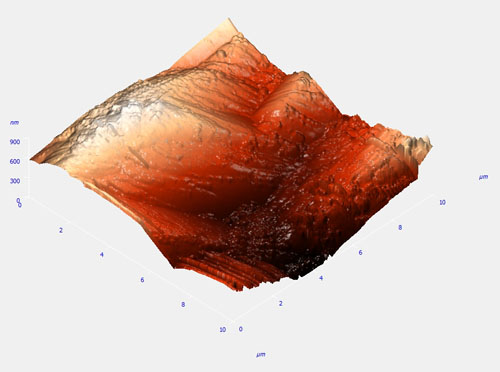 |
AFM images of Marcellus Shale, area scanned: 100um (left) and 10um (right).
Scanning Electron Microscopy
The following images are all SEM images taken at the University of Rochester optics department with help from Brian McIntyre.
Backscattered Electron Images
These images highlight changes in sample chemistry.
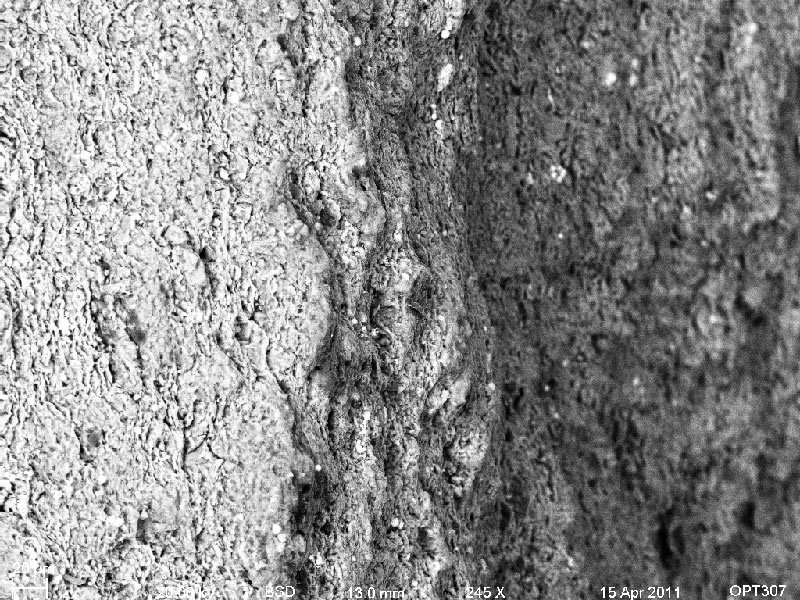
Marcellus Shale Bedding Planes. Note the changes in bedding thickness and chemistry.
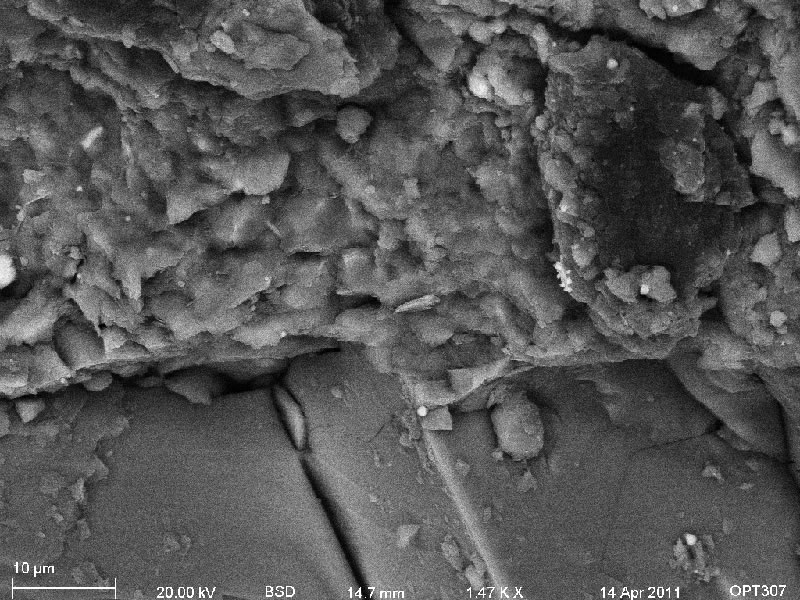
The edge of a calcite vein. Black shale grains are seen on the upper half of the image and large calcite veins fill the fracture on the lower half of the image.
Organic Rich Inclusions (black grain in upper right) generating microcracks in a calcite vein. These microcracks allow hydrocarbons generated by the organic rich fraction of the rock to migrate into the fracture network. Hydrocarbon generation increases fluid pressure eventually leading to fracturing.
Secondary Electrons
These images highlight the surface morphology of the sample. In this case we used them to examine sample porosity.
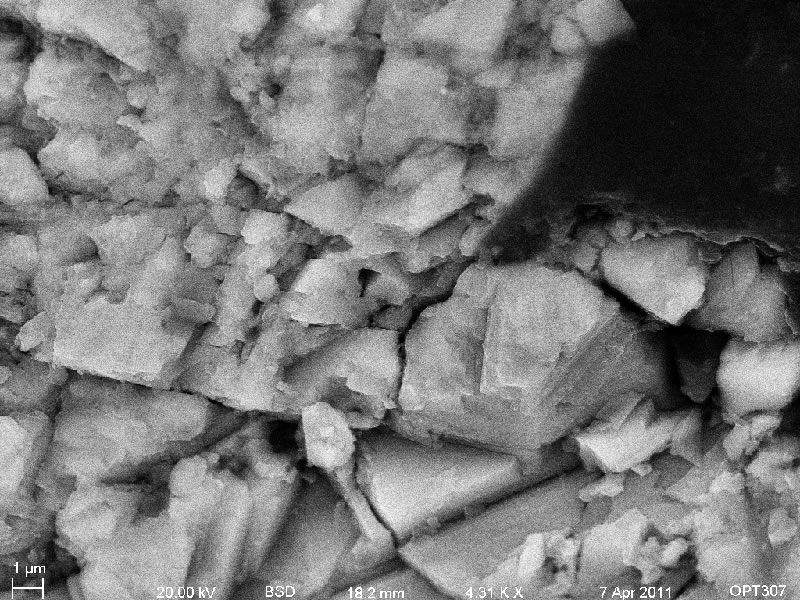
This sample shows the shale matrix-note the minimal porosity. (Holes in the sample surface, or pores, do not allow electrons to escape and are shown in black)
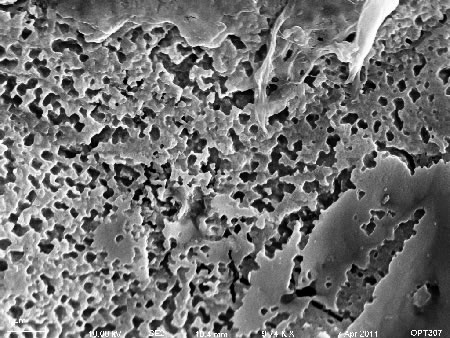
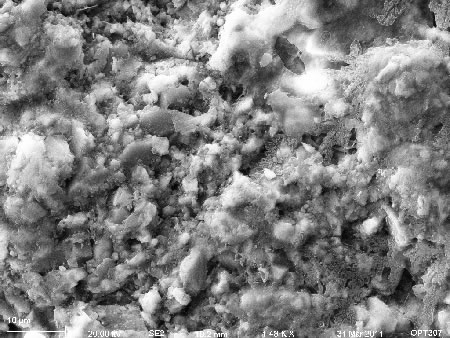
Pores in a partially mineralized calcite vein.
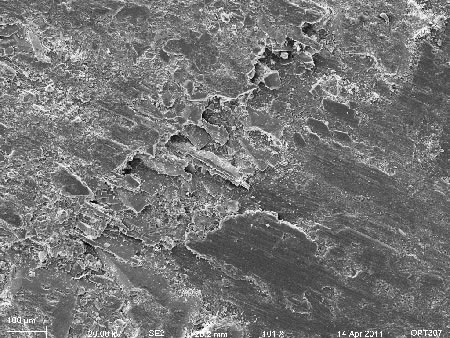
Slickenlines on the surface of a fracture indicating shearing
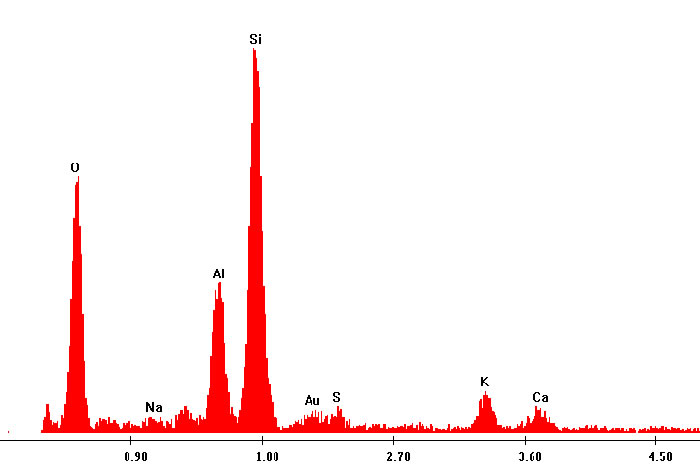
EDS Spectra
This EDS spectra shows the chemistry of a section of the Marcellus shale. This spectra was taken of the shale matrix, and indicates relatively reducing conditions.
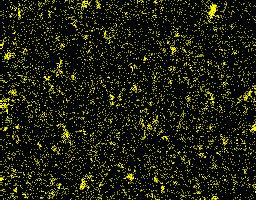
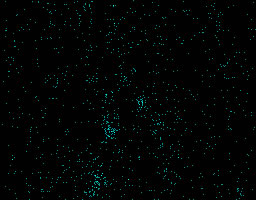
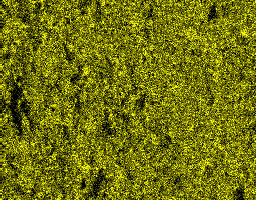
EDS Chemical Maps
The following chemical maps were taken from the following image of the bedding planes.
 |
 |
|---|---|
 |
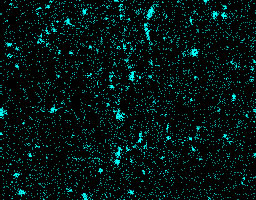 |
Elemental Maps clockwise from top left: Ca, C, Si, S. These maps indicate pyrite and pervasive calcite mineralization of the otherwise Siliceous shale. Carbon is present throughout the sample.
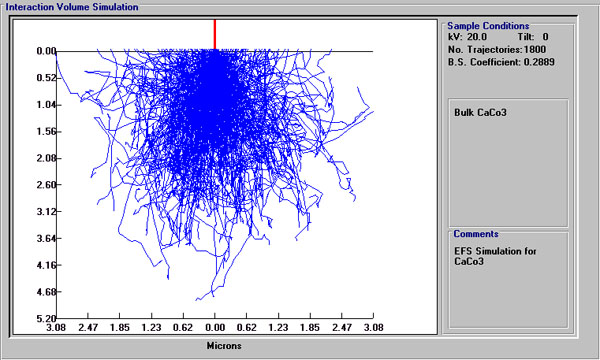
Electron Flight Simulator
This electron flight simulator shows the interaction volume created when the electron beam hits the sample. The samples are all much thicker than the interaction volume to reduce error.
<#form method="post" action="http://cng.seas.rochester.edu/cgi-bin/FormMail.pl">
Please enter any comments, criticisms, questions, etc. below.
Your name:
Email address: