Results and Discussion
X-Ray Mapping
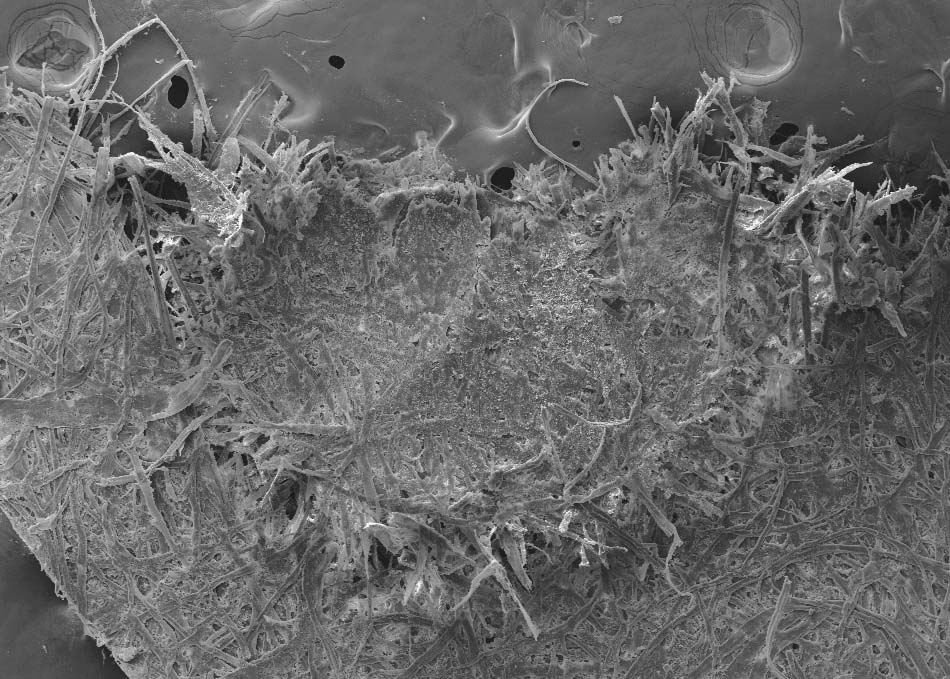
An interesting effect was seen on the paper with the 12-gauge Federal gunpowder. What was seen as a dark speck to the naked eye appeared in the scanning electron microscope (SEM) to be an indentation where a lead ball hit the paper but didn't rip it away. In Figure 2 the secondary electron micrograph shows a semi-circle shape that is approximately 1.5 mm in diameter.
Figure 2 - Secondary electron (left) and back-scattered electron (right) micrographs of a feature seen on the 12-gauge Federal shotgun shell sample.
The same shape becomes much more defined in the back-scattered electron micrograph (Figure 2, right) because a heavy element is present inside the area defined by the circle. Elements with higher atomic number back-scatter more electrons than those with smaller atomic number, which results in a brighter pixel in the resulting micrograph. Because we know that shotgun ammunition is a cluster of lead balls, the logical assumption is that lead is the heavy element that was left behind on the paper as the ball collided with it. To verify this, I collected x-ray maps of this sample, shown below in Figure 3.
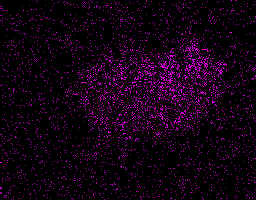
Figure 3 - X-ray maps of the 12-gauge Federal sample shown in Figure 2. The identified peaks are for lead (left), carbon (center) and calcium (right).
The x-ray maps qualitatively show that lead was the element concentrated within the circular region. Calcium is shown to be present in the paper uniformly but not in the carbon tape. Likewise carbon was more concentrated in the carbon tape than in the paper, but was also present in the paper. We know this is true because the primary compound of paper is cellulose, a carbohydrate.Particle Morphology
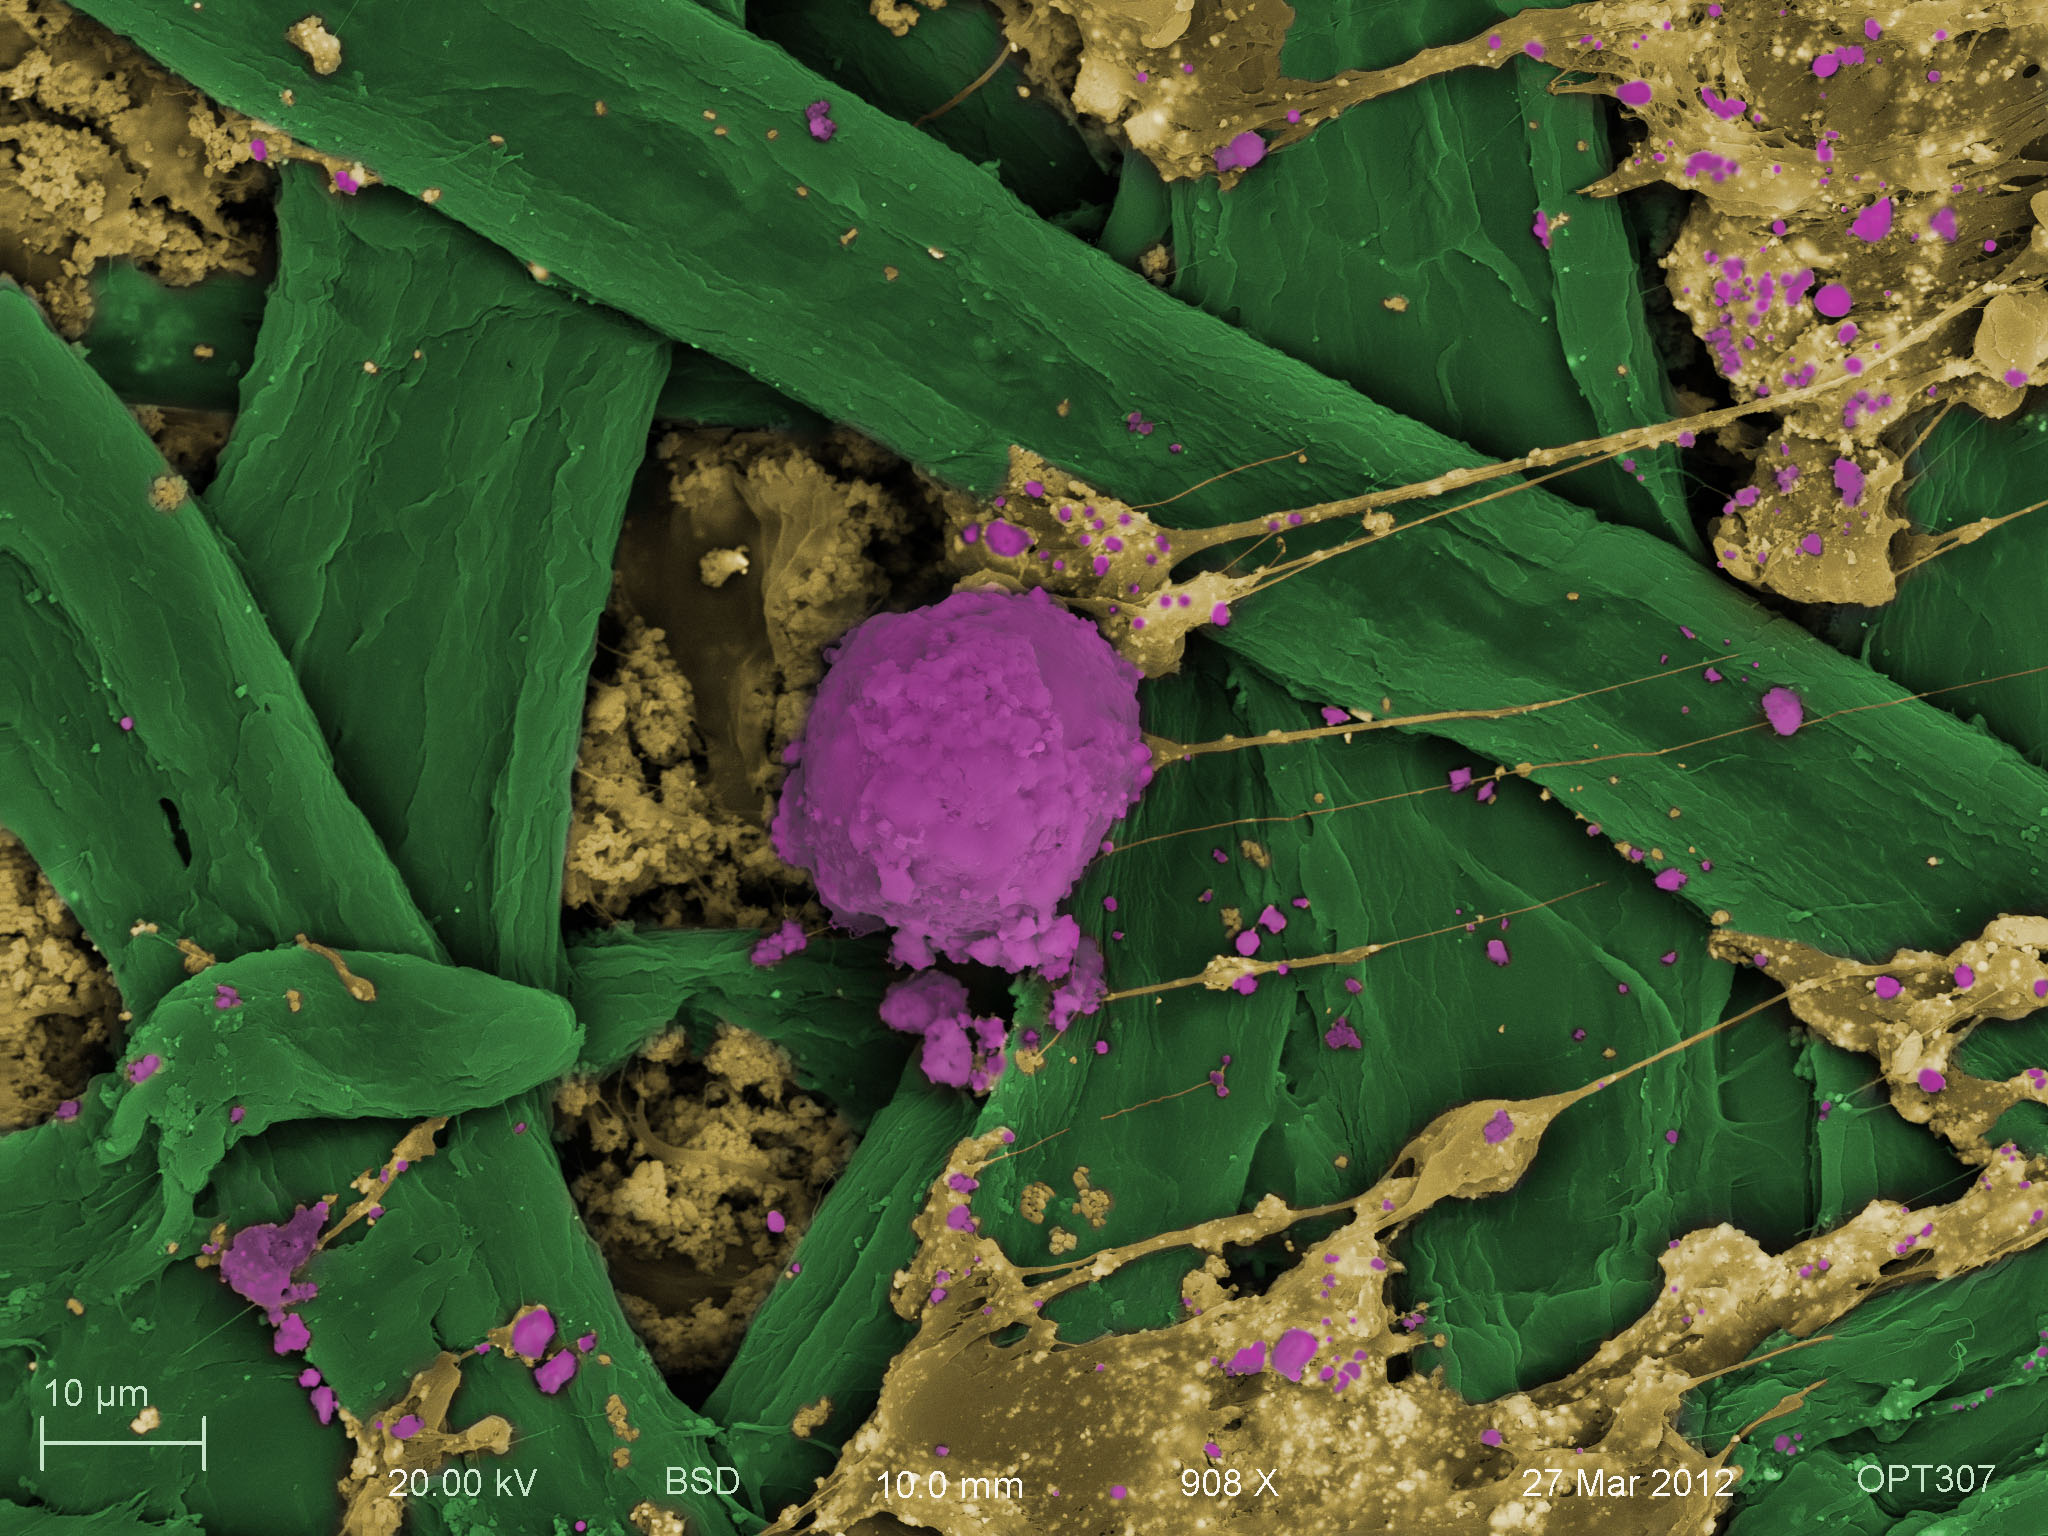
Zooming in, we can see what some of the GSR particles look like. Doing so, we find that there are generally two sizes of particles: larger particles of diameter around 10 microns, and smaller particles of diameter around 1 micron. Figure 4, below, shows a colorized micrograph of typical particles. The cellulosic paper fibers have been colored green, the characteristic GSR particles purple, and the remaining areas yellow. Note that the single larger particle is surrounded by numerous smaller particles throughout the image.
Figure 4 - Colorized secondary electron micrograph of typical gunshot residue particles from the .410-gauge Winchester sample.
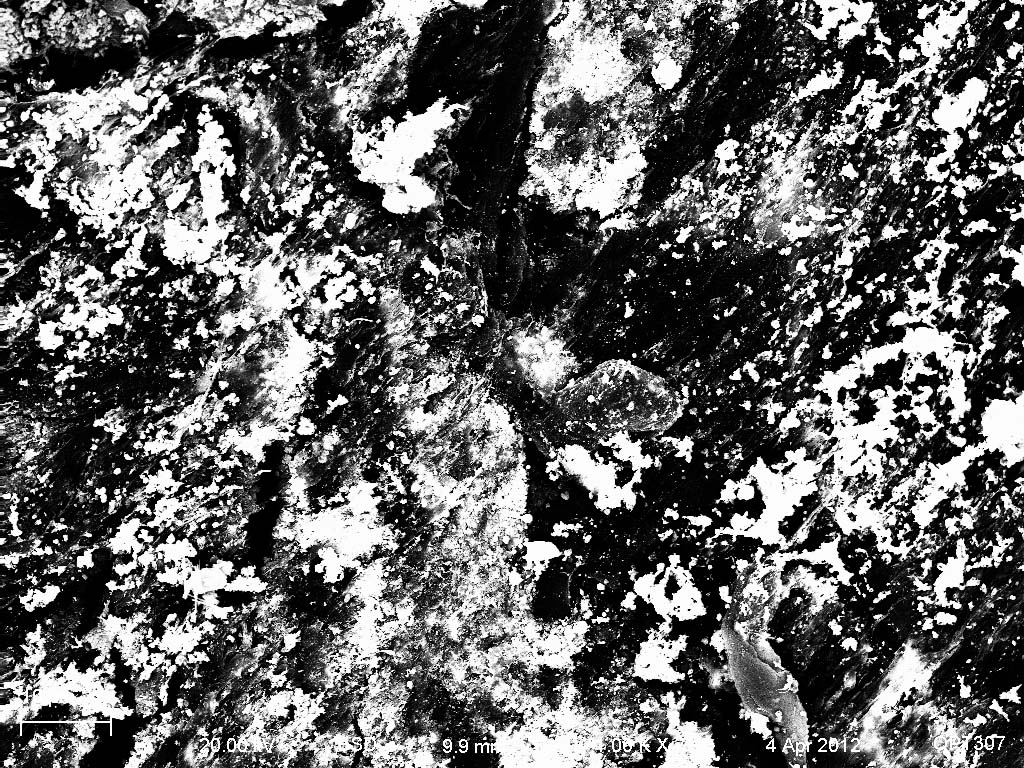
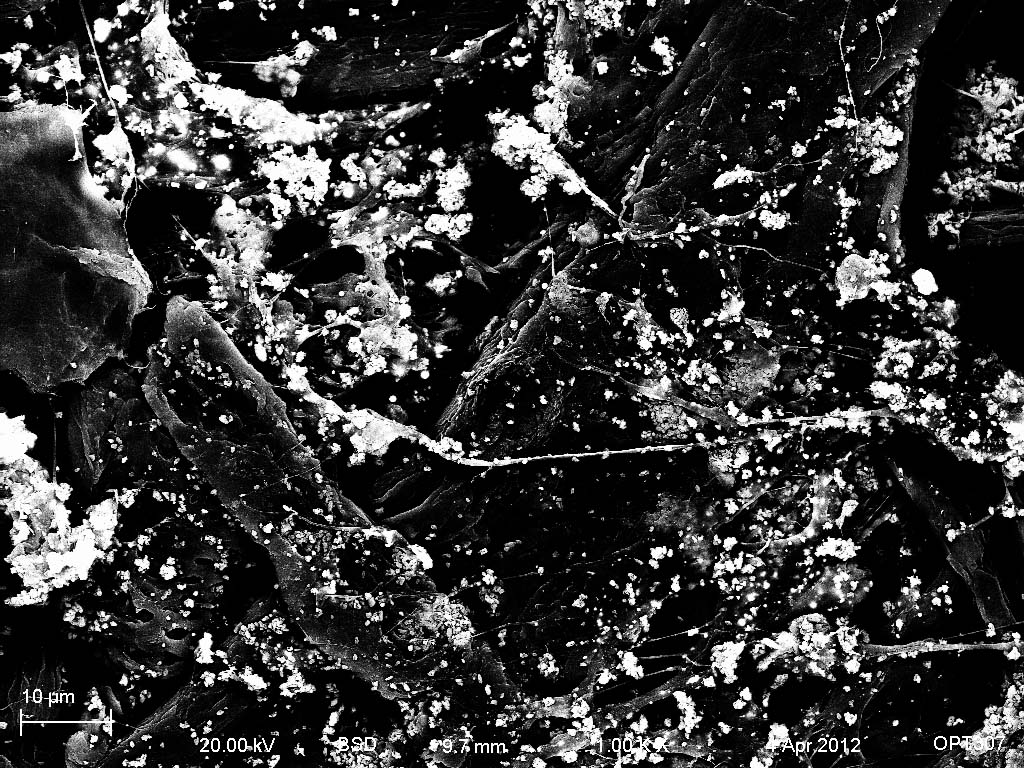
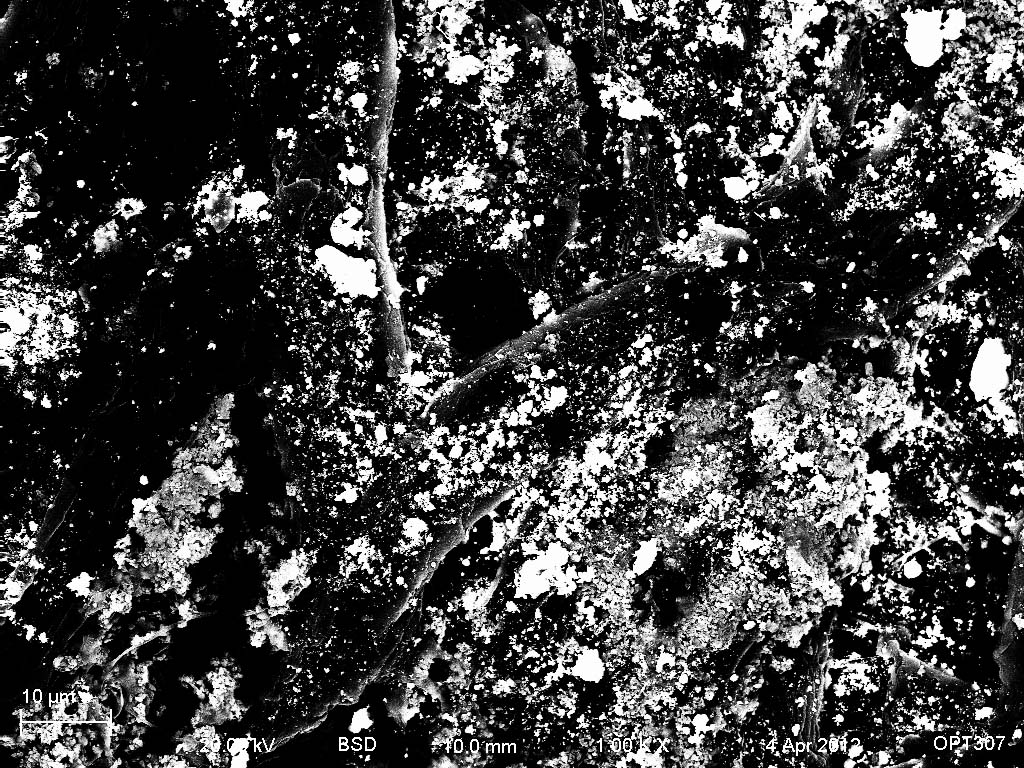
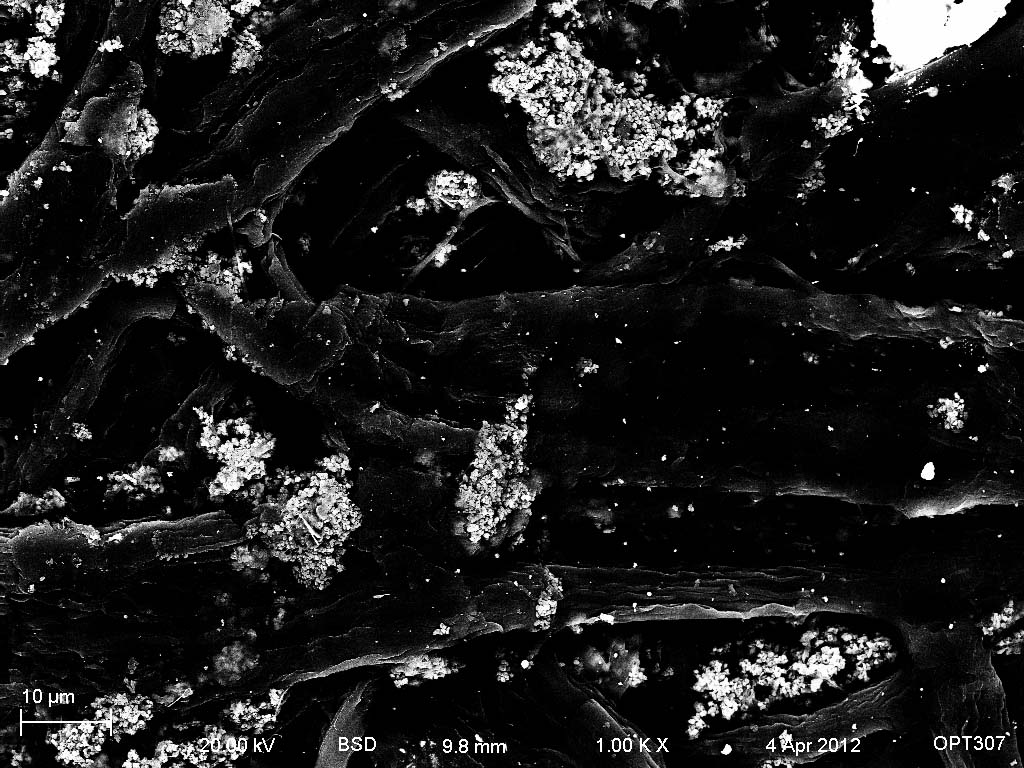
The particle size distribution was obtained from high-contrast back-scattered electron micrographs. Four examples are included below in Figure 5. Using ImageJ software, a particle distribution was generated for three images of each sample based on the Feret diameter. The diameters were binned and averaged; the histogram is included below in Figure 6.
Figure 5 - Example micrographs of 12-gauge Federal (top left), .410-gauge Winchester (top right), .22 caliber Remington (bottom left) and .22 caliber Federal (bottom right) ammunition GSR samples, used for particle size distribution analysis. Each was taken at 1000x magnification using the back-scattered electron detector at with very high contrast.
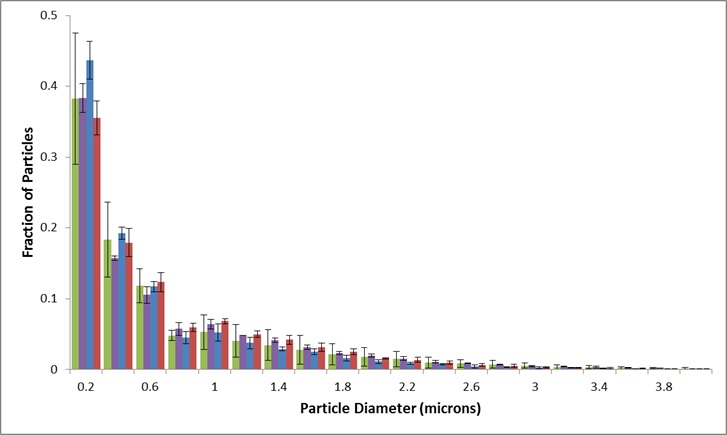
Figure 6 - GSR particle size histogram comparing Feret diameters of 12-gauge Federal (green), .410-gauge Winchester (purple), .22 caliber Federal (blue) and .22 caliber Remington (red) samples. Error bars represent one standard devation of each sample (n=3).
The GSR particle size distribution seems to be shaped like an exponential decay function, which is often seen in nature. Interestingly, this trend is violated by particles between 0.6 and 0.8 microns in diameter; all four samples exhibited fewer particles of this size than expected by the general trend. The only distinctive difference between the distributions occurs between the .22 caliber samples in the smallest diameter bin (< 0.2 microns). This difference was found to be statistically significant using a Students' t-Test with an alpha of 0.05. Particles were also analyzed based on their degree of circularity, but no significant difference was seen between sample. Neither was any correlation seen between particle size and circularity.
Chemical Composition
At least four x-ray spectra were obtained from different particles in each sample. An attempt was made to sample from both the characteristically large and small particles. See Figure 7 below for two examples of spectra. It should be noted that these are not representative of all the spectra that were obtained. Rather, a wide variety of spectra were obtained, with varying elements' characteristic x-rays detected. Also, quantum analysis was done on each spectrum, but the data were so inconsistant that they are not provided here.
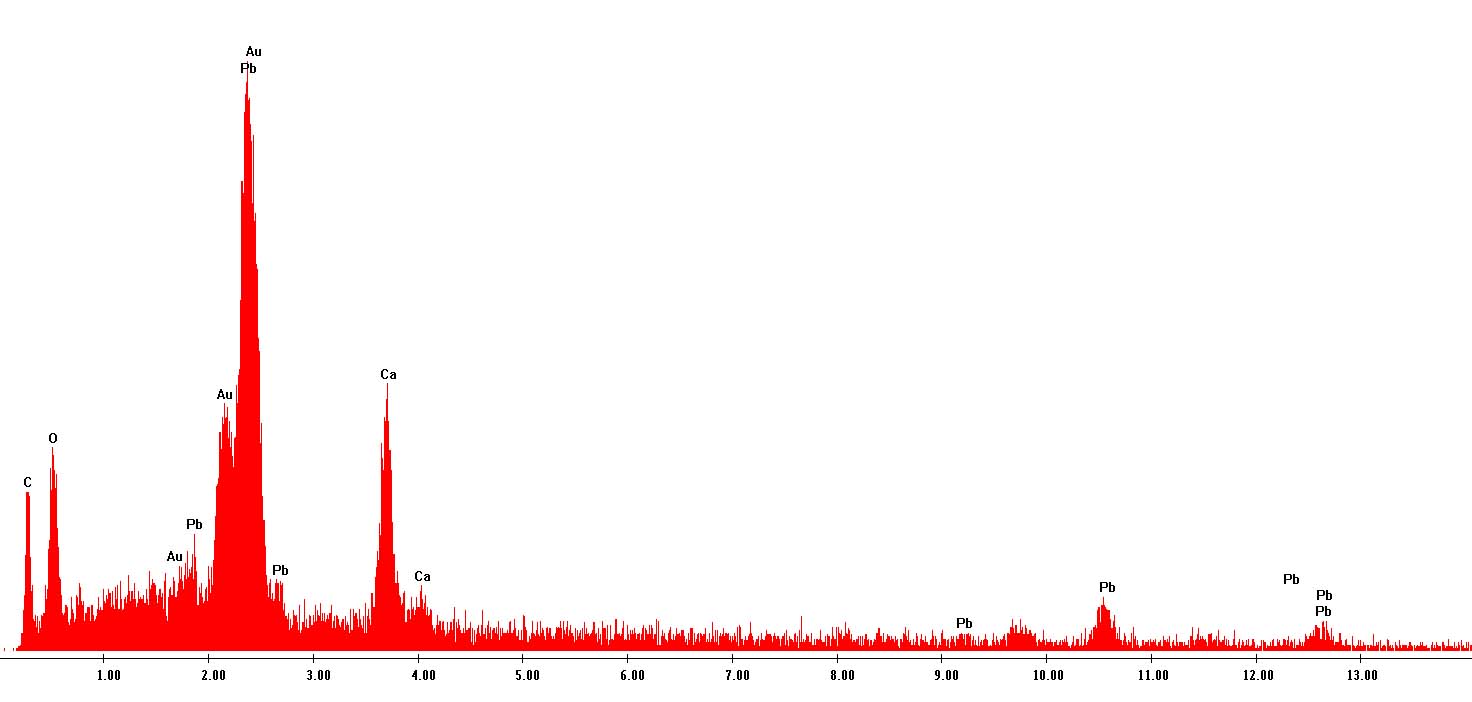
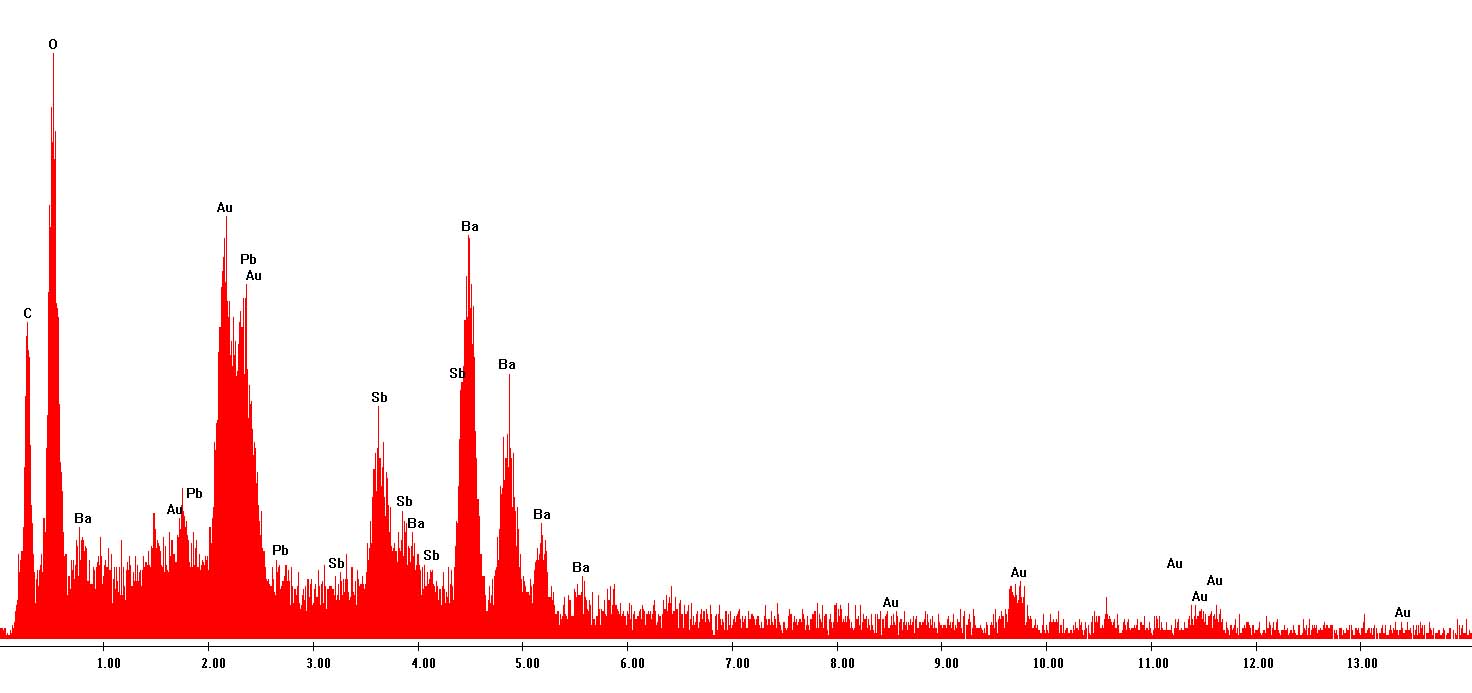
Figure 7 - X-ray spectra obtained of GSR particles from a 12-gauge Federal shotgun shell (top) and a .410-gauge Winchester shotgun shell (bottom).
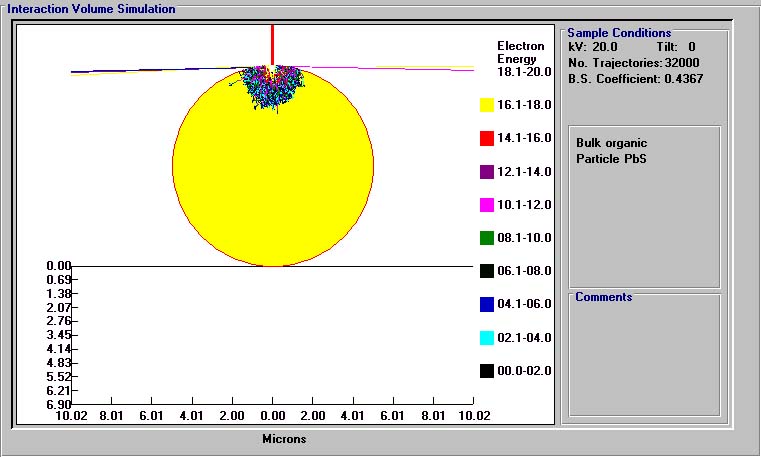
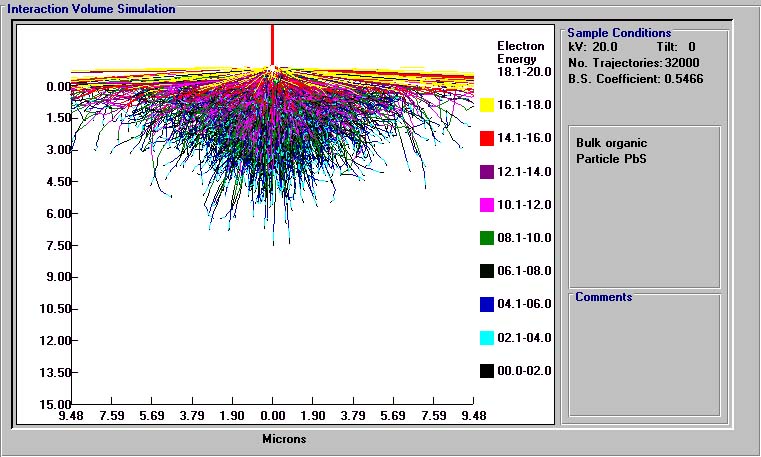
It is not surprising that the x-ray spectra were so varied. Most particles analyzed were found to have spectra like that shown in the upper frame of Figure 7, where lead (Pb) is the only element that we do not expect to find in paper or in the sputtered layer (gold, Au). The carbon, oxygen and calcium peaks certainly came from the paper. The x-ray maps of Figure 3 help to verify this. To better understand where the x-rays would be generated from, an electron flight simulation was done. Simulations of both a small and large particle are included below in Figure 8. Lead sulfate was used to model the particle because it would have a similar density (pure lead metal was not an option in the simulation software), and an organic substrate was chosen to model the paper. Because so much of the interaction volume for the small particle was located in the organic bulk, it is not surprising that the paper would contribute peaks to the x-ray spectra, even when the electron beam raster was positioned directly on a particle.
Figure 8 - Interaction volume simulations of a 10 micron particle (top) and a 1 micron particle (bottom) of lead sulfate on an organic substrate.
The really interesting spectra contain peaks of barium (Ba) and antimony (Sb), like in the lower frame of Figure 7. Most of the particles analyzed for this project, however, did not seem to contain either of these elements. Perhaps if a trained forensic microscopist had taken the reins, sufficiently unique characteristics of the GSR could have been obtained. That certainly was not the case here.