Intro of Bean
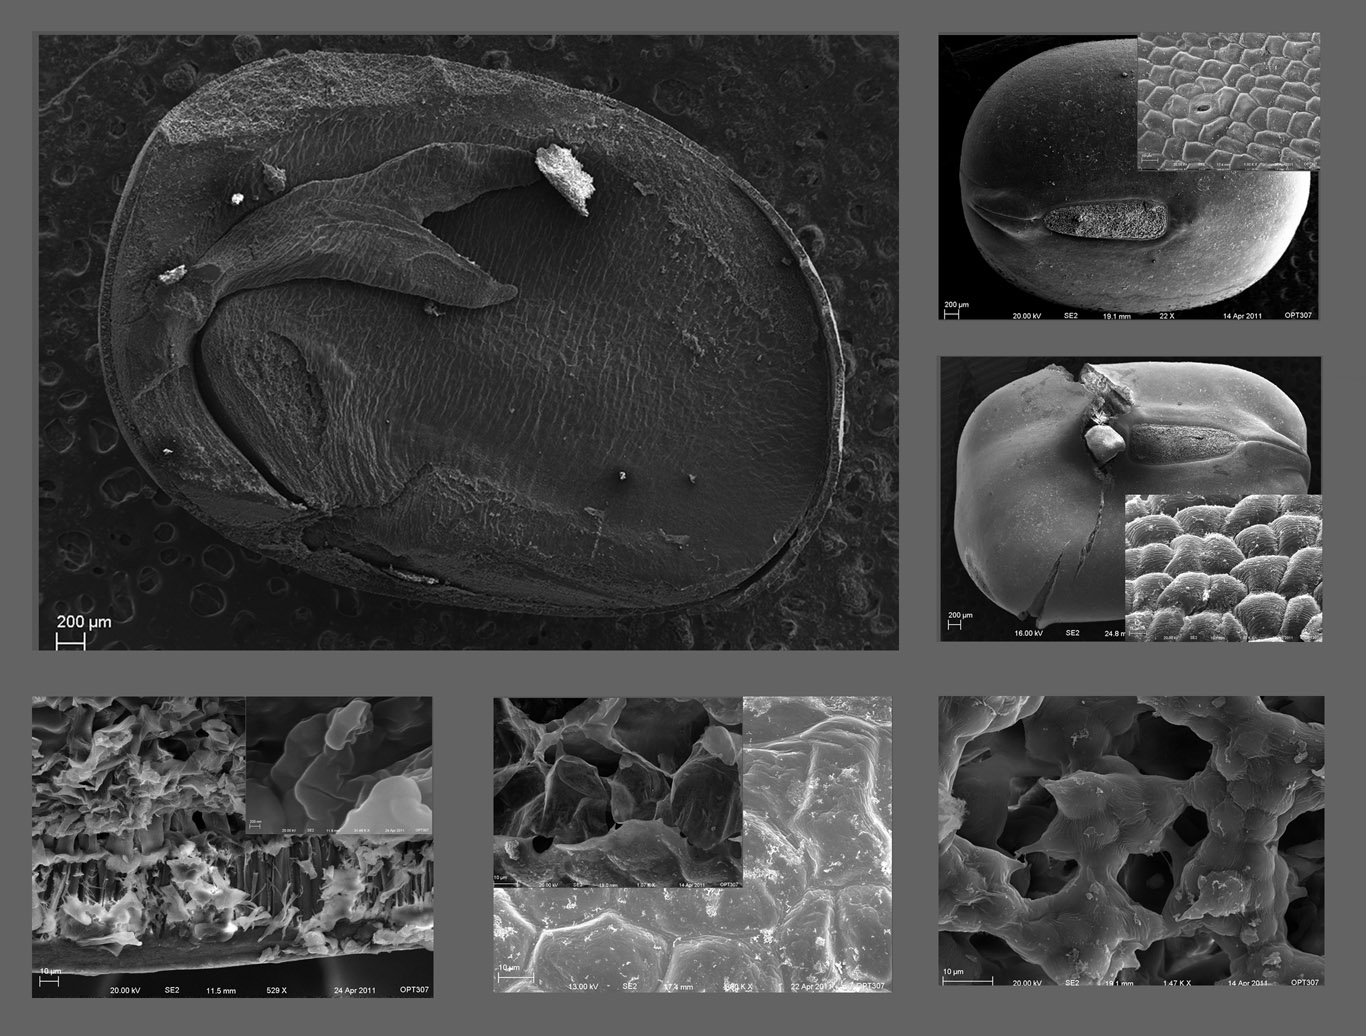
These figures show the basic structure of a bean. The left-top graph shows a crosssection of an un-sprouting bean. We can see the clear structure of epicotyl, hypocotyl, radical, cotyledon and seedcoat. The right-top graph shows the whole un-sprouting bean, with the small graph showing the skin. The right-middle graphs shows the whole sprouting bean, see the root is already streching out and seedcoat is broken. The small graph in this shows the skin on th tip. The right-down graph shows hilum. The left-down graph shows the skin magnifying the left-up figure, and with a even higher magnified figure showing the curvation of the dried skin in the corner. The middle-down graph shows the skin and its crosssection after the seedcoat fall off during sprouting.
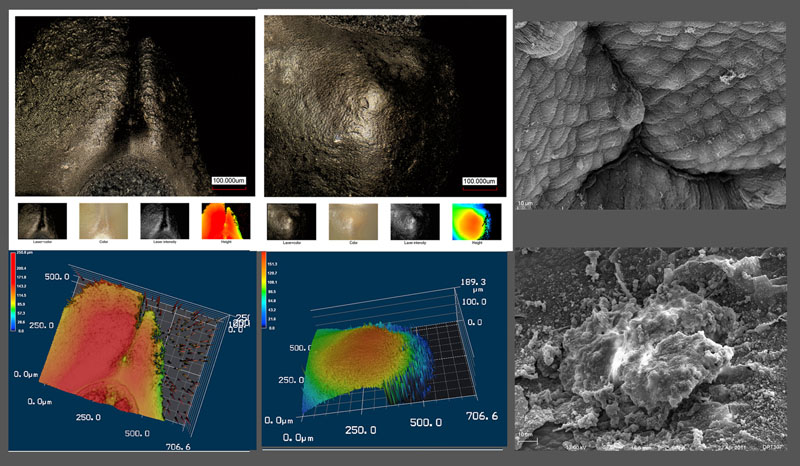
We also have light micorscope images combing SEM images to give a better description of the dynamic process that the root comes out of the seedcoat. The laser scanning is combined with ordinary light microscope give also height information and better resolution. The left two figures depict the point on the other side of the hilum that is not damaged after sprouting. The middle figures show exactly the point that is broken during sprouting. The right figures show the process it change from middle figures to the above broken ones that tip already comes out.