X-ray Microanalysis
X-ray signals were the focus of this exercise. X-ray generation is produced by inelastic collisions of the incident electrons with electrons in discrete orbital shells of atoms in the sample. As the excited electrons return to lower energy states, they yield X-rays that are of a fixed wavelength. This wavelength is related to the difference in energy levels of electrons found in the different orbital shells for a given element. Therefore, each of the elements present in the sample produces a unique set of x-rays that is a “fingerprint” for that specific element.
The energy dispersive x-ray spectrometry (EDS) detector is a solid state device designed to detect x-rays and convert their energy into electrical charge. This charge becomes the signal which when processed then identifies the x-ray energy, and hence its elemental source. From the interpretation of the x-ray signal, qualitative and quantitative information about the chemical composition of the sample can be derived from a spectrum of continuum and characteristic x-rays. Due to the inelastic collision in x-ray signaling, electrons are decelerated and lose energy without producing an ionization of the atoms in the sample. This in return produces what is called continuum x-rays or in other words “background”. The intensity of the continuum x-rays is related to the atomic number of the sample, the beam energy and the current of the primary beam.
Lastly, the inelastic collision between the primary beam electrons and the inner shell electrons result in the ejection of the electron from the atom within the sample. As a result, a characteristic x-ray can be formed. The beam electron must have an energy that is slightly greater than the energy of the shell electron. The SEM can be set up in such a way that the characteristic x-ray of the given element is detected and its position is recorded. This is known as x-ray mapping and can be used to form an image of the sample that shows where atoms of a given element are localized.
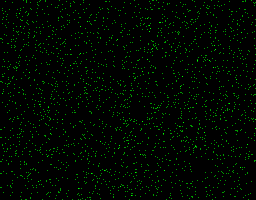
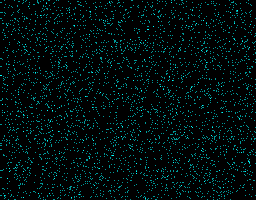
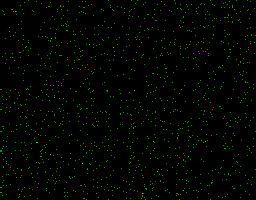
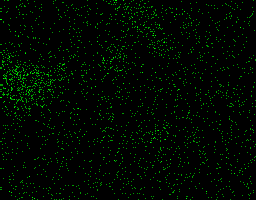
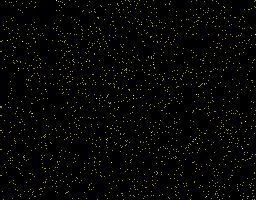
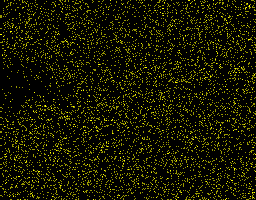
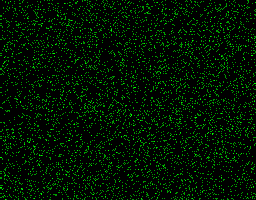
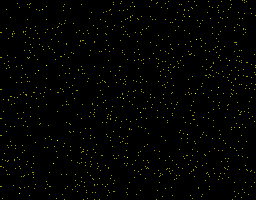
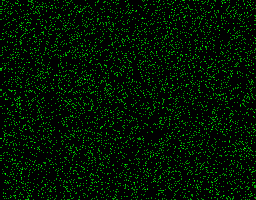
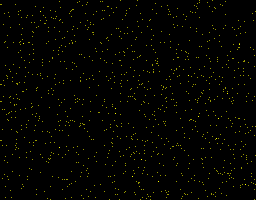
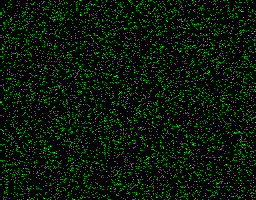
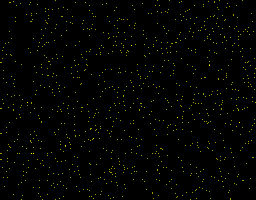
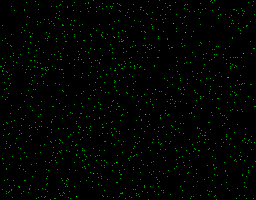
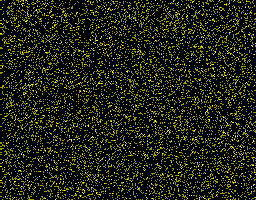
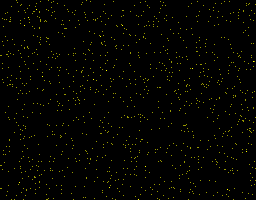
X-ray maps and x-ray spectrums were taken from the different sample surfaces with no cell seeding. The maps have been grouped according to surface treatment.
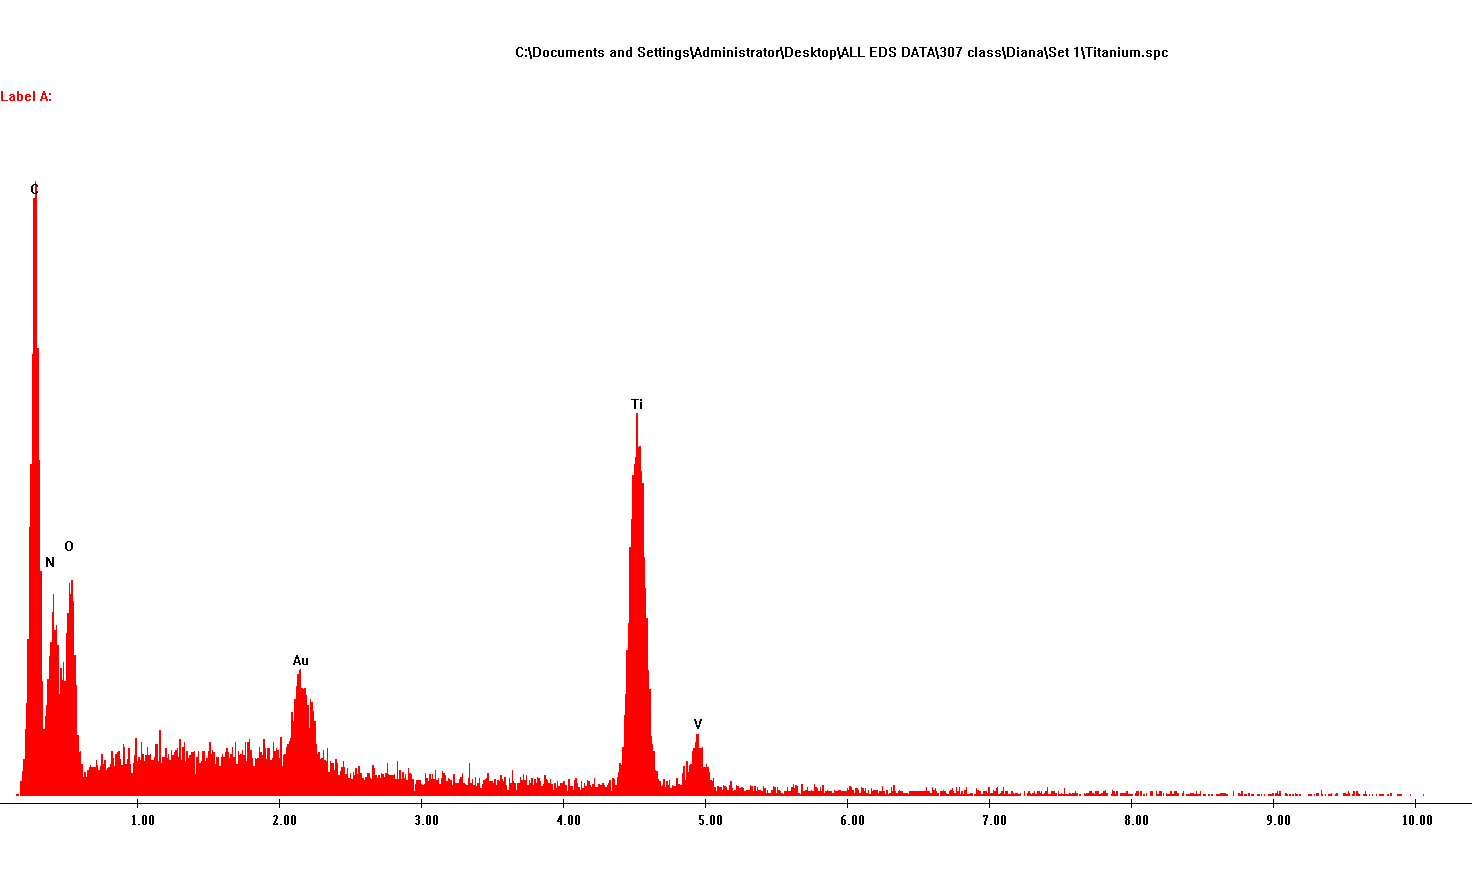
Titanium surface sample (left-right: V, Au, C, Fe, Mg, N, Ti, and Al)
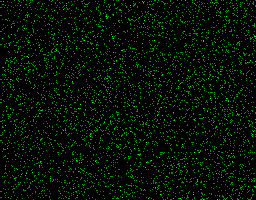

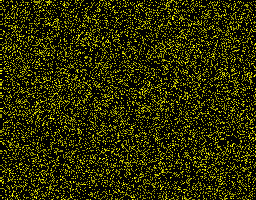
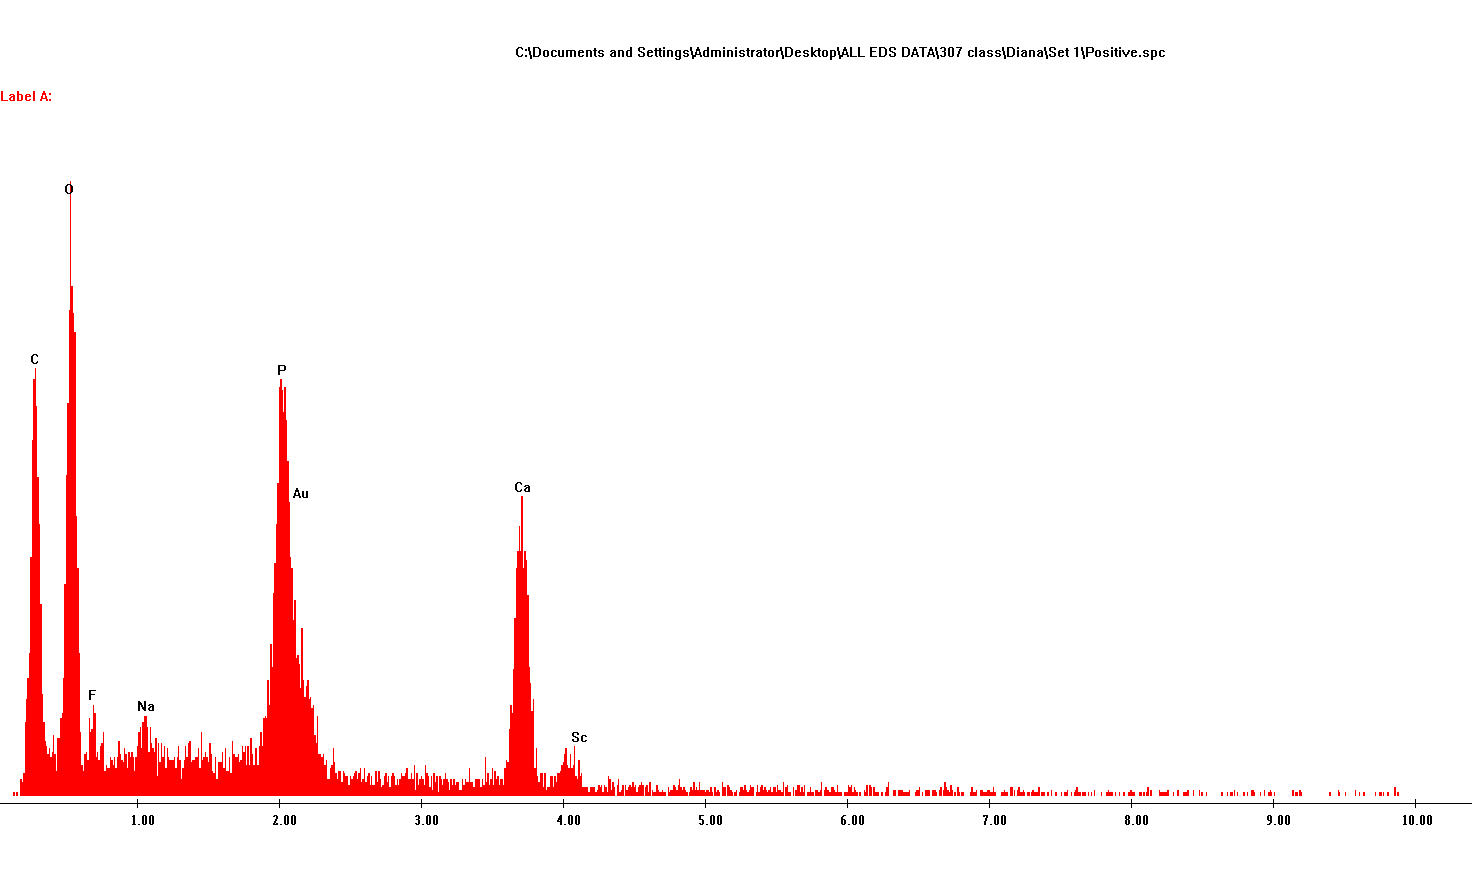
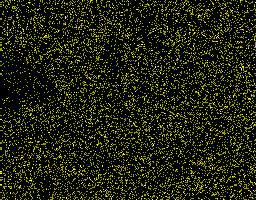
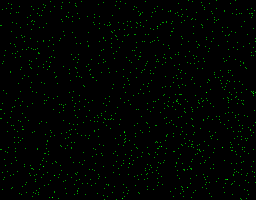
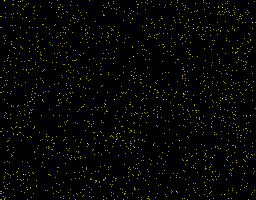
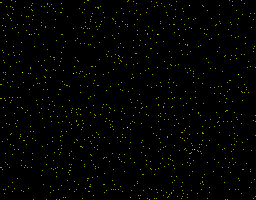
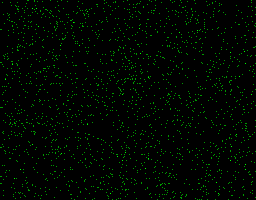
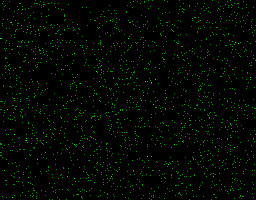
Titanium with positive charged HAP (left-right: Tc, Sc, Rb, P, O, Ni, Na, Fe, C, Ca, and Au)

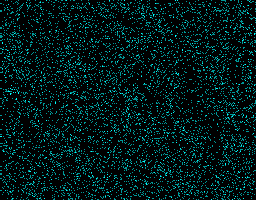
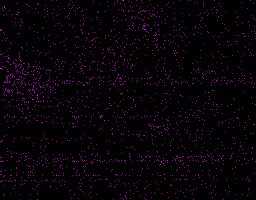
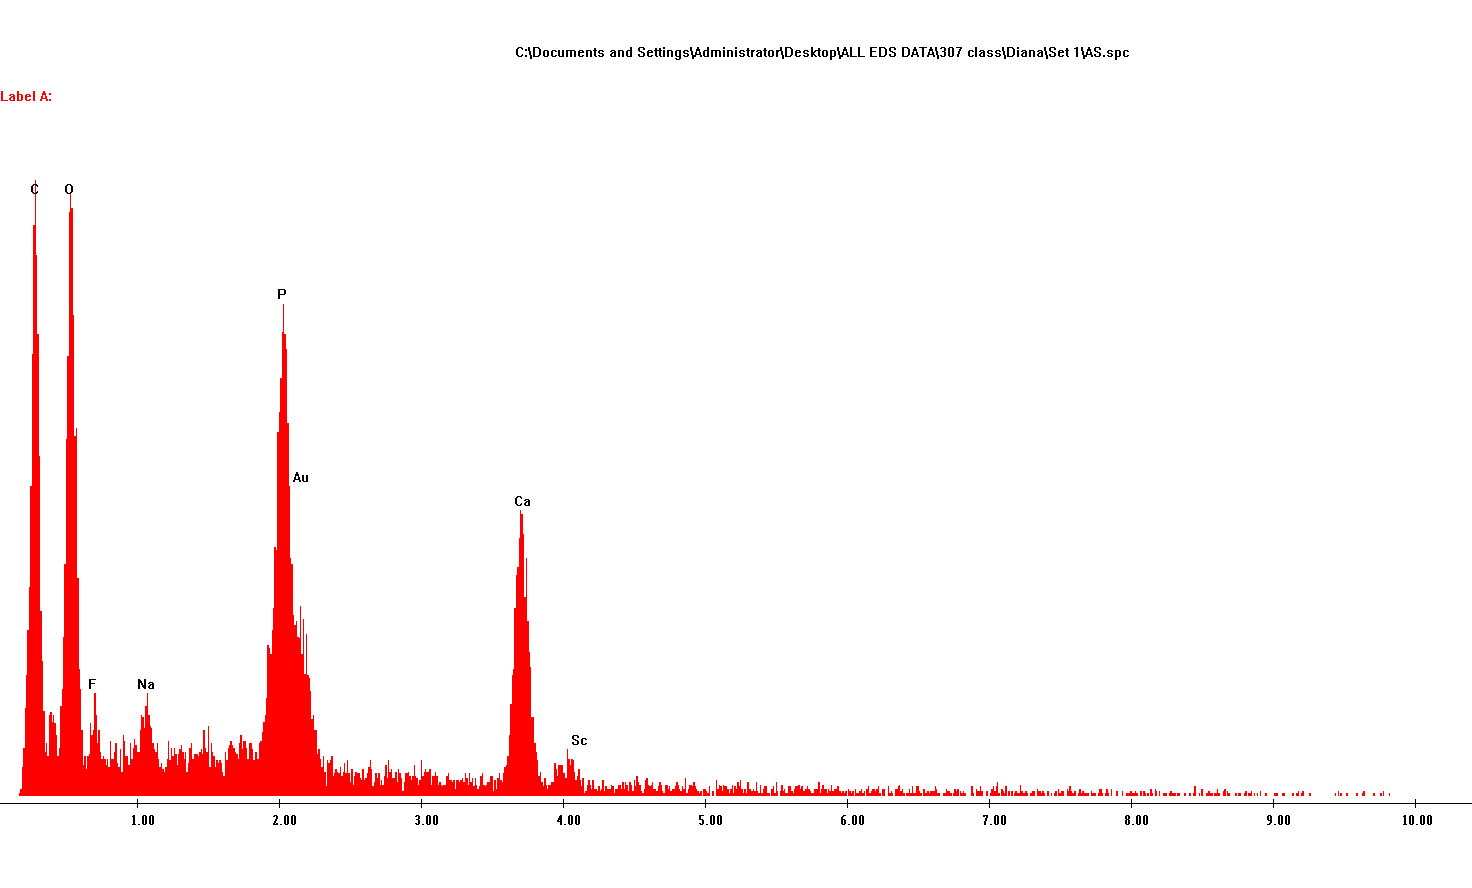
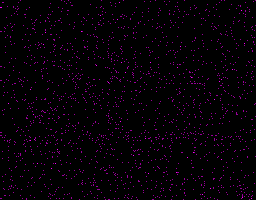
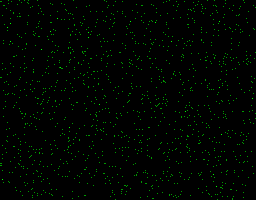
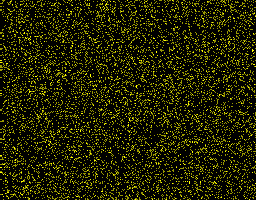
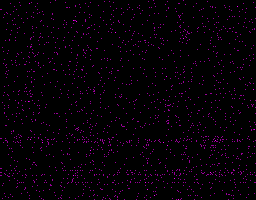
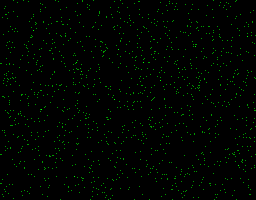
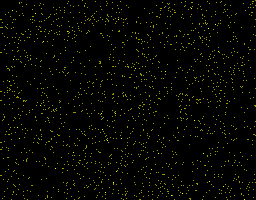
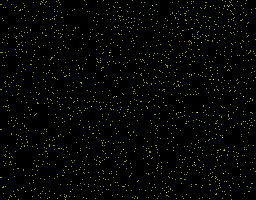
Titanium with negative charged HAP (left-right: Tc, Sc, Rb, P, O, Ni, Na, Fe, C, Ca, and Au)


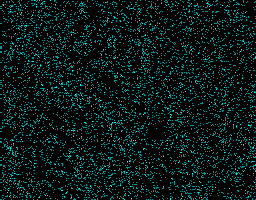

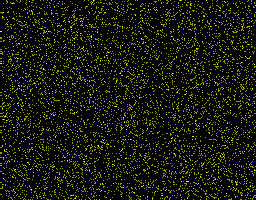
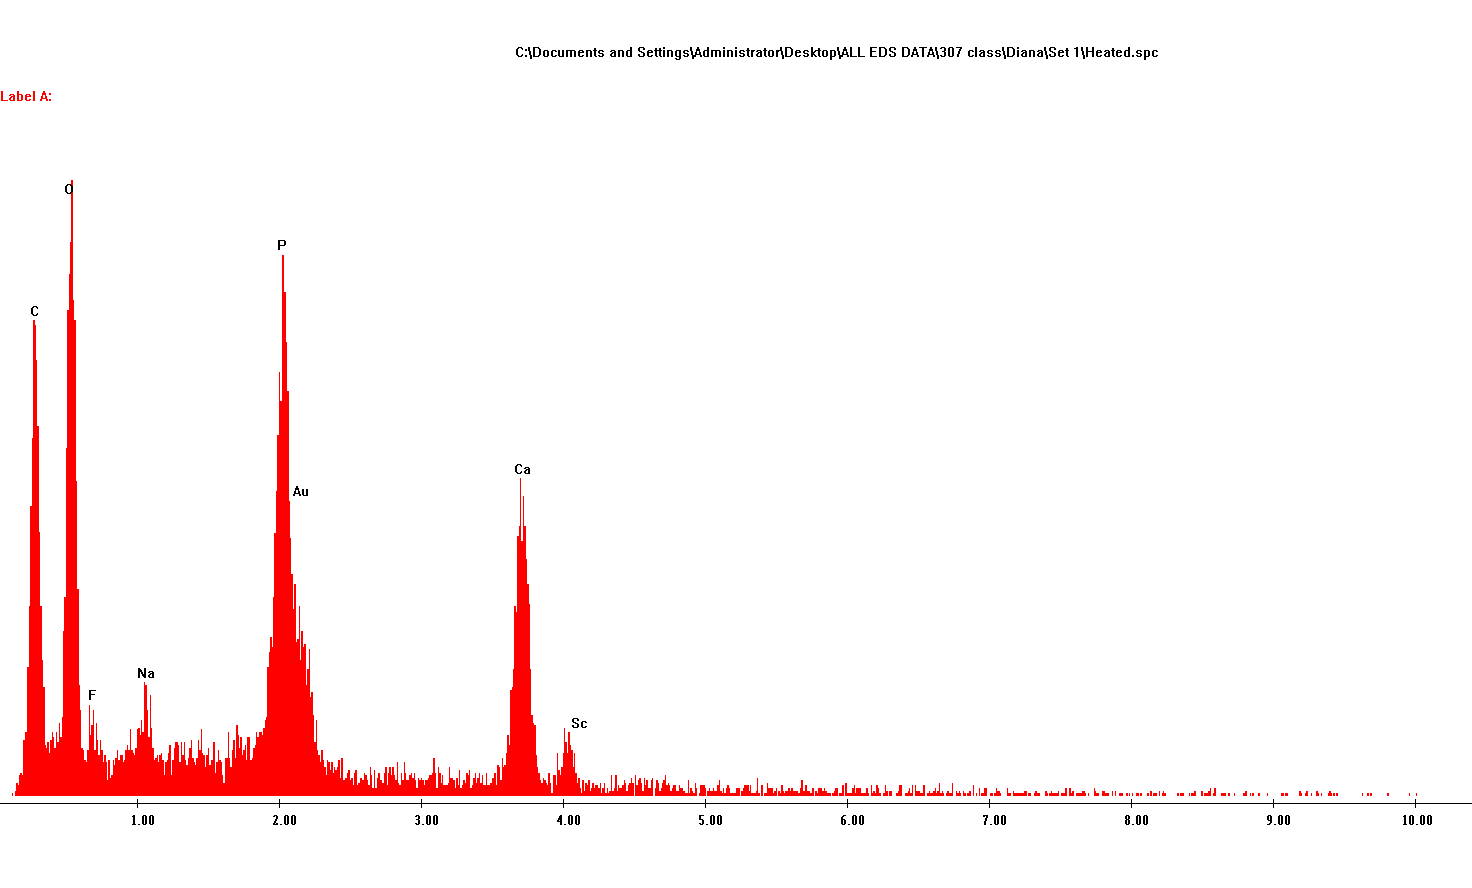
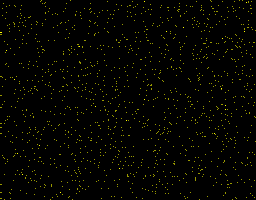
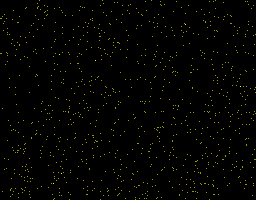
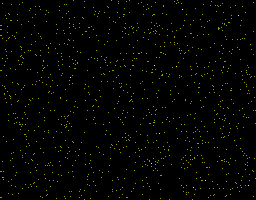
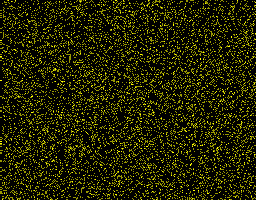
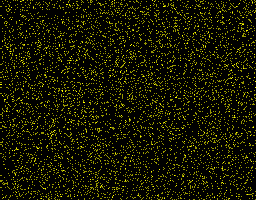
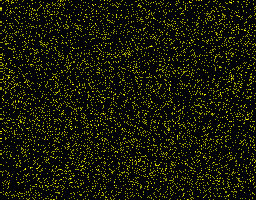
Titanium with heated HAP (left-right: Tc, Sc, Rb, P, O, Ni, Na, Fe, C, Ca, and Au)


Titanium with HAP (left-right: Tc, Sc, Rb, P, O, Ni, Na, Fe, C, Ca, and Au)


The following x-ray spectrums were captured for all five different surfaces with cell seeding. From top to bottom the x-ray spectrums correspond to titanium, positive HAP, negative HAP, heated HAP and HAP respectively