|
Striped Bass
Light Microscopy
SEM
BSE/EDS
|
Light Microscopy
|
 |
|
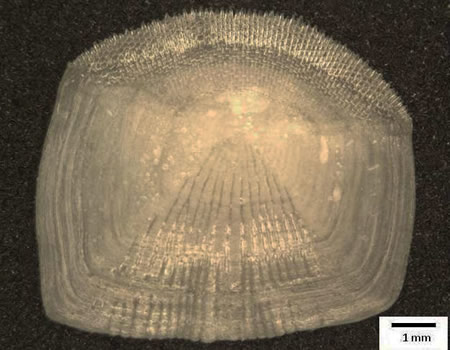
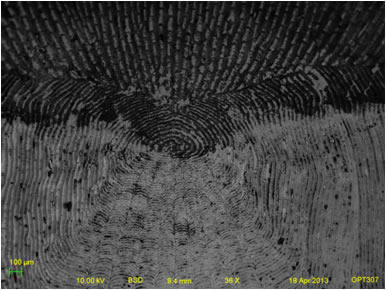
Fig.1 Light microscpy image of the striped bass scale
|
|
SEM
|
|
|
|
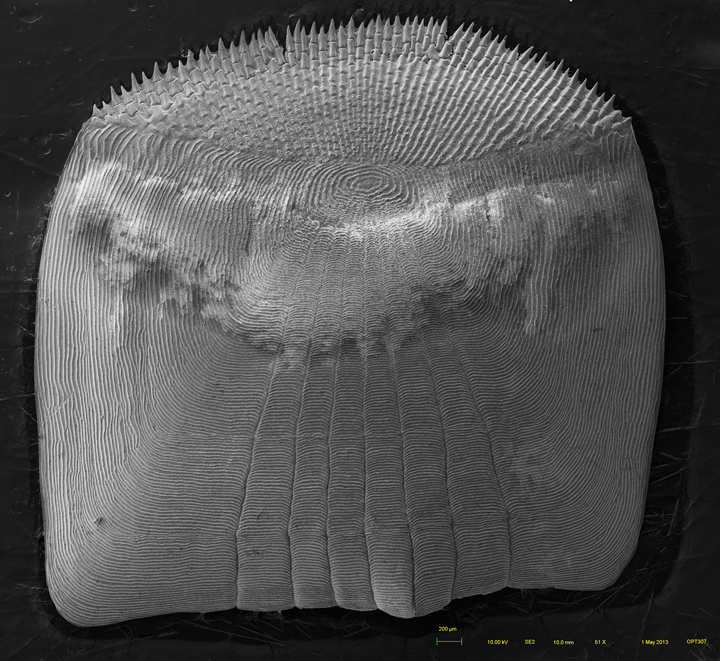
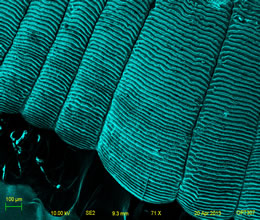
Fig.2 Panorama SEM image of the striped bass scale
(press ctrl + for more details)
|
 |
 |
 |
|
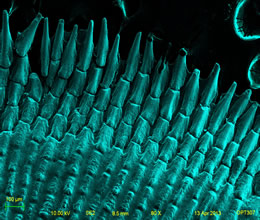
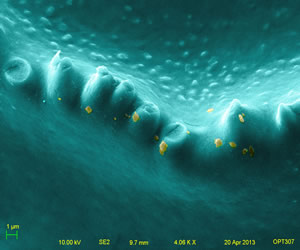
Fig.3 First domain of the striped bass scale (left: ctenii;
middle: tip of the ctenii; right: web between the ctenii)
|
 |
|
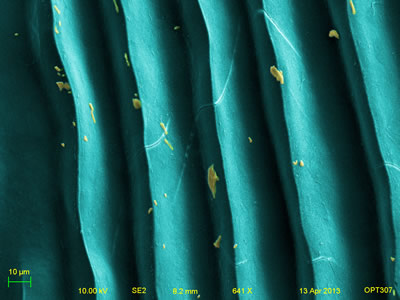
Fig.4 Second domain of the striped bass scale (striped pattern
without radii)
|
 |
 |
 |
|
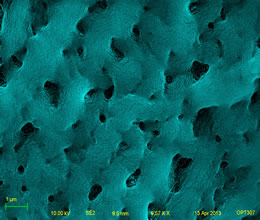
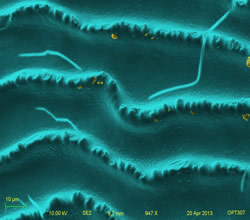
Fig.5 Third domain of the striped bass scale (lefi: inter radial
area pattern; middle: patten and cracks; right: teeth)
|
|
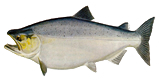
Fig.1-5 show that how the striped bass scale looks
like. It is noticed that the striped bass scale has a "toothed"
outer that is quite different from the salmon scale. Furthermore,
the striped bass scale has three domains in the micrograph: one is
featured the bony texture with the tooth-shaped ends(Fig.3); the
second one has striped pattern but no radii (Fig.4); and the third
one has the similar striped pattern as the second one but has
radii.In fig.5, several cracks are observed because of surface
tension during air drying. In addition, in fig.3-5, impurities are
found on the sample surface (yellow spots).
|
| BSE/EDS |
 |
 |
| Fig.6 BSE image of striped bass scale |
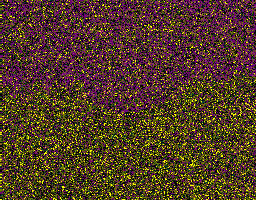
Fig.7 Assembled X-ray mapping of the striped bass
scale |
| |
|
In fig.6, the contrast of the striped bass scale is observed due
to the elements dustribution. The dark area has more carbon than
that of the bright area which results from more calcium, which is
consistent with fig.7.
|
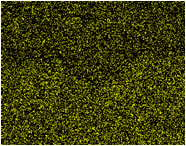 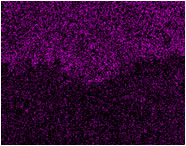 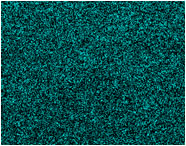 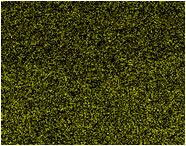 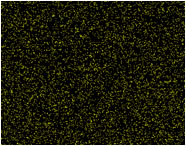 |
| Ca C O P Au |
|
Fig.8 Elements distribution of striped bass scale
|
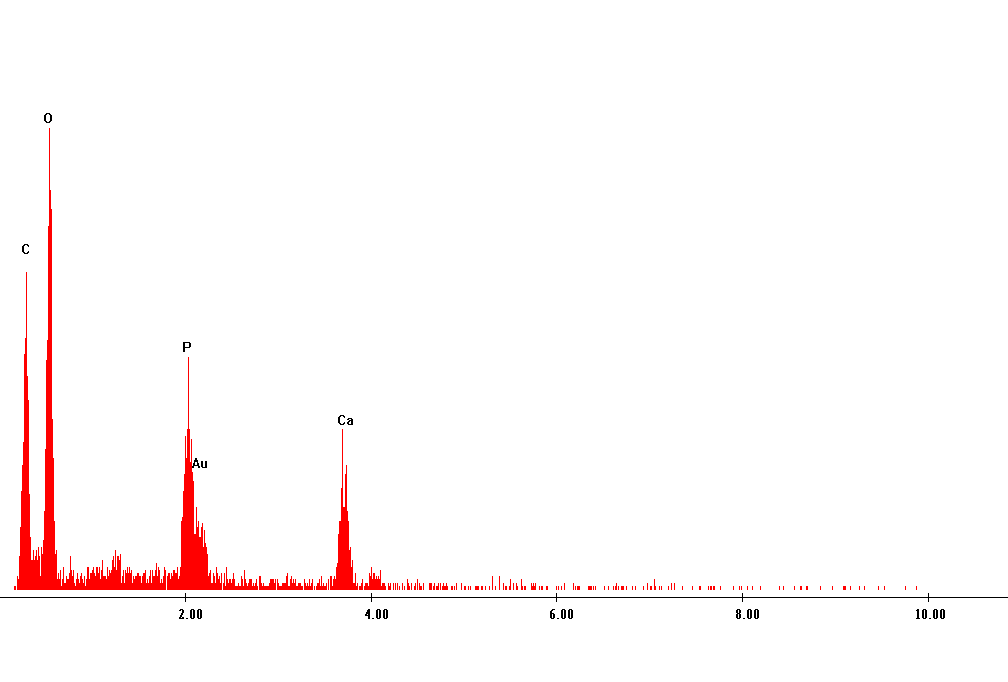 |
| Fig.9 X-ray pattern of the striped bass
scale |
| |
| |