Electrochemical Deposition of Hydroxyapatite (HAP) Coating

All samples of hydroxyapatite were prepared via the electrochemical depositional process described in the literature of Professor Yates’ group at the University of Rochester, with the exception of two samples which were plasma sprayed hydroxyapatite coatings on titanium substrates; these were purchased from a common supplier for comparison to electrochemically deposited HAP.

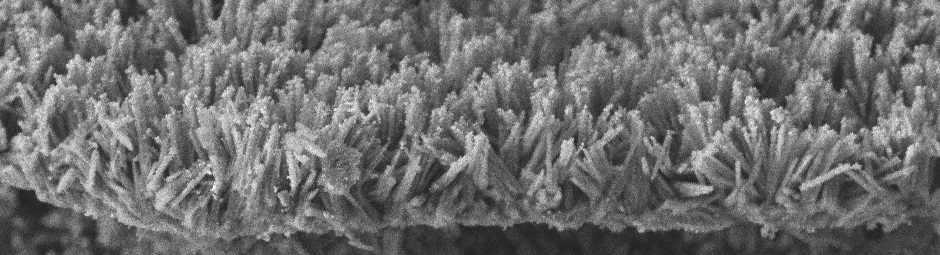
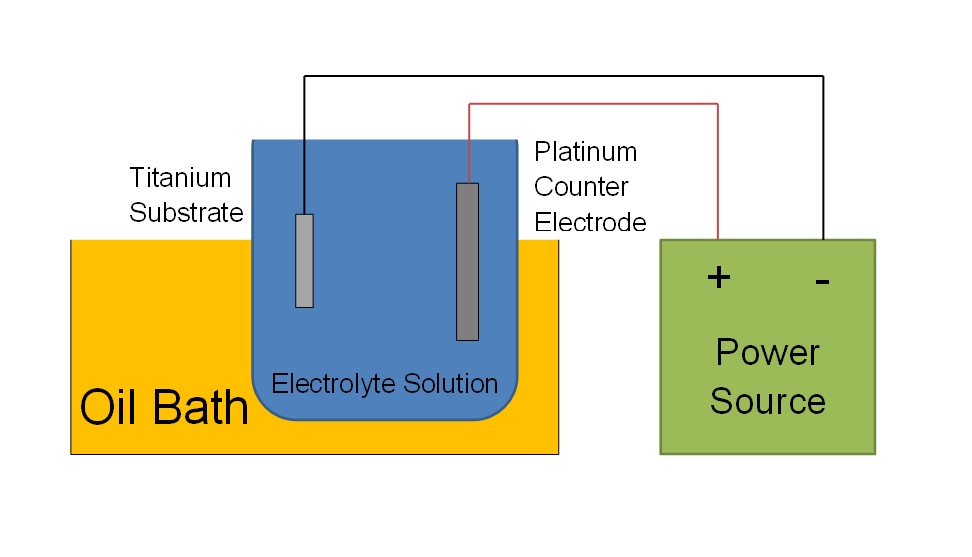
The hydroxyapatite layer was electrochemically deposited on titanium plates (12.5 by 12.5 by 0.89mm) which were washed thoroughly with hand soap, rinsed, then washed with an industrial detergent solution, and thoroughly rinsed again. The substrate was cleaned ultrasonically for 2 hours in 50/50 ethanol/acetone and then for 30 min in DI water. The cleaned titanium plate was used as the anode for electrochemical deposition of hydroxyapatite and the cathode was a platinum plate (25 by 25 by 0.127 mm). The anode and cathode were maintained parallel to one another at a fixed distance of separation of 10 mm using a custom Teflon holder. The electrodes were connected to a power supply using platinum wire for the cathode and silver wire for the anode. The electrodes were then submerged in an aqueous solution consisting of 1.25 mM CaCl2 and 0.827 mM K2HPO4. The solution’s electrolytic ability was enhanced with the addition of 138 mM NaCl; the solution’s pH was buffered with tris(hydroxymethyl)-aminomethane and adjusted to pH 7.2 with concentrated HCl acid. The electrolyte solution was maintained at ~95ºC using an oil bath. Both the electrolyte solution and oil-bath were stirred using magnetic stir bars. Deposition was carried out for 5 minutes at 12.5 mA/cm2 (area relative to the platinum plate); the coated substrate was then removed from the solution, allowed to cool, then rinsed thoroughly with DI water. The sample was allowed to dry in air. Two HAP samples were adhered to a sample stub by a small piece of conductive carbon tape for imaging.

Schematic of Electrochemical Deposition

Electrochemical Reduction of Ag Nanoparticles

For each HAP sample deposited with Ag nanoparticles by electrochemical reduction, the conditions found by Keith Savino to be ideal were utilized to produce samples worth characterizing. A 1.25 mM Ag(NO3) and 1.25 mM NaCl solution was prepared and maintained at ~95ºC. In a similar fashion as the deposition of the HAP coating, the HAP sample was again used as the anode, separated from the platinum by 10 mm. Immersed in the prepared silver solution, the electrochemical reaction was carried out for 90 seconds at 12.5 mA/cm2 (area relative to the platinum plate). The sample was then rinsed with DI water and air dried. Once dry, two deposited Ag samples were affixed to sample stubs by small pieces of conductive carbon tape for imaging.

Sputter Coating of Ag Nanoparticles

For each HAP sample on which Ag nanoparticles were sputter coated, the sample was first adhered via conductive carbon tape to a sample stub. Each sample was then placed within the vacuum chamber of a Denton Vacuum Sputter Coater containing a silver target. The chamber was pumped down to approximately 100 mTorr, backfilled with Argon gas, and repeated several times. The sputtering took place under conditions of 15 mA current for 30 seconds to produce nano-island coating.

Imaging

Secondary Electron and Backscattered Imaging: Each of the four types of samples (HAP, plasma sprayed HAP, deposited Ag, and sputtered Ag) were imaged in a Field Emission source Zeiss Auriga CrossBeam Scanning Electron Microscope-Focused Ion Beam (SEM-FIB) affixed with an EDAX x-ray spectrometer. Images were collected in SE2, InLens, and BSD modes. Various imaging parameters were adjusted to produce meaningful and clear images. The specific parameters are noted on each image collected; however, whenever possible, working distance, magnification, accelerating voltage, aperture size, contrast, and brightness were maintained consistent between sets of images for comparison. Each sample was imaged in an area that was representative of the entire sample, unless otherwise noted. When possible, approximately the same area of each sample was imaged for all adjusted parameters for ease of comparison.

Energy Dispersive Spectra and Map Collection: Three representative EDS spectra of each sample were collected with an EDAX x-ray spectrometer and the EDAX Genesis software. The accelerating voltage was set to 15 kV for acquisition. Elemental identification was performed; manual manipulation was undertaken to search for peak overlap and mis-IDs. Quantitative analysis of each spectrum was undertaken and the relative elemental composition values were analyzed further with Microsoft Excel. The EDAX Genesis software was used to collect an elemental map automatically for all elements IDed. The parameters used were resolution 256x200, dwell 100 µs, ROIs, and 32 frames.

Atomic Force Micrograph Collection: The deposited Ag sample was imaged using a NT-MDT Atomic Force Microscope/Scanning Probe Microscope (AFM/SPM) in semi-contact, topographical mode at 0.2 Hz. Various areas were imaged with third order imaging in both 2-dimensions and 3-dimensions. Using the NT-MDT AFM software, the roughness of each image was investigated. Quality images or analysis of the sputter Ag nanoparticles were not able to be produced.

Image Processing

The images collected via SEM and AFM provide mostly qualitative, morphological information. However, selected images were quantitatively analyzed using the ImageJ Image Analyzing Program. Various aspects of the HAP coating and Ag nanoparticles were quantified, including thickness of the HAP layer.

Selected images were adjusted using Adobe Photoshop. Some images had the brightness and contrast adjusted to better clarify meaning. A handful of images, particularly ones of the same area but collected on different detectors, were colorized using the Photoshop software. One set of two images, collected at an offset of a left-right tilt of 3 degrees, were turned into a stereo pair anaglyph for 3D viewing.