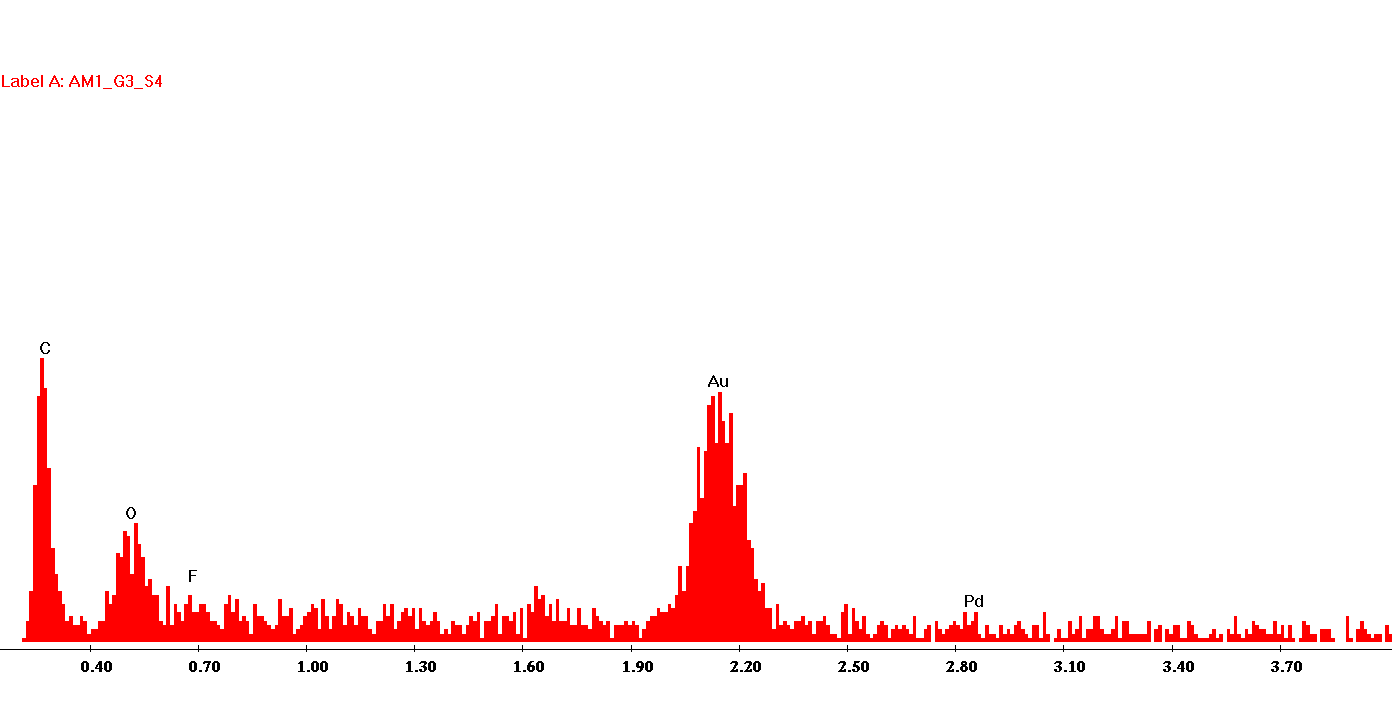
Figure 3.1 EDS Spectrum of the sample shows the presence of Carbon and Oxygen.
EDS is used to find the elemental composition of the sample. The sample is characterized by the peaks on the X-ray emission spectrum which are unique to a particular element.
It was found that the fabric was indeed made up of mainly Carbon (C) and Oxygen (O) since it is organic. A peak indicating Gold (Au) is also present indicative of the fact that the sample was sputter coated with a considerable layer of gold.

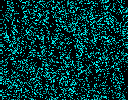
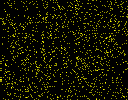
Figure 3.2 EDS Map of the sample showing spatial distribution of Carbon, Oxygen and Gold (from left to right)