|
|
SEM The nanoparticles
were characterized using the SEM (Zeiss Auriga, Gemini column)
in the Institute of Optics at the University of Rochester.
The SE2 and InLens detectors gave the best images.
Three different types of samples were imaged at an
accelerating voltage of 20kV and a working distance of 5mm. It appears as though there are some agglomerates of particles, which may be an indication of insufficient washing of the nanoparticles. The result is surfactant present on the nanoparticles. 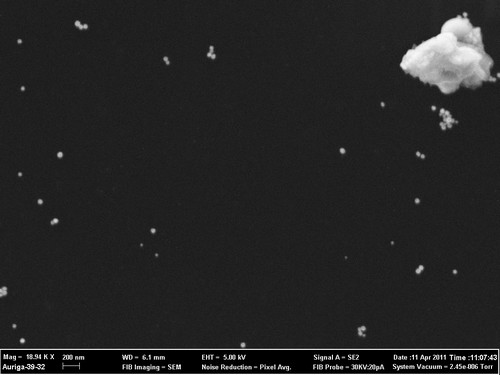 Figure 1: Low concentration Pd-Ag NPs, SE2 detector 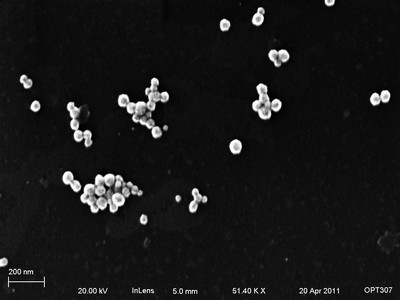 Figure
2: Medium concentration Pd-Ag NPs, SE2 detector
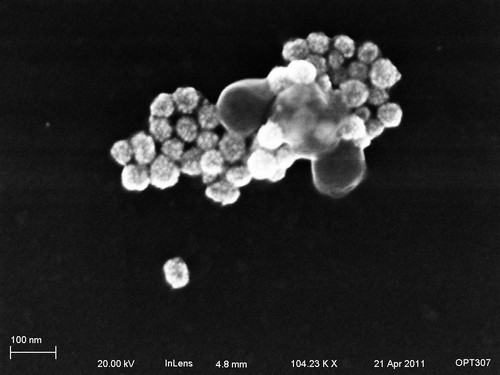 Figure 3: High concentration Pd-Ag NPs, InLens detector |