|
|
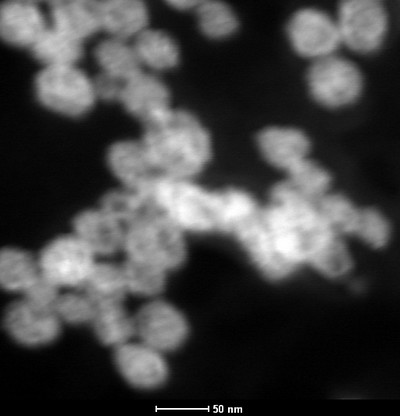
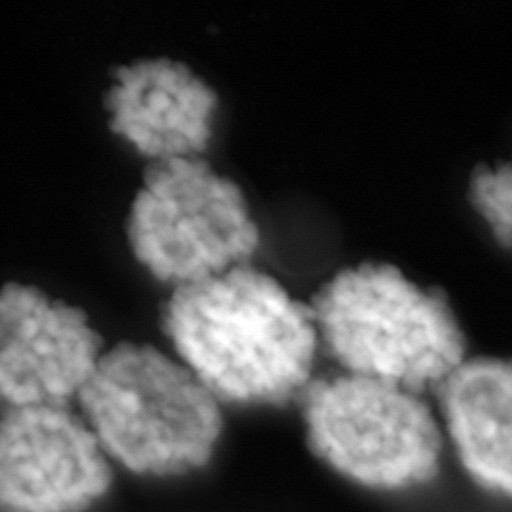
TEM Bright field imaging of all three of the samples was done on the FEI Tecnai F20 TEM at an accelerating voltage of 200kV. 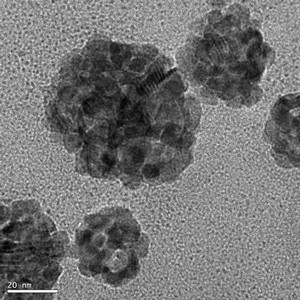 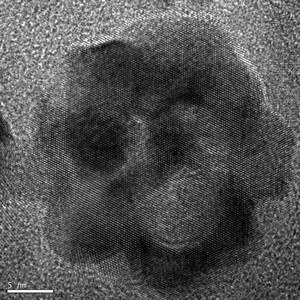
Figure 4: Low concentration Ag-Pd NPs
Figure
5: Low concentration Ag-Pd NPs,
high resolution

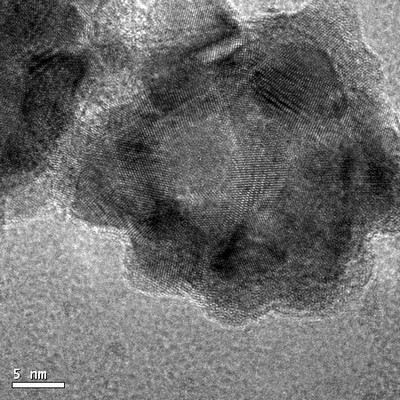
Figure 6: Medium concentration Ag-Pd NPs
Figure 7:Medium concentration Ag-Pd NPs,
high resolution 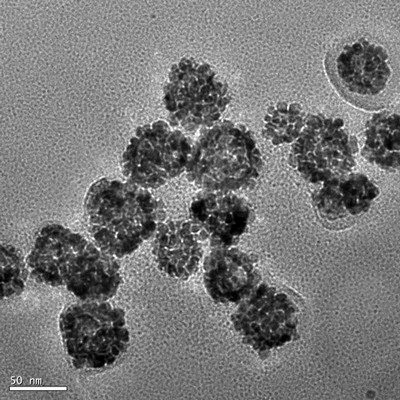 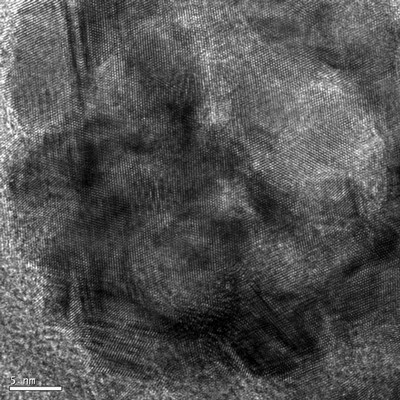 Figure 8: HIgh concentration Ag-Pd NPs Figure 9:HIgh concentration Ag-Pd NPs, high resolution
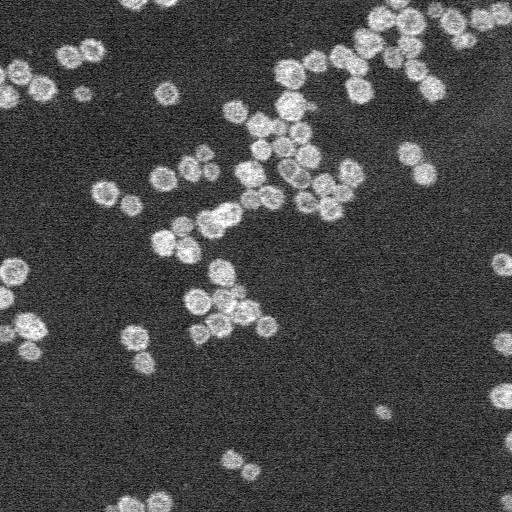
Scanning Transmission Electron
Microscope The HAADF detector was used in the TEM in order to take STEM micrographs of each of the three samples. The quality of the micrographs is not nearly as good here as for the previous TEM micrographs.
Figure 10: Low concentration Ag-Pd NPs
Figure 11: Medium concentration Ag-Pd NPs
Figure
12: HIgh concentration Ag-Pd NPs
|