
Energy Dispersive X-Ray Spectrometry (EDS)
Energy Dispersive Spectroscopic (EDS) methods were used on SEM images of the shales and the ferruginous layer to characterize them compositionally. A combination of SEM image and X-ray mapping was carried out to identify the distribution of major elements in the rock sections and to interpret the sudden change of composition across a sharp boundary.
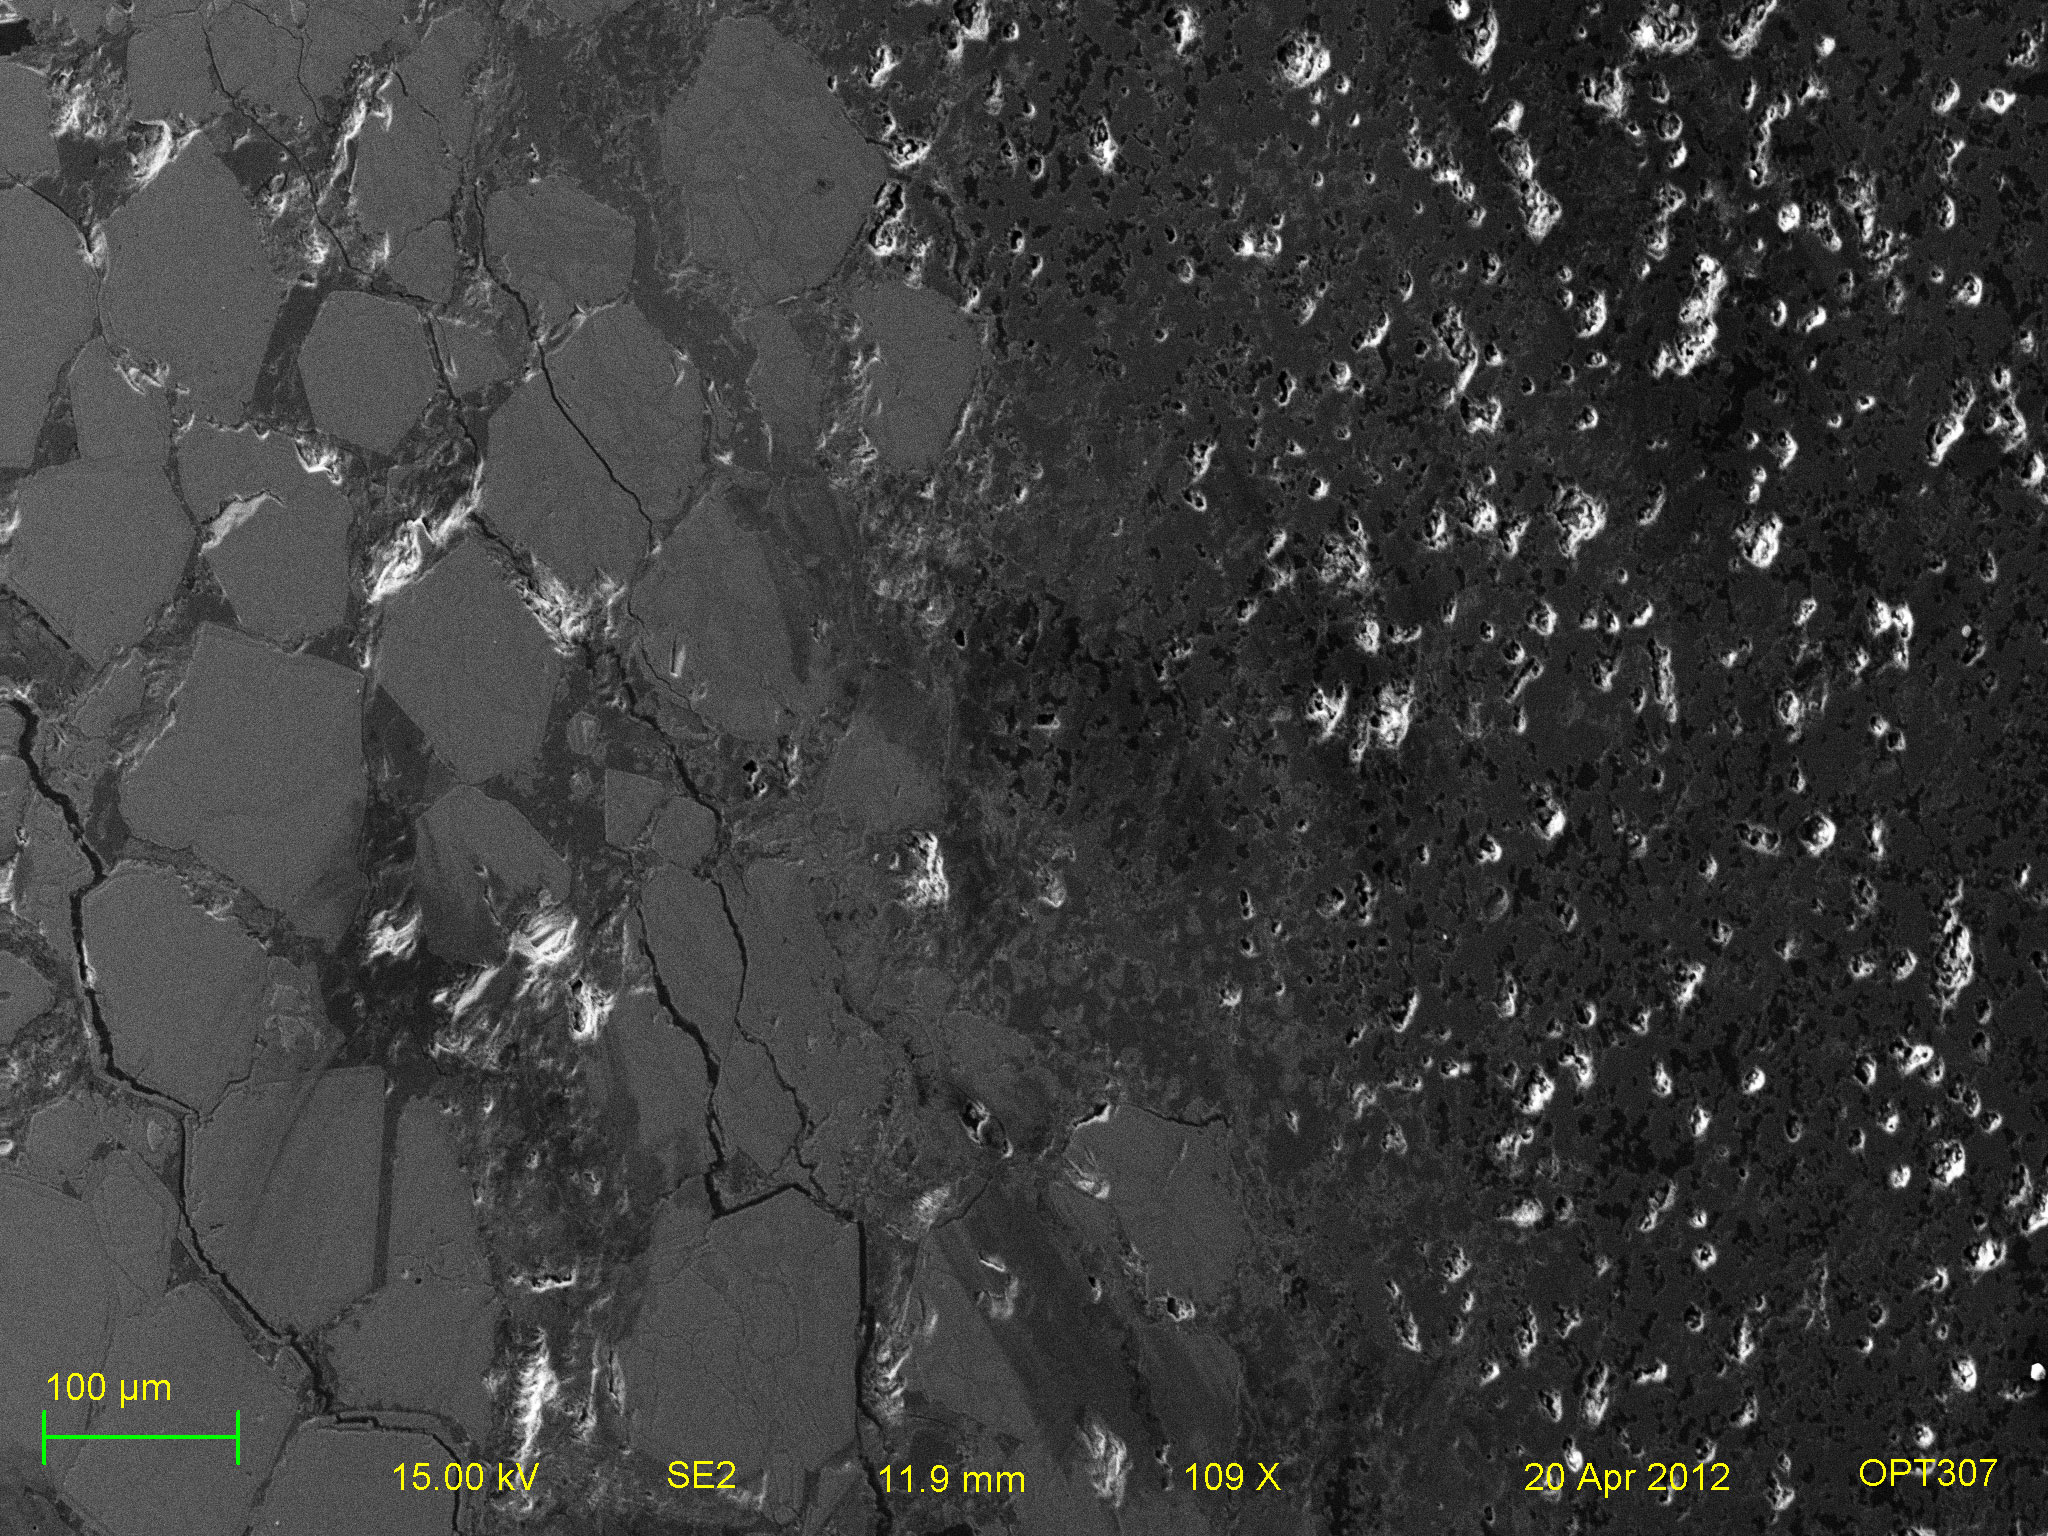
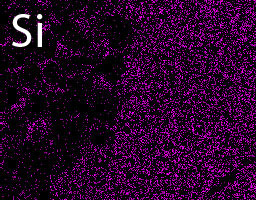
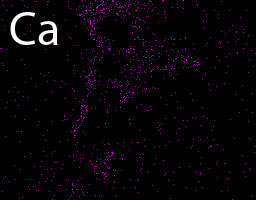
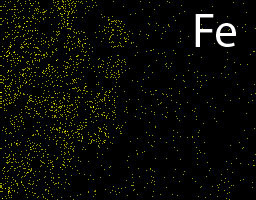
Fig.1: SE2 electron micrograph and X-ray maps depicting the transition from Permian shales to the ferruginous layer in the Mud section. It is clearly seen that the composition changes from a silicon rich phase to a iron rich phase, separated by a calcium rich zone. (Browse on thumbnails to view enlarged image)
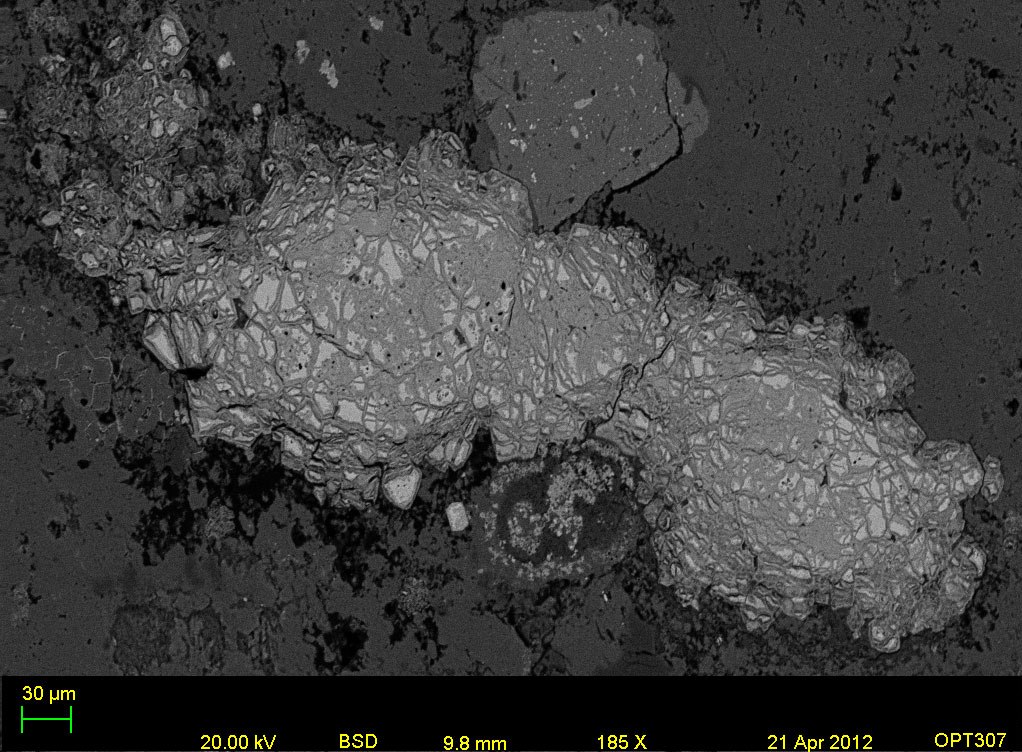
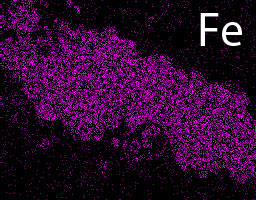
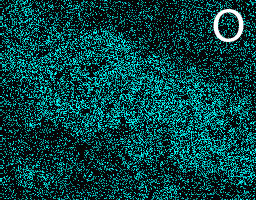
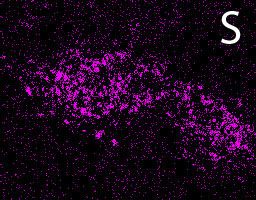
Fig.2: BSD electron micrograph and X-ray maps of an Fe-rich zone in the ferruginous layer, coexisting as a sulfide and an oxide.