Author
- Vu Trinh
- Zijin Ye
- Jianhao Gao
- Felix Hammond
Sponsor
From UR Libraries:
- Sarah Siddiqui
- Daniel Castillo
Instructor
Professor Cantay Caliskhan
Abstract
This project develops an interactive Tableau dashboard to analyze the University of Rochester’s
scholarly output from 2015 through 2019. Publication records were initially extracted in raw XML
format and subjected to a comprehensive cleaning pipeline—parsing author names, normalizing
departmental and affiliation metadata, and filtering out incomplete entries. Cleaned data were then aggregated to compute annual totals, mean and median author/affiliation counts, and departmental and publisher-level statistics. The resulting dashboard features three linked sections: an Overview (highlighting total publications rising from 3,800 to 4,700, and average affiliations increasing from 11 to 15), a Department view (bar, treemap, and trend-line analyses revealing the Medical Center’s dominance and stable optical sciences output), and a Publisher view (treemap, bar chart, and multi-line trends underscoring leading partners such as Wiley and Elsevier). Additional modules examine intra- and inter-departmental collaborations, top external institutional partners, and global research networks via a world map. Interactive filters (year slider, department/publisher selectors, and search boxes) enable dynamic exploration. Together, these tools provide administrators and researchers with actionable insights into publication growth, interdisciplinary collaborations, and strategic research partnerships.
Data
This project uses data from the years 2015 to 2020. The data is very large and messy, and it comes in a special XML format that is hard to read or work with directly. Before we could analyze anything, we had to clean and organize the data using a custom parsing method. This section explains what the raw data looks like and how we parsed it.
Data Parsing
Parsing the data was one of the hardest parts of this project. At first, we tried several methods to extract the information, but many of them were too slow or would crash because of the file size. We needed a way to make the process faster and more efficient. In the end, we used a method that worked well: Break the Data into Chunks: Since the files were too big to open all at once, we split them into smaller parts and processed them one at a time. We saved these parts in a temporary folder (scratch space). Search for Keywords: We wrote Python code to look for the tags we needed — like names, titles, and years — and pull just that information out of the XML. Put the Data Together: After each chunk was parsed, we combined the results into one big CSV file. Clean the Output: Finally, we cleaned the CSV file by removing duplicates and fixing small formatting issues. Some early methods took more than 24 hours to process just one year of data. Our final method is much better — now it takes less than 12 hours to parse a full year. That means we could finish parsing all six years in just a few days using one machine. Now, the data is saved in clean CSV files that are easy to work with in Python or Excel.
EDA
We are focusing on the specific publication in the University of Rochester. We will analysis the overall publication result and the publication from specific years and departments so that all people could find the useful parts in finding research partners.
Publication Analysis
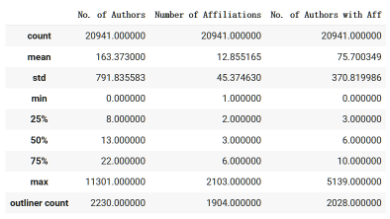
The overall publication result in Fig 1 and 2 shows us that there are about 20000 publications from University of Rochester in year 2015 to 2019. The most striking feature is the dramatic disparity between mean and median values across all three metrics. For author counts, the mean of 163.37 is more than twelve times higher than the median of 13, while for affiliations, the mean of 12.86 is over four times the median of 3, and for authors with affiliations, the mean of 75.70 exceeds the median of 6 by more than tenfold. The range statistics reveal the extraordinary scale of collaborative research represented in the dataset. Author counts span from 0 to 11,301, affiliation counts from 1 to 2,103, and authors with affiliations from 0 to 5,139. The quartile distributions (25th, 50th, and 75th percentiles) demonstrate that the majority of publications follow conventional patterns: the inter-quartile range for authors is 8-22, for affiliations is 2-6, and for authors with affiliations is 3-10. However, the outlier counts are substantial, with 2,230 papers (10.7%) having exceptional author numbers, 1,904 papers (9.1%) showing unusual affiliation counts, and 2,028 papers (9.7%) displaying atypical numbers of affiliated authors. These statistics confirm that while most University of Rochester publications conform to traditional academic collaboration patterns, a significant portion represents massive international research consortium where large-scale collaboration is standard practice.
COLLABORATION ANALYSIS
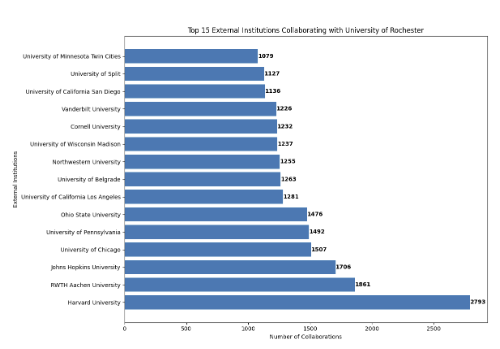
The figure is the analysis of the University of Rochester’s top 15 external institutional collaborators, which reveals several significant patterns in its research partnerships from 2015-2019.
Harvard University stands as the dominant collaborative partner with 2,793 joint publications, representing nearly 50% more collaboration than the second-ranked institution. This exceptional partnership likely reflects shared research priorities and complementary strengths across multiple disciplines.
The subsequent tier of collaborators demonstrates more balanced engagement levels. RWTH Aachen University (1,861 collaborations) and Johns Hopkins University (1,706) occupy prominent positions, followed closely by a cluster of elite American research universities including the University of Chicago (1,507), University of Pennsylvania (1,492), and Ohio State University (1,476). Geographic and institutional diversity characterizes the collaboration network. While American institutions dominate the list with 12 of 15 positions, notable international partnerships include RWTH Aachen University (Germany), University of Belgrade (Serbia), and University of Split (Croatia). This international dimension aligns with previously observed global collaboration patterns, particularly the strong European connections.
The concentration of prestigious institutions—including multiple Ivy League universities (Harvard, Cornell, University of Pennsylvania) and leading research centers (Johns Hopkins, Northwestern, University of Chicago)—indicates Rochester’s strategic positioning within elite academic networks. The collaboration frequencies, ranging from 1,079 to 2,793, suggest sustained, substantive partnerships rather than occasional interactions.
The presence of both comprehensive research universities and specialized institutions in biomedical research (such as Johns Hopkins) reflects Rochester’s dual strengths in medical sciences and broader academic disciplines. This partnership portfolio supports the university’s research strategy while providing access to complementary expertise and resources across diverse fields.
INTERNATIONAL COLLABORATION
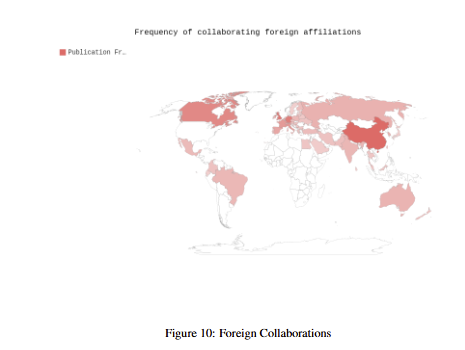
The map in displays the University of Rochester’s international research collaborations between 2015-2019. The university’s international collaborations span across six continents, with pronounced concentrations in specific regions. The intensity of color indicates frequency of collaboration, with deeper red shades representing more frequent partnerships. Based on the map, China stands out as the most frequent international collaborator, shown in the deepest red color. This reflects the broader trend in U.S.-China academic collaboration, particularly in STEM fields and large-scale research projects.
The university also maintains robust relationships across Western and Central Europe, with particularly strong connections to the United Kingdom, Germany, France, Italy, Spain, the Netherlands, and Switzerland. These partnerships represent traditional academic alliances built on shared research values, established exchange programs, and complementary expertise. The concentration of European collaborations suggests a strategic focus on regions with advanced research infrastructure and similar academic standards.
A secondary tier of partnerships encompasses developed economies in the Asia-Pacific region, including Japan, South Korea, Australia, and New Zealand, alongside Canada in North America. These relationships appear more selective than the European network but remain substantial, likely focusing on specific areas of mutual research interest. Russia occupies an intermediate position within this tier, with moderate collaboration levels that suggest targeted partnerships in specific scientific domains, potentially including physics, mathematics, and environmental studies.
Emerging research economies such as India and Brazil show meaningful but less intensive collaboration, but the notably limited engagement with African institutions reveals a significant gap in the university’s global network.
Dashboard
The dashboard encompasses all publication data from the University of Rochester for the years 2015–2019. It provides summary statistics (total number of articles, average number of affiliations per paper, most prolific publishers) and allows analysis at both department and publisher levels.
- Overview Section: Descriptive statistics and trends for the publication at U of R.
- Department Section: Drill-down views showing publication counts and trends by top department.
- Publisher Section: Analysis of article counts and trend per top publishers.
- Interactive Filters: Year-range slider, access to department and publisher section
Overview Section
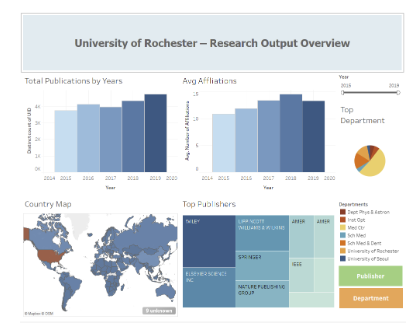
The overview provides a high-level snapshot of UR’s research output from 2015 to 2019. On the left, two coordinated bar charts show annual totals—distinct publications rising from roughly 3,800 in 2015 to 4,700 in 2019—and the average number of institutional affiliations per paper, which climbs from about 11 to 15 over the same period. At top right, an interactive year-range slider sits above a pie chart of the top-contributing department. The lower panels display a world map of country-level collaborations and a treemap highlighting UR’s most prolific publishers (Wiley, Elsevier, Springer, etc.). A color legend and toggle buttons at the right allow users to switch between department and publisher-focused views. Together, these elements let stakeholders track growth trends, gauge interdisciplinary reach, and identify leading departments and publishers at a glance.
Department Section
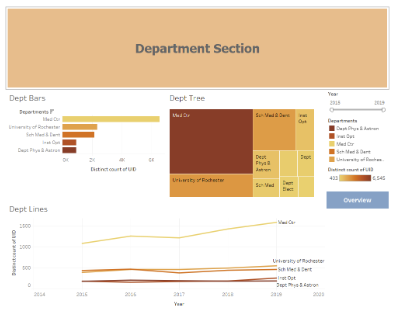
This section zooms in on departmental performance. In the top-left, a horizontal bar chart ranks departments by total distinct publications within the selected year range (e.g. the Medical Center leads with roughly 6,500 publications, while Physics & Astronomy reports around 400). To its right, a proportional treemap highlights each department’s share of output, reinforcing the Medical Center’s dominance alongside secondary contributors such as the School of Medicine & Dentistry and the Institute of Optics. Below, a multi-line chart traces each department’s annual trajectory—showing, for instance, the Medical Center’s steady rise from about 1,100 papers in 2015 to 1,500 in 2019, and smaller but consistent growth across other units. Interactive controls (year-range slider, department legend, and a toggle button back to the Overview) ensure users can filter and compare departmental trends dynamically.
Publisher Section
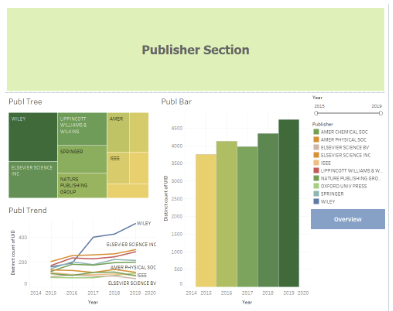
This section focuses on publisher-level insights. In the top-left, a treemap (“Publ Tree”) allocates area to each publisher by total distinct publications, with Wiley and Elsevier Science Inc. dominating. To the right, a vertical bar chart (“Publ Bar”) shows yearly counts for the leading publisher—rising from about 3,800 in 2015 to 4,700 in 2019. Below, a multi-line chart (“Publ Trend”) plots year-over-year trajectories for each major publisher, highlighting Wiley’s surge after 2016 and steady growth among peers like Springer and the Nature Publishing Group. Interactive elements—a year-range slider, publisher legend, and an “Overview” toggle button—allow users to filter the view dynamically, compare publisher performance over time, and switch back to the high-level dashboard overview.
Conclusion
This research output analysis of the University of Rochester publications from 2015-2019 reveals a robust and strategically focused academic institution with clear research priorities and collaborative patterns. The comprehensive examination of 20,941 publications demonstrates that UofR maintains a strong emphasis on medical and health sciences research, with the Medical Center and affiliated departments consistently producing approximately 44% of the institution’s scholarly output. This concentration aligns with the university’s strategic identity as a leading medical research institution while maintaining significant secondary strengths in optical sciences and physics. The publication trends show steady growth over the five-year period, with total publications increasing from approximately 3,800 in 2015 to 4,700 in 2019, representing a 24% increase. Simultaneously, the average number of institutional affiliations per paper rose from 11 to 15, indicating expanding collaborative networks. This growth trajectory remained remarkably consistent across departments, suggesting institutional stability and sustained research priorities.
Collaboration patterns reveal a sophisticated research ecosystem with clearly defined hubs. The
Medical Center serves as the primary institutional nexus, particularly through its extensive partnership with the School of Medicine & Dentistry (222 collaborations). Meanwhile, the Institute of Optics functions as the center of a distinct collaborative cluster involving physics, engineering, and vision science departments. These departmental networks demonstrate effective pathways for translating basic research into clinical and applied contexts.
External partnerships follow equally strategic patterns. Harvard University stands as UofR’s most significant external collaborator (2,793 joint publications), followed by RWTH Aachen University (1,861) and Johns Hopkins University (1,706). The institution’s global collaborations emphasize connections with China, Western Europe, Canada, and select Asia-Pacific nations, revealing deliberate prioritization of partnerships with established research powerhouses.
The interactive Tableau dashboard developed through this project provides university administrators and researchers with powerful visualization tools to track publication growth, identify interdisciplinary opportunities, and evaluate strategic research partnerships. By integrating temporal, departmental, and collaborative dimensions, the dashboard enables data-driven decision-making for research development and resource allocation.
The University of Rochester’s research profile reflects a deliberate balance between institutional specialization and broader academic engagement. By leveraging historical strengths in medical sciences and optics while selectively participating in large-scale collaborative networks, UofR has established a distinctive research identity that contributes substantially to global knowledge production across multiple domains.
Acknowledgement
We would like to extend our sincere gratitude to the following:
- The Data Science Department at the University of Rochester for providing a strong academic foundation and support throughout this course.
- UR Libraries for sponsoring and facilitating this project with valuable resources and mentorship.
- Professor Cantay Caliskan for his insightful guidance, continuous encouragement, and expert advice that helped shape the direction of our work.