1. Team
- Qinqin Xiao
- Yuting Bu
- Muyuan Chen
- Peng Jiang
- Yukun Yang
2. Mentor
Georgen Institute for Data Science (GIDS)
3. Sponsor
Lisa Altman
4. Abstract
Due to the continuously increased demand for Data Science degrees, our school will open a Data Science PhD program soon. Our project can help our school have a better understanding of the potential DS PhD for future recruitment and marketing efforts. We achieve this goal by analyzing the applicants and admissions data of current CS and ECE PhD, and DS master, and predicting DS master decisions for PhD reference using Logistic Regression, Random Forest, SVM. Multinomial Naive Bayes, and K-nearest Neighbors (KNN).
5. Dataset
- Clearinghouse Data (2013-2018, 2020-2021)
- GIDS Admissions Data (2013-2023)
- College Rankings Data
6. Agenda
- Create Application – Upload Materials – Submit Application
- Admission Office Reviewing – Admission Release
- Applicants Decision – Final Enrollment
- Prediction
7.1 Create Application – Upload Materials – Submit Application
How many applicants applied to each program?
Program outlines:
- Ph.D. Program
- Computer Science
- Electrical and Computer Engineering
- Applicants for Ph.D. Programs (2015-2022)
- Master Program
- Electrical and Computer Engineering
- Computer Science
- Data Science
- Applicants for master Programs (2015-2022)


- The popularity of DSC and CS were increasing since 2015, especially for Data Science program. (Increase around 2000 percent from 2015 to 2022)
- The CS-Ph.D. Program has higher demand than the ECE-Ph.D. Program.
- There are twice more applicants of CS-Ph.D than the applicants of ECE-Ph.D. Program.
What are the applicants’ backgrounds? (Genders, Ages and Areas Distribution)


- DSC has the largest percentage of the female applicants among this three programs. (av.:36%)
- The average number of male applicants is approximately twice or more that of females in three programs.
- The gender distribution of ECE and CS are similar in Master and Ph.d. Programs.
- In both Ph.D. programs:
- The average number of male applicants is approximately three times that of females.
- The gender distribution over the past 8 years has been relatively stable.
Age Distribution of Master Applicants

Age Distribution of Ph.D Applicants

- The Average age of Ph.D. Applicants is older than the average age of Master Applicants.
- 95% of master’s applicants are younger than 30 years old, and 90% of Ph.D. applicants are younger than 30 years old.
Three Main Countries’ Area Admission Distribution
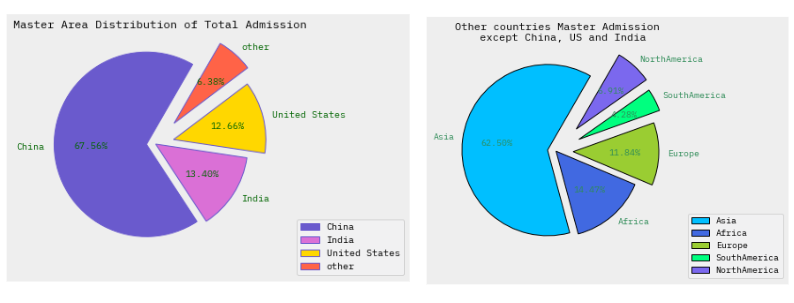
- Master:
- Three main countries of admission: China (67.56%) > India (13.40%)>US (12.66%).
- Other countries except China, US and India: Asia (62.50%) > Africa (14.47%) > Europe (11.8%) > North America (6.91%) > South America (4.28%).
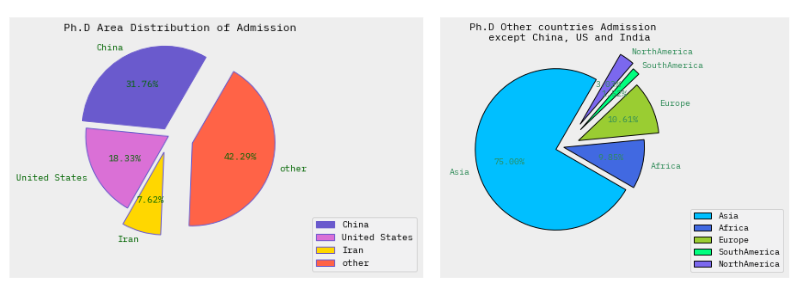
- Ph.D:
- Three main countries of admission: other > China >US > India.
- Other countries except China, US and India: Asia (75%) >Europe (10.61%) > Africa (9.85%) > North America (3.6%) > South America (1.52%).
Master Area Admission Distribution in DS, CS, and ECE


- China has more than half of the admitted students of the total students in CS, ECE, and DS.
- Three main countries applicants: China, United States, and India.
- Reason: the primary and secondary STEM education [5, 6].
Ph.D Area Admission Distribution in CS, and ECE


- The admitted students in ECE : China > US> others> Iran.
- The admitted students in CS:China > US> others> India
- Reason: the primary and secondary STEM education [5, 6].
Admission Rate of Three Main Countries (Master & Ph.D)

- Admission: UR provide students offer.
- China is higher than USA and India from 2015-2022.

- China is increasing in Ph.D admission.
- USA is slightly decreasing in Ph.D admission.
Acceptance Rate of Three Main Countries

- Acceptance: students accept UR offer.
- US acceptance rate is declining.
- In 2020, the US rate is higher than other countries.
- India acceptance rate is the highest in 2021.

- No India acceptance rate in 2020, the reason maybe is COVID-19.
- India acceptance rate increase and achieve highest in 2021.
Other Countries’ Admission Ratio Except China, US and India (Master & Ph.D)

- Asia is higher than other continents in CS, ECE and DS.
- Africa has the second highest ratio in CS.
- Europe has the second highest ratio in DS and ECE.

- ECE: Asia > Africa> Europe> North America> South America
- CS: Asia> Europe>South America
Top Ten Chinese Provinces & GDP
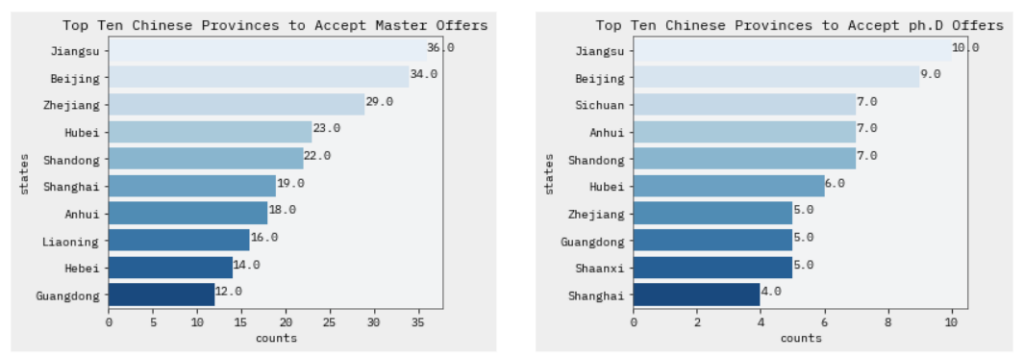

- Accepted provincial offers correlate with Chinese provinces’ GDP.
- Correlation between GDP and educational resources [4].
- Climate: Guangdong-tropical and subtropical region; North:Beijing,Liaoning
- Education resources: Hubei (35 Universities),Anhui: (31 Universities)
Top Ten USA States & GDP
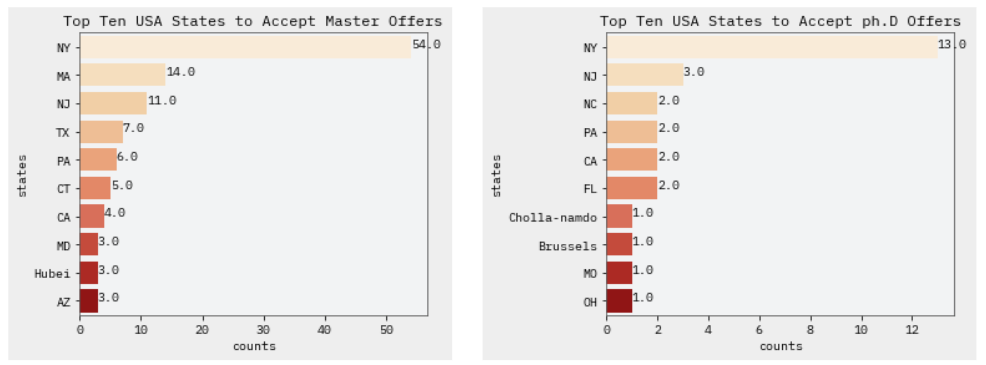
Top Ten GDP States in USA
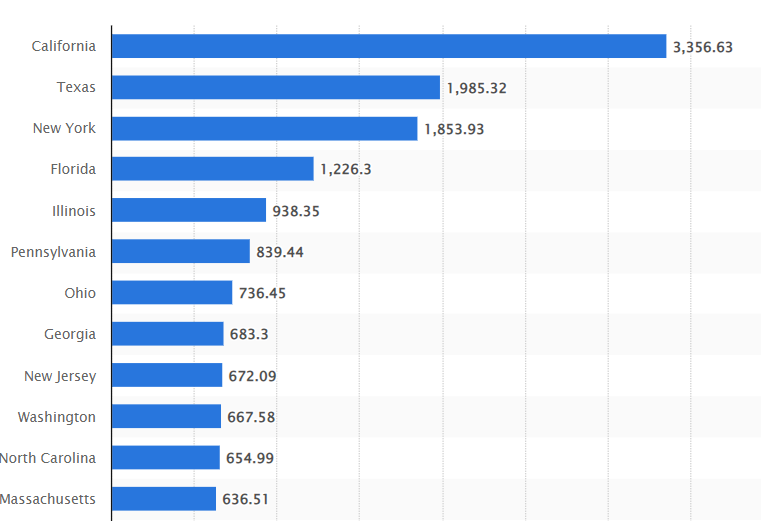
- Accepted states’ offers correlate with the states’ GDP in the USA.
- Correlation between GDP and educational resources [4].
- Climate: California.
- Education resources:
- University of California (13)
- California State University (24)
- California Community College (119)
Top Ten India States & GDP
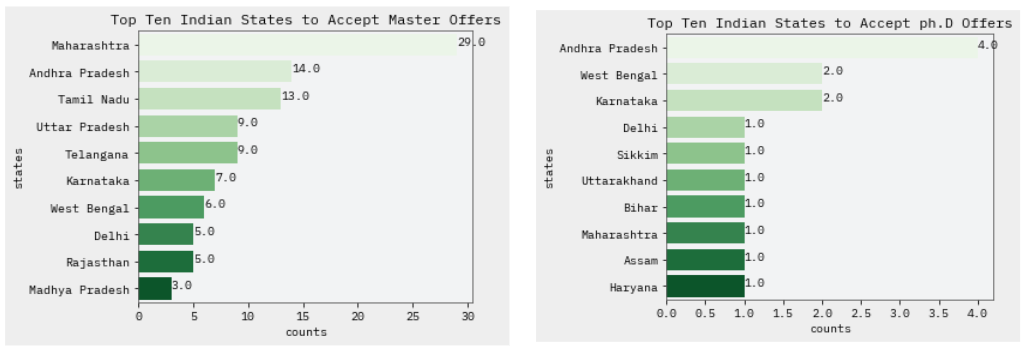
Top Ten GDP States in India

- Accepted state’s offers correlate with the state’s GDP in India.
- Correlation between GDP and educational resources [4].
- Some master students in India prefer go to work.
What are the GPA and GRE scores of applicants?
GPA

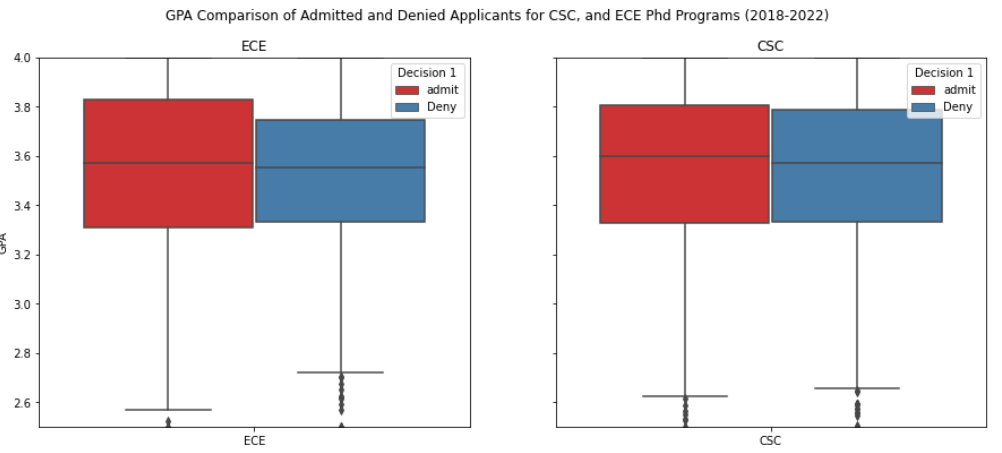
- For all three master programs, applicants with very high GPA will be more likely to be admitted.
- For PhD programs, GPA of admitted and denied applicants are similar.
GRE Verbal


- For all programs, applicants with very high GRE Verbal percentile will be more likely to be admitted.
GRE Quantitative


- For all programs, GRE Quant percentile of admitted and denied applicants are not much different.
What are the applicants’ interests?
Area of Interests
- Goals:
- Relationship between filling this column and admit/deny rate.
- The applicants’ interests and potential future directions.
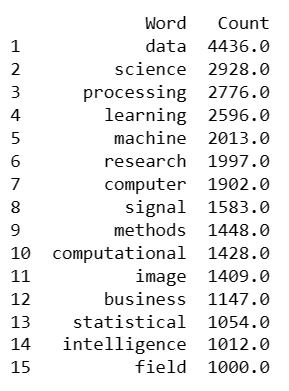
Top 15 most frequently used words for all applicants

Relationships

- Applicants with information about their area of interests are more likely to be admitted.
Analysis of correlations for different programs

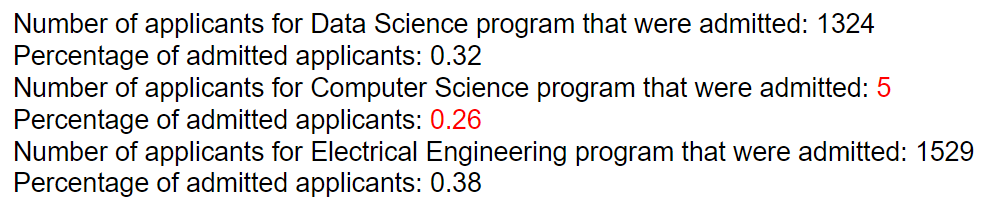
- Admission percentage: 26.07% (without area of interests)
- Admission percentage: 32.39% (with area of interests)

- Admission percentage: 34.14% (without area of interests)
- Admission percentage: 37.95% (with area of interests)
Analysis of Area of Interests for Data Science Master applicants


- Attractive Fields:
- Computational Methods
- Machine Learning
- Artificial Intelligence
- Business
- Statistical Research
- Biomedical Research
Analysis of Area of Interests for ECE Program applicants


- Attractive Fields:
- Signal and Image Processing
- Communication
- Electronic Engineering
- System
- Audio
- Robotics
7.2 Admission Office Reviewing – Admission Release
What is the admission rate for each program?
Admission For Ph.D. Programs

- The level of difficulty for CS-Ph.D. Program acceptance is higher than ECE-Ph.D.

- In 2020, there were only 8 people got accepted by ECE-Ph.D. program.
Admission For Master Programs

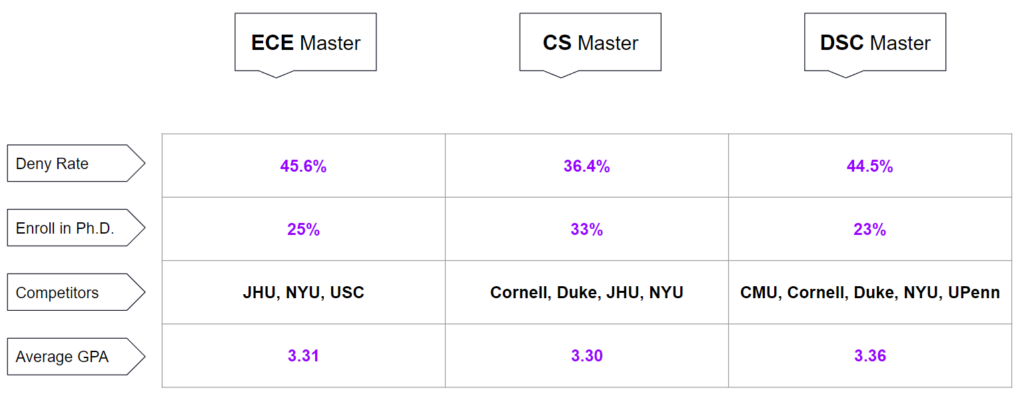
- The level of difficulty for each program to get accepted: CS>DSC>ECE

- The size of Data Science and computer science programs increasing from 2015 to 2020.
7.3 Applicants Decision – Final Enrollment
Where were they enrolled in if they denied the offer?
Ph.D

- The deny rate of ECE Ph.D. is 19.5%. (37/190)
- The deny rate of CS Ph.D. is 42.0%. (111/264)
- The ranking of NYU is higher than U of R.
- The master of optical sciences at U of A is one of only three optical science programs in US
- These records are from 2015 to 2022.
Master
General Conclusions Based on Applicants’ Decision
- The ranking of the schools or programs they choose are higher than U of R. (Enrolled in different master programs)
- They choose to study Ph.D. Program instead of Master. (Enrolled in different schools that the ranking is lower than U of R)
7.4 Prediction
Can we make any predictions of the DS Master based on the historical data?
Prediction — Admission rate
Data Used:
Applicants for Ph.D. programs
Models Used:
- Logistic Regression
- Random Forest
- SVM
- Multinomial Naive Bayes
- K-nearest Neighbours (KNN)
Methodologies:
SMOTE, ADASYN (oversampling methods)
Cross-validation
Evaluation:
Accuracy, recall score
Important Features Used:
Age Range
Institution 1 Level of Study
Institution 1 Degree, Institution 1 GPA (4.0 Scale)
Institution 2 GPA (4.0 Scale)
Fellowships Awarded
Recommender 1 Rating
Recommender 2 Rating
Recommender 3 Rating
Previously Applied?
Current Student?
Spouse Studying/Applying
Currently Employed?
Any Relatives Listed?,
Take GRE Verbal, Take GRE Quantitative
Take GRE Analytical Writing
Job1, Job2
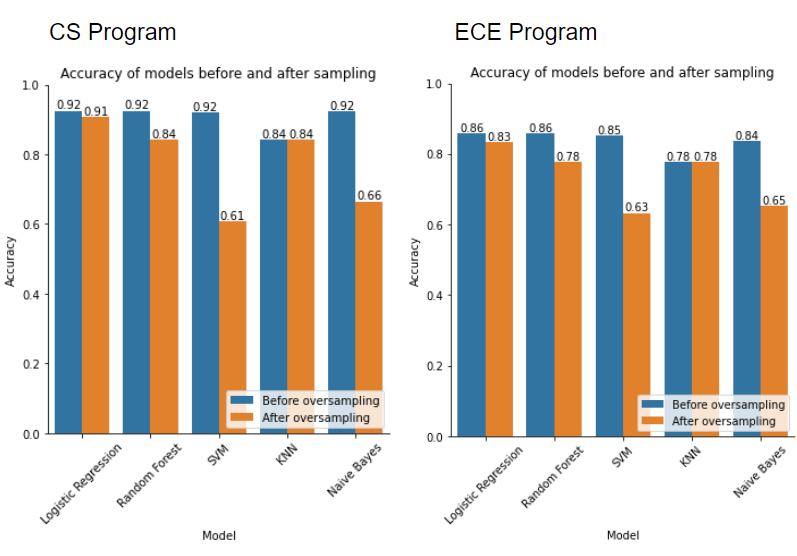
Model evaluation
Accuracy
Recall Score
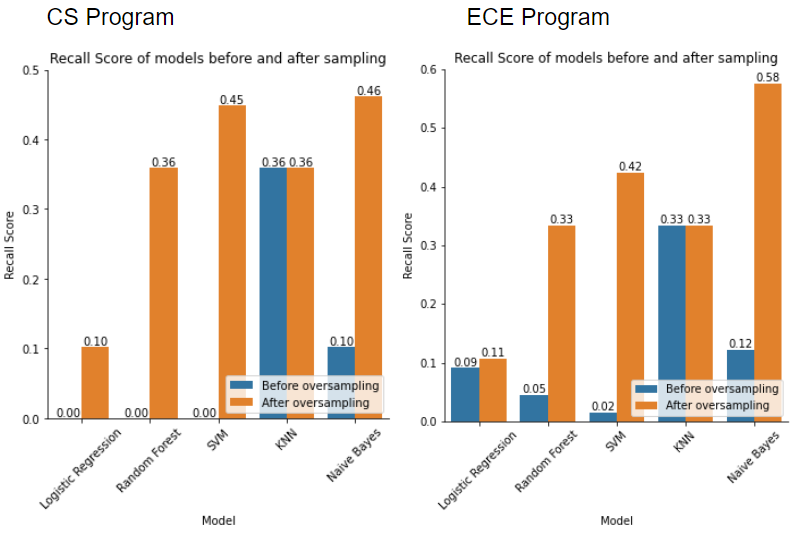
- Best Model: KNN
- Problem: Low recall score
Modeling – Feature Analysis
+ : positive correlation with admission rate
– : negative correlation with admission rate
CS Ph.D. Program

Institution 1 GPA, Institution 2 GPA ( + )
Recommender Ratings ( below average – )
Age between 30 and 35 ( – )
Sub-Categories (popular – , unpopular + )
- Popular: Artificial Intelligence, Multiple Areas, Human-Computer Interaction
- Unpopular: Circuit and Computer System, Systems, Theory
ECE Ph.D. Program

Current Student (+)
Previously Applied ( + )
Age between 30 and 35 ( – )
Sub-Categories (popular + , unpopular – )
- Popular: Signal and Image Processing, Circuit and Computer System, Nanoscale Electronics & Photonics
- Unpopular: Robotic, Communication, Other Category
Predictions — Accept/Deny DS Master


- Use application data from DS Master program to predict the DS Master program’s decisions, with accuracy about 0.9;
- Use the data 2015-2022 to predict 2023 Decisions, accuracy 0.87;
- The training and validation error graph and ROC curve indicate that models are good fit, precise and generalizable.
Feature importance and Recall Scores


- Top important features: GPA, TOFEL(Total, Speaking, Listening), GRE(Verbal, Analytical writing, Quantitative), Age
- Recall scores for Admit is much lower than Deny.
8. Reference
[1] China.org.cn. “Top 10 Chinese provincial regions by GDP in 2022” China.org.cn, 20 Feb. 2023, http://www.china.org.cn/business/2023-02/20/content_85116413.htm. Accessed 19 Mar. 2023.
[2] Statista. “U.S. Gross Domestic Product (GDP) by State 2021.” Statista, Statista Inc., 2022, https://www.statista.com/statistics/248023/us-gross-domestic-product-gdp-by-state/. Accessed 19 Mar. 2023.
[3] Statista. “India – Gross State Domestic Product at Factor Cost by State 2021.” Statista, Statista Inc., 2022, https://www.statista.com/statistics/961275/india-gross-state-domestic-product-at-factor-cost-by-state/. Accessed 19 Mar. 2023.
[4] ChinaPower. “How does Education in China Compare with Other Countries” ChinaPower, Center for Strategic and International Studies, 18 Feb. 2022, https://chinapower.csis.org/education-in-china/. Accessed 19 Mar. 2023.
[5] Elistia, Elistia, and Barlia Annis Syahzuni. “The correlation of the human development index (HDI) towards economic growth (GDP per capita) in 10 ASEAN member countries.” Jhss (journal of humanities and social studies) 2.2 (2018): 40-46.[6] Loyalka, Prashant, et al. “Skill levels and gains in university STEM education in China, India, Russia and the United States.” Nature human behaviour 5.7 (2021): 892-904.