Ammonia Biofilter Optimization for Chicken Manure Composting
Authors: Geoffrey Doyle, Jason Maher, and Aidan Shea
Advisor: Professor Kelley
Department: Chemical Engineering
Sponsor: Hal Kreher, Kreher Farms
Introduction
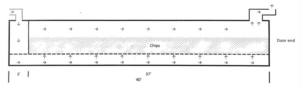
Kreher Farms is a family-owned and operated poultry and egg farm headquartered in Clarence, NY. It is home to about 60,000 chickens, which produce 5,400 cubic feet of manure each week, which are composted over the course of 6 weeks in two large warehouses and then sold as fertilizer. Recent years have seen a rise in odor-related complaints from neighbors, and recent European regulations on ammonia emissions are likely to be mirrored by the U.S. EPA in the coming years, which have incentivized Kreher Farms to reduce its ammonia emissions. They have developed a wood chip and recycled shipping container (Figure 1). Our sponsor has requested that we investigate the filtration performance of biochar, which is prepared by anaerobic pyrolysis of wood, and determine whether it would be a valuable addition to Kreher Farms’ current system.
Our literature review revealed that biochar prepared at high temperatures and utilized in high moisture environments has an optimal performance of 114 mgNH3/g biochar, while the adsorption of ammonia onto wood chips is not well studied. Separate studies showed that biologically active filters contain microbes that continuously convert ammonia into nitrates; so long as the nitrification reaction kinetics (consumption) are faster than air-to-bed mass transfer (adsorption), these systems can be operated indefinitely. This system is often employed in municipal wastewater treatment systems.
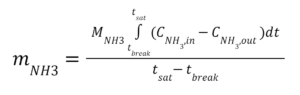
Our experiment attempted to replicate our sponsor’s current air filtration conditions and compare them to candidate future designs. The total mass of adsorbed ammonia was calculated by integrating the ammonia concentration between the introduction of ammonia into the system to its steady-state saturation time (Equation 1).
Methods
Adsorption Column Specifications:
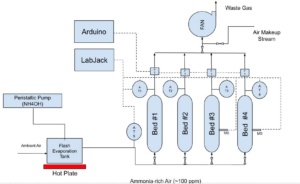
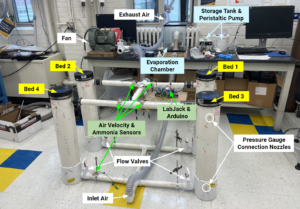
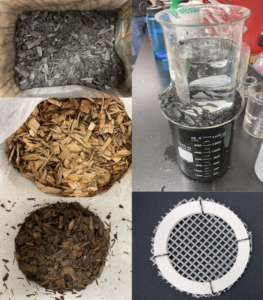
- Four packing materials were tested in parallel columns made from 6″ID PVC piping and plastic mesh disks. Bed #1: 18″ layer of dry wood chips, Bed #2: 4″ biochar layer on top of an 18″ wood chip layer, Bed #3: same as the second but rinsed daily to maintain moisture, Bed #4: 18″ manure-inoculated wood chips, also rinsed daily to maintain moisture. Beds 3 and 4 were kept moist by rinsing with 2L of water before the start of each trial. Beds 1 and 2 reflect the current and intended designs from our sponsor, and Beds 3 and 4 are additional parameters we wanted to test as a result of our literature review.
- Dry wood chips and dry biochar were delivered to us by our sponsor. Both were synthesized from pine wood.
- The wet woodchips were created by letting dry woodchips soak in a water bath for one week. The wet biochar underwent the same process, but needed to be weighed down by an additional beaker of water because it would otherwise float on top of the water and not reach water saturation. The manure-inoculated wood chips were synthesized with the same technique as the wet wood chips, but with about chicken manure mixed in as well in approximately a 4:1 ratio.
- In accordance with our literature review, we hypothesized that the Beds would perform from worst to best in the order listed above.
- The columns simulated a vertical slice of the full-scale design by utilizing the same volumetric flow rate of air per cross-sectional area, 33.7 ft3/min/ft2, which translated to a total 26.5 ft3/min of air with 100 ppm ammonia.
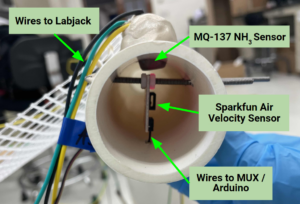
- Sparkfun Quiik air velocity sensors, Sparkfun moisture sensors, and Winsen MQ-137 ammonia sensors were used to maintain operating conditions and measure ammonia concentration.
Calibration Procedure:
- The hot plate and fan were turned on first to allow the system to come to steady state. The wind sensors were used to adjust the flow valves at the bottom of the columns to ensure that they were all receiving an approximately equal flow rate of about 3 m/s, corresponding to the flow rates mentioned above. This procedure took approximately 30 minutes.
- There were no beds present in any of the columns at this time.
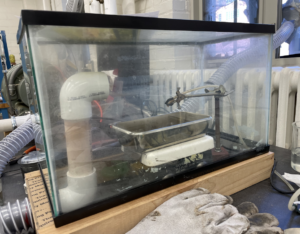
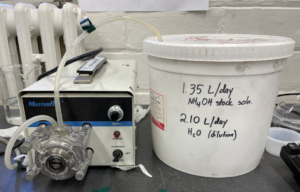
- Ammonia was introduced to the columns via the evaporation system. These amounts contained different amounts of a 13% NH4OH solution designed to deliver NH3 concentrations ranging from 0 ppm to 200 ppm in 20 ppm increments, each diluted to give the same volume of overall solution to match the setting on the peristaltic pipe.
- The columns were allowed to reach breakthrough and then once again achieve steady-state.
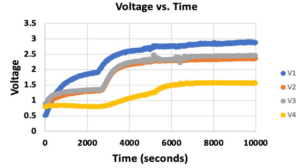
- Throughout the course of this procedure, the ammonia sensors put out voltage data that was recorded by LabVIEW.
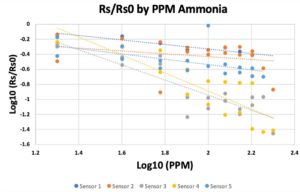
- The calibration plots are shown in Figure 5, generated using equation 2.
- It should be noted that Sensor 2 did not provide a usable equation translating voltages to ppm values, so the remainder of this analysis will primarily be carried out from the standpoint of voltage outputs.
Experimental Procedure
- The beds were loaded into the columns following the design specifications previously discussed.
- The calibration procedure previously mentioned was run, but with the following two differences:
- One. When the wind sensors were no longer working (see Results and Discussion), pressure difference across the beds to ensure that the columns all had about the same flow rate.
- Two. The inlet concentration of ammonia was kept at 100 ppm of ammonia rather than the varied intervals mentioned above.
Results and Discussion
Results of Initial Trials
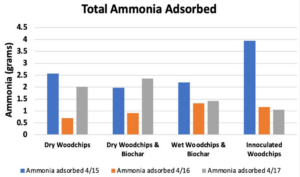
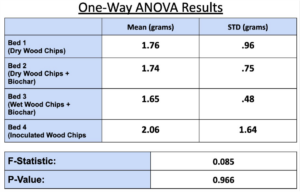
- Breakthrough occurred first in Bed 1, then 2 & 3 followed by 4 in Trial 1 (Figure 6), which supported our hypothesis that the manure-inoculated column had the highest capacity of ammonia at about 3.95 gNH3 (Figure 7).
- Bed 4 was observed to have become dry over the course of the experiment, so it is possible that microbe activity decreased with dryness.
- Figure 7 illustrates the varied performance of each packing material across all trials, where Bed 4 is the best performing in our first trial, less than but comparable to Bed 3 in the second trial, and the worst in the last trial. The second trial showed Bed 1 to be the worst-performing out of all the beds.
- All bed materials had about the same ammonia capacity, and Bed 4 only slightly outperformed the rest. Thus, the results of our experiment were somewhat inconclusive.
Conclusions
While the inoculated column performed better than the others overall and biochar improved performance, further research is needed to verify this finding. Because the beds all saturate within a few hours, our sponsor will likely need to incorporate more robust filtration tactics to extend the filter lifetime and achieve the desired filtration results. Alternative methods such as water scrubbing systems are commonly used to remove ammonia from the air due to ammonia’s high affinity for water. Adding a water bath and overhead sprinkler system to the air stream of the current shipping container system follows this approach. Municipal wastewater treatments utilize large microbe-holding water tanks, and attempting to replicate this is another feasible path forward . This takes a similar approach to that of the inoculated bed but would potentially give nitrogen-processing bacteria a longer window of time to process ammonia than gas flow through a solid-packed bed.
Acknowledgements
Team Censorship would like to acknowledge the following:
- Our advisor Professor Kelley, Professor Lawton, Professor Juba, and our sponsor Hal Kreher, for their insight and guidance over the course of this project;
- Clair Cunningham, Jeff Leffler, and Mason Garlatti, for their help in constructing our experimental apparatus;
- The Hajim School Department of Chemical Engineering, for providing the resources and funds to make this project possible.