Characteristics of Nanostructured AR Coatings
The Nanostructure AR coating project aims to Investigate and Model nanostructured AR coatings on OptiLayer in order to provide a simplified model that serves as process flow control for coating engineers. As such, Thin-Film models were derived to understand and analyze the first-order and physical components of the structures. This project is conducted with the help of our project customer ASML, and the support of our faculty advisors Dr. Wayne Knox, and Dr. Jim Oliver.
Overview of the Team

Project Overview and Purpose Statement
Vision: Using effective medium approximation and ellipsometric measurements, we can simulate nanostructures as a multilayer thin film coating and then we can build a model that will predict the index profile and will guide the coating engineer in the optimization process for desirable outputs. We will be delivering to our customer technical documentation for a model that includes Key-metrics for quality of fit, OptiLayer and OptiRE designs for various samples, and a process guide for coating engineers based on input.
Purpose: The purpose of thin-film modeling is to simplify and reverse engineer coating designs for model validations. The ASML engineer provided parameters such as response data (R%, ellipsometric and scattering data, etc) as well as substrate refractive index and overall coating thickness. The goal of the AR team was to predict the refractive index profile of the system based on the performance output. Using the effective medium approximation method, we created a model with thin-film layers representing the nanostructures which predicts the optical response of the structure. All parameters and constraints such as limits on refractive index and individual layer thicknesses were discussed and agreed upon with our customer during our recurring meetings.
Relevant Scientific Background Information
Specs of the AR Nanostructure created on the lens surface:
Lateral dimension is ~100 nm and etch depth is >400 nm to achieve R < 0.2%

Figure 1. Lateral View of Nanostructured AR coating on a Lens Surface. Picture provided by customer during OPT310 presentation

Figure 2. Comparison of reflection% performance of thin film vs. Nanostructure AR to emphasize its functionality. Figure provided by ASML during OPT310 customer interviews
Effective Medium Approximation:
When an analyzed specimen is composed of more than one material, called composite, there are ways to approximate the effective refractive index of this composite material based on the relationships and properties of each specific component. The Bruggeman’s Effective Medium Approximation Theory (EMA) allows the calculation of this estimate n_eff based on the Maxwell field equations and volume proportions for each element.

Above is the general Bruggeman’s Formula, where f_i is the fraction in of the i-th material, n_i is the refractive index of the i-th material and n is the refractive index for the effective medium.
In our case where we have two materials: air as incident medium and fused silica as substrate, we can rewrite the general formula into the equation below:
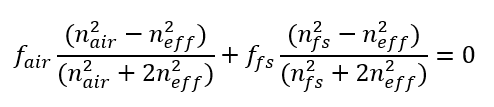
Where f_air is the fraction of air, f_fs is the fraction of fused silica, f_air+f_fs=1, n_air is the refractive index of air, n_fs is the refractive index of fused silica and n_eff is the refractive index of the effective medium.
Having the refractive index of air and fused silica over the spectrum and the composition fraction for each layer, we can get the effective medium refractive index for each layer.
Han, Katherine & Chang, Chih-Hung. (2014). Numerical Modeling of Sub-Wavelength Anti-Reflective Structures for Solar Module Applications. Nanomaterials. 4. 87-128. 10.3390/nano4010087.
Thin-Film Modeling:
Basic Coating Model Engineering requires an understanding of:
- Effective medium approximation theory
- Sample Testing: (Provided by ASML)
- Coating Software: Opti-Layer and OptiRE
- Optilayer is a thin-film software that allows the design and simulation of multifilms coatings on a substrate
- OptiRE is also a software included in the Optilayer suite, it helps for the characterization of optical coatings based on spectral photometric and ellipsometric data (reverse engineer coatings post-production)
The plot below introduces the relationship between the effective medium approximation and its corresponding structure.

Figure 3. Effective Medium Approximation for a nanostructure coating as a thin film stack or gradient index film.
Source:“Antireflection structured surfaces for the infrared spectral region”, Daniel H. Raguin and G. Michael Morris
Ellipsometry:
Ellipsometry is the study of change in polarizations of reflected light from a surface.
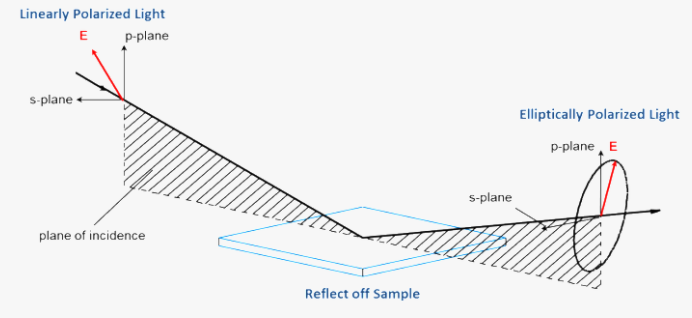
Figure 4. Graph showing the change in polarizations as light reflects off the sample surface. Ref: J.A.Woollam

The change in polarizations is presented through a phase difference and amplitude ratio with r_p and r_s are the fresnel reflections for the surface. When conducting Ellipsometric testing, we measure Psi and delta as a function of wavelength.
Results
First Sample
Measurements:
Our initial modeling is based on the following sample data which is based on a 500nm-overall coating with a fused silica substrate throughout the 300-2000 nm spectrum.

Figure 5. Plotted ellipsometric data provided by client for initial thin film modeling exploration on Matlab. The provided values are (Rp, Rs, Psi and Delta) for a range of incidence angles [8 – 70] degrees
Optilayer Design of the Optimized Solution:
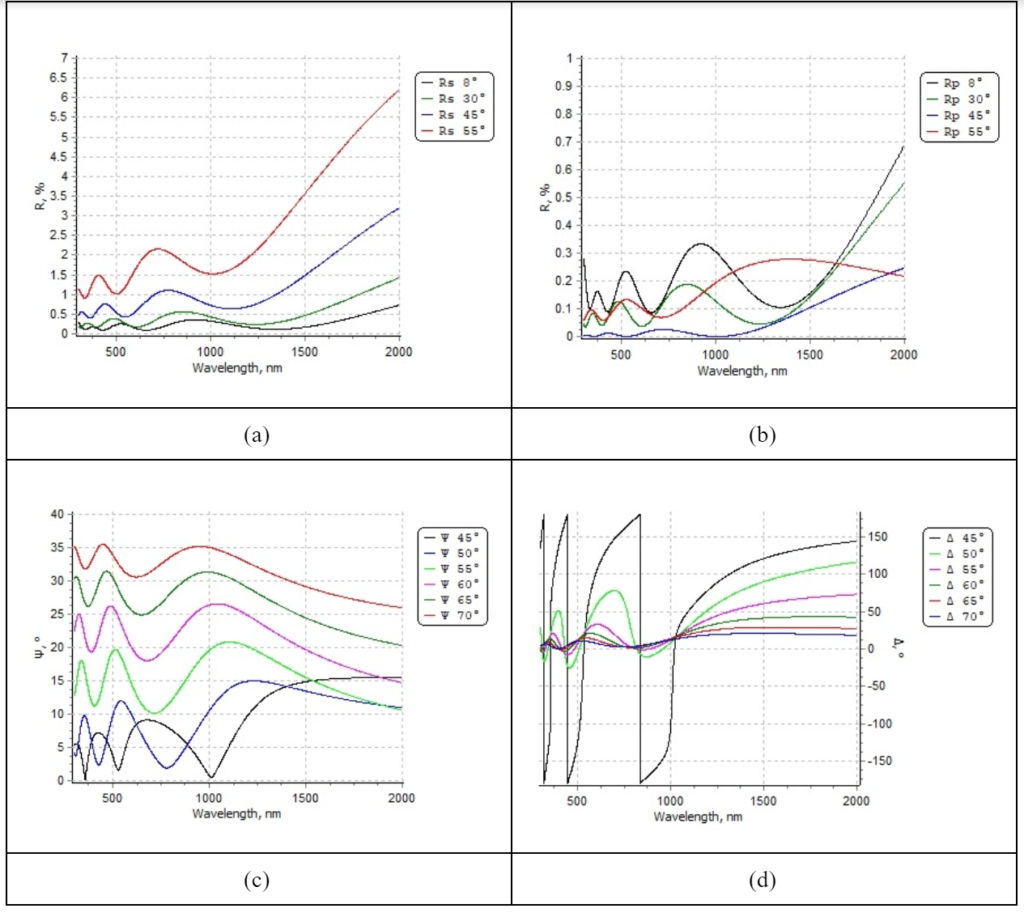
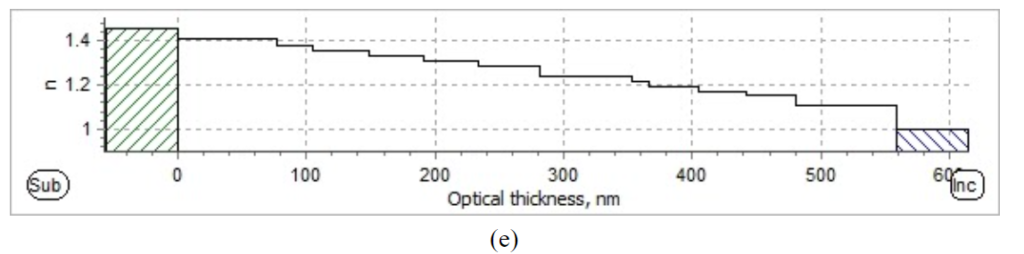
Figure 6. Reflectance and ellipsometry spectrum from simulation: (a) Reflectance for S-polarized light; (b) Reflectance for P-polarized light; (c) psi spectrum; (d) delta spectrum; (e) optical thickness “step”
OptiRE Data Fit to measurement data:
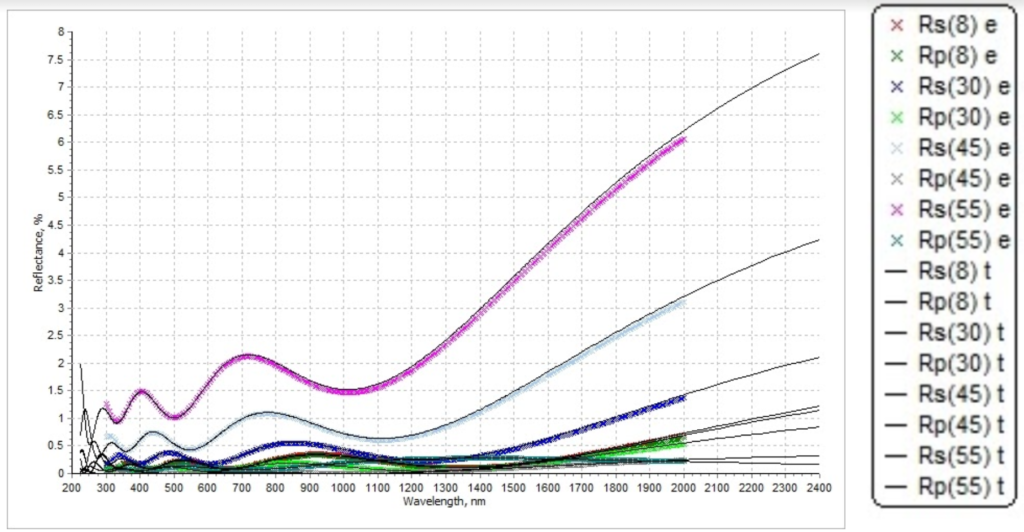
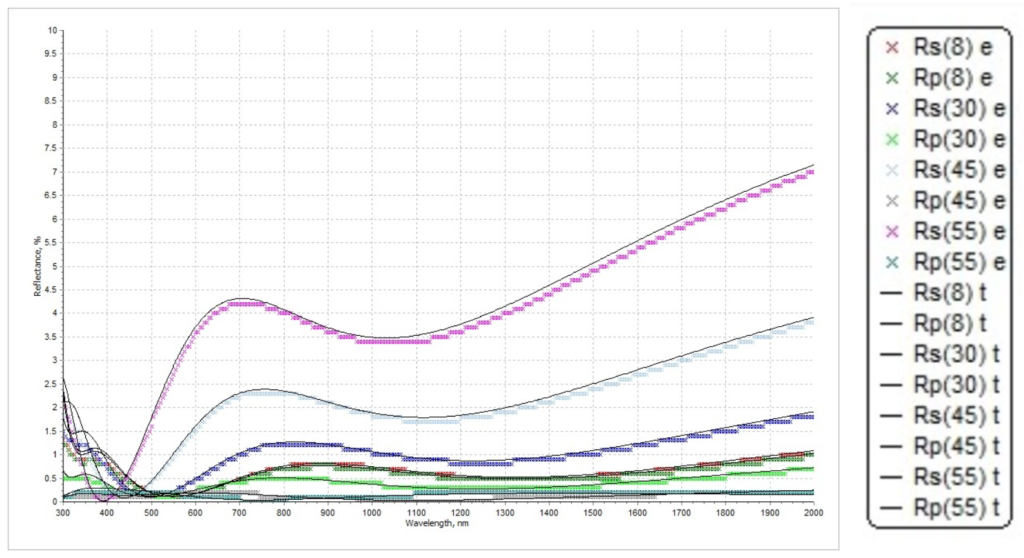
Figure 7.1. Simulated reflectance spectrum (solid lines) and measured reflectance spectrum (colorful lines)
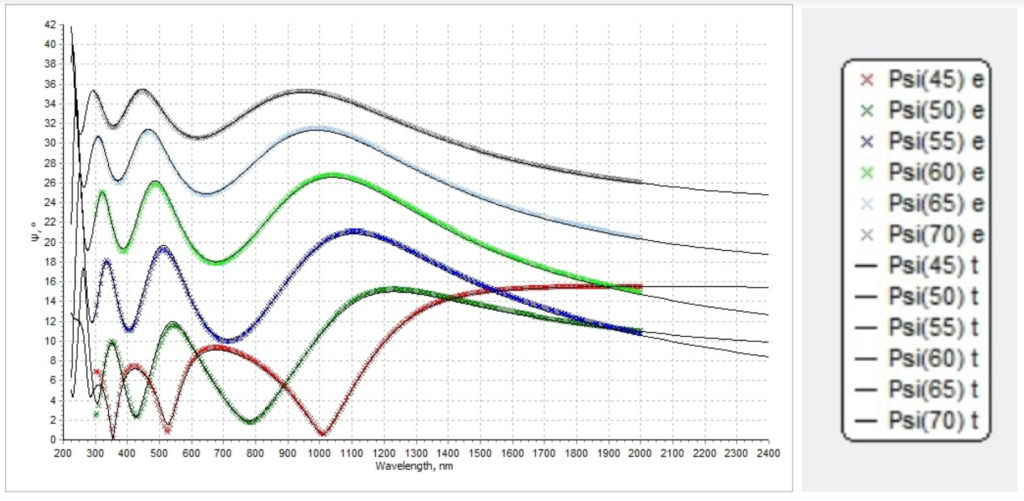
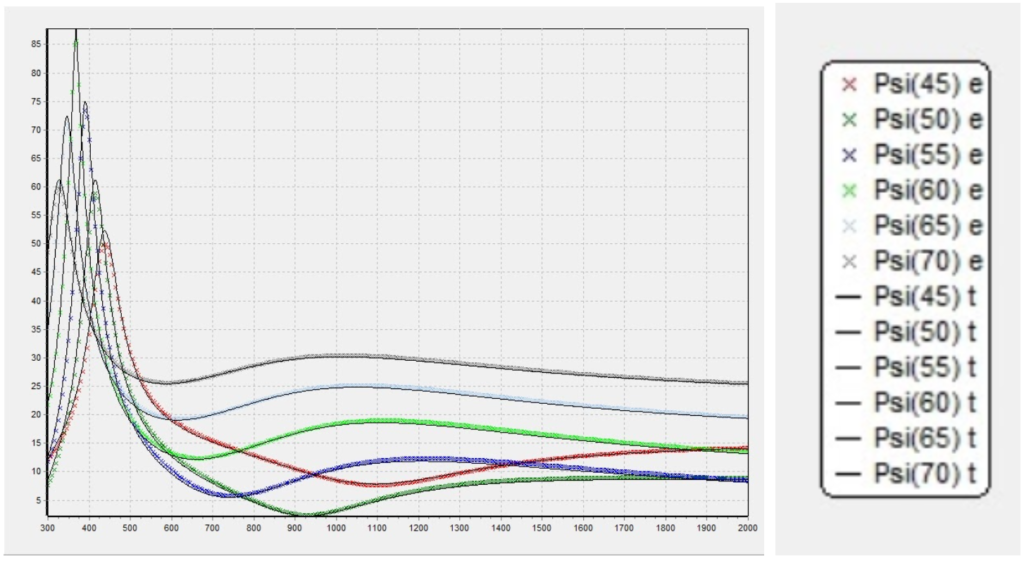
Figure 7.2. Simulated psi spectrum (solid lines) and measured psi spectrum (colorful lines)
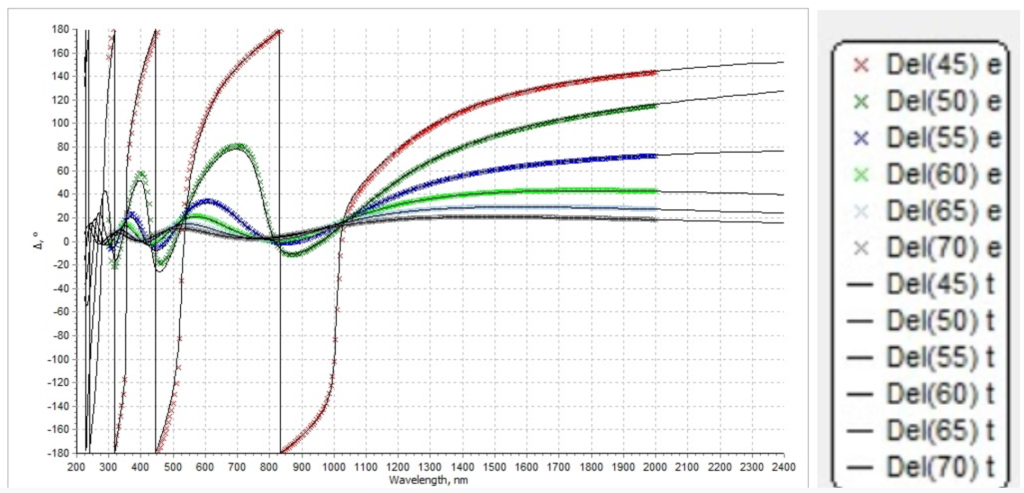
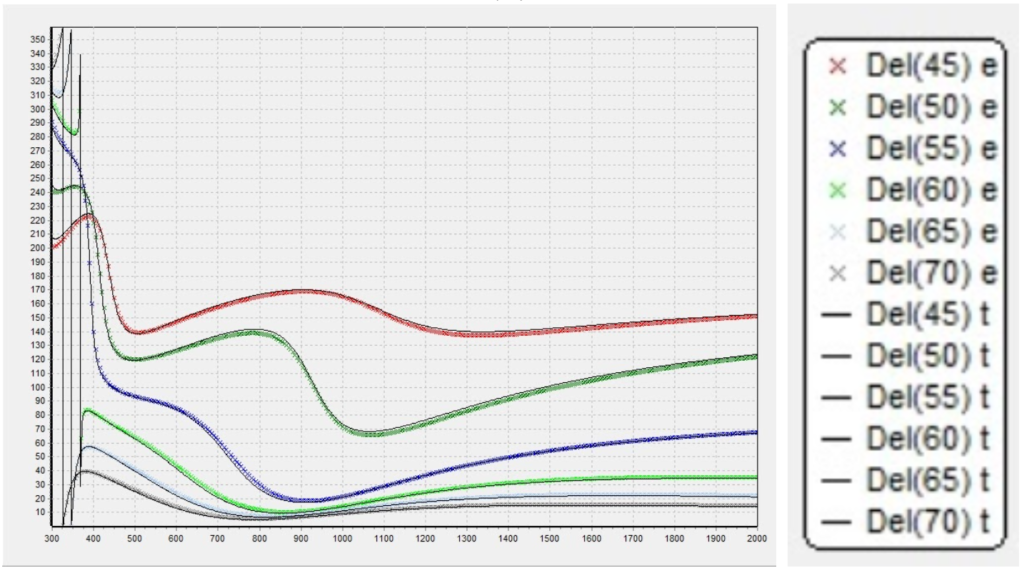
Figure 7.3. Simulated delta spectrum (solid lines) and measured delta spectrum (colorful lines)
Second Sample
Measurements:
Using Matlab, we plot the measurement data for sample 2 to visualize the reflection% for S- and P- polarizations as well as the ellipsometric data (Psi and Delta). The plots provide a good visual reference for our optimization process.
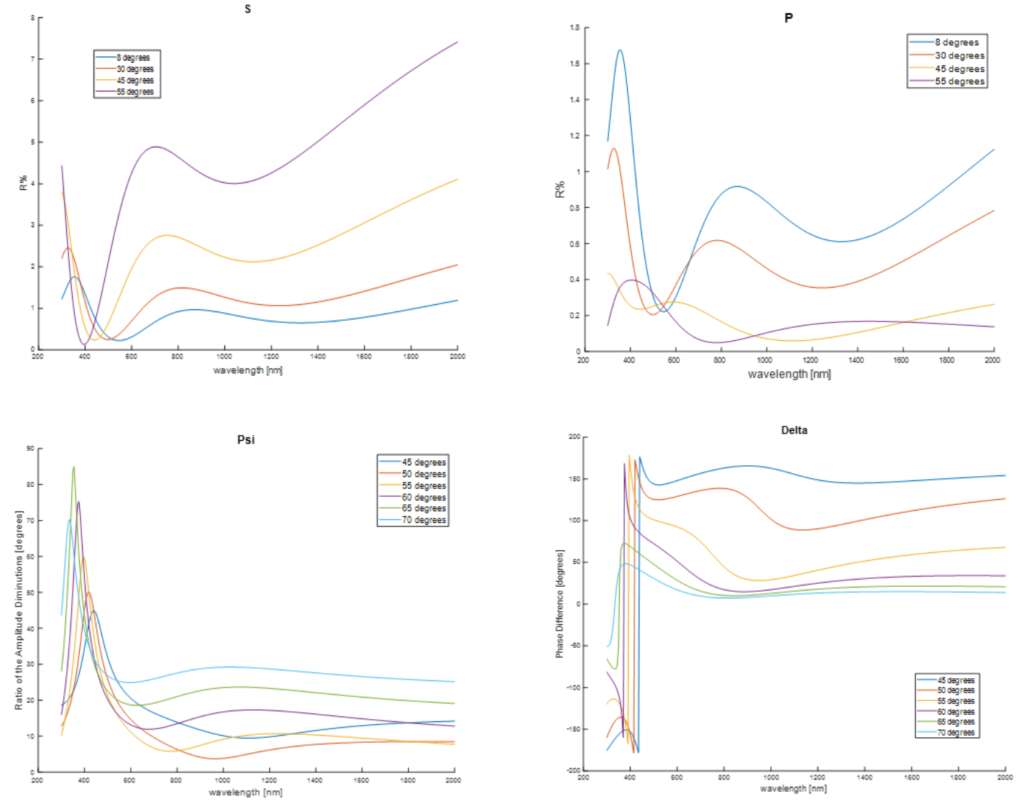
Figure 8. Plotted ellipsometric data provided by client for initial thin film modeling exploration on Matlab. The provided values are the ellipsometric data for a range of incidence angles [8 – 70] degrees
Optilayer Design of the Optimized solution:
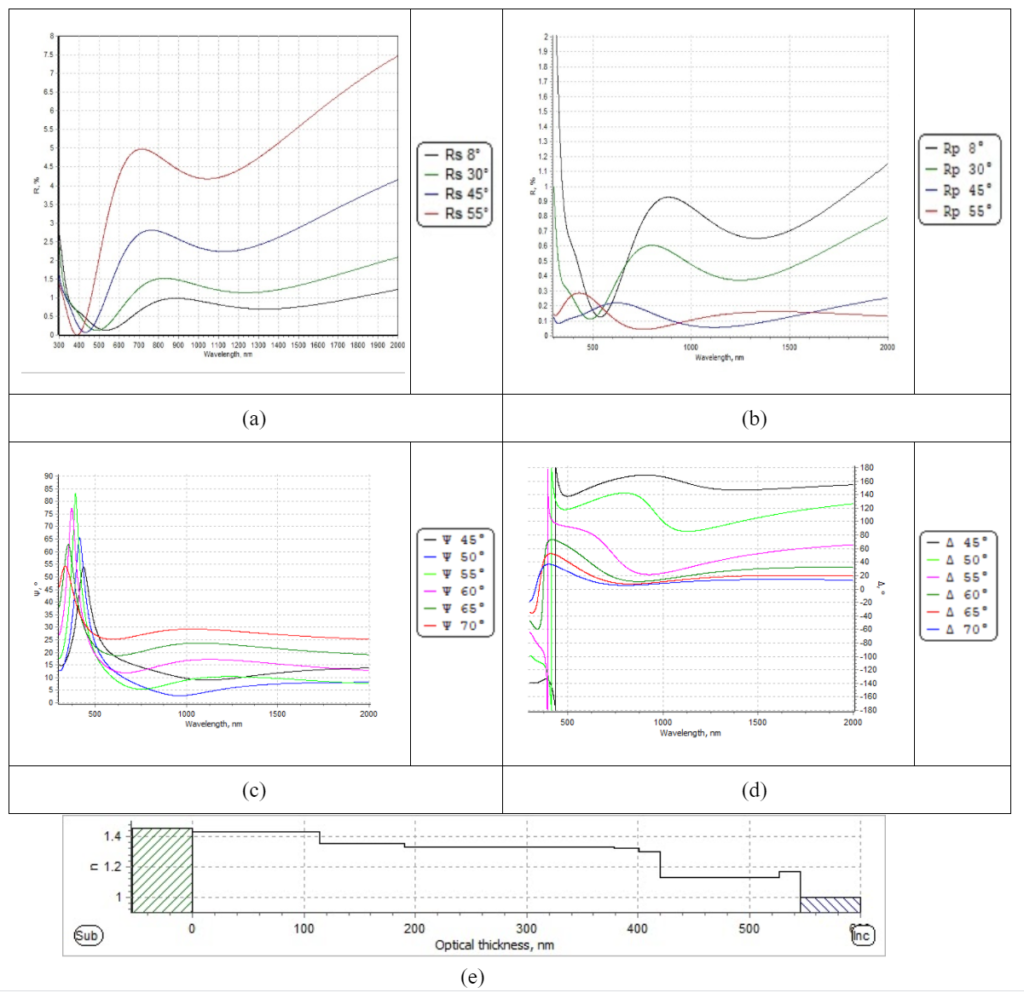
Figure 9. Reflectance and ellipsometry spectrum from simulation: (a) Reflectance for S-polarized light; (b) Reflectance for P-polarized light; (c) psi spectrum; (d) delta spectrum; (e) optical thickness “step”
OptiRE Data Fit to measurement data:
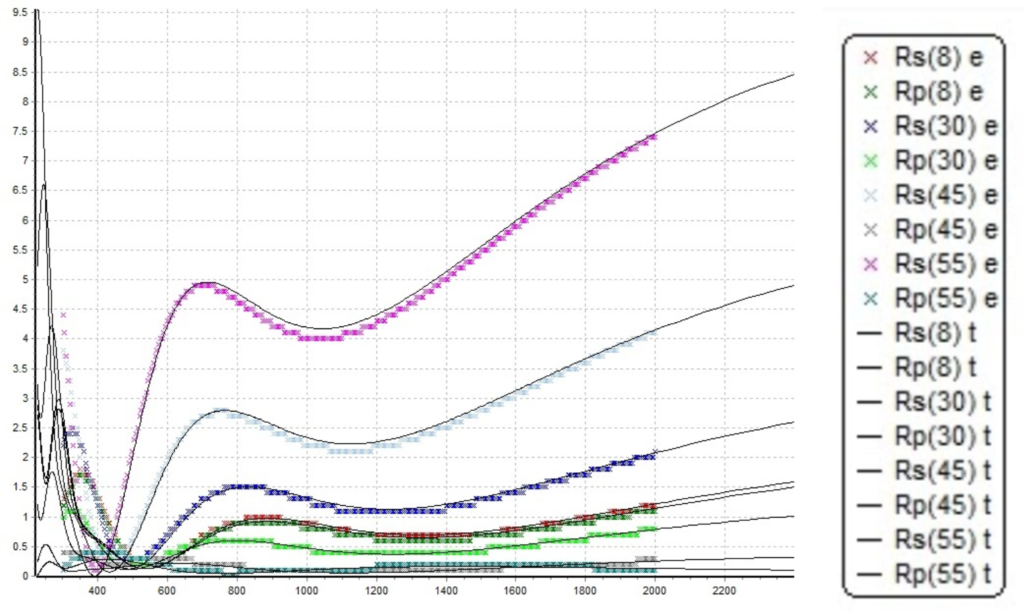
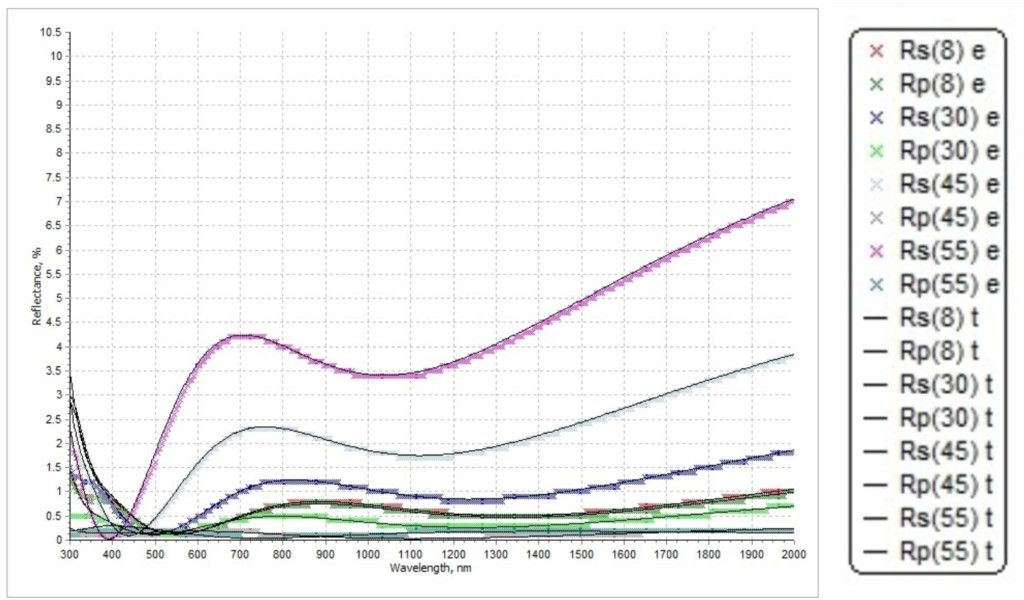
Figure 10.1. Simulated reflectance spectrum and measured reflectance spectrum. Note that x legend refers to the measurement data, and solid lines refer to the simulation results.
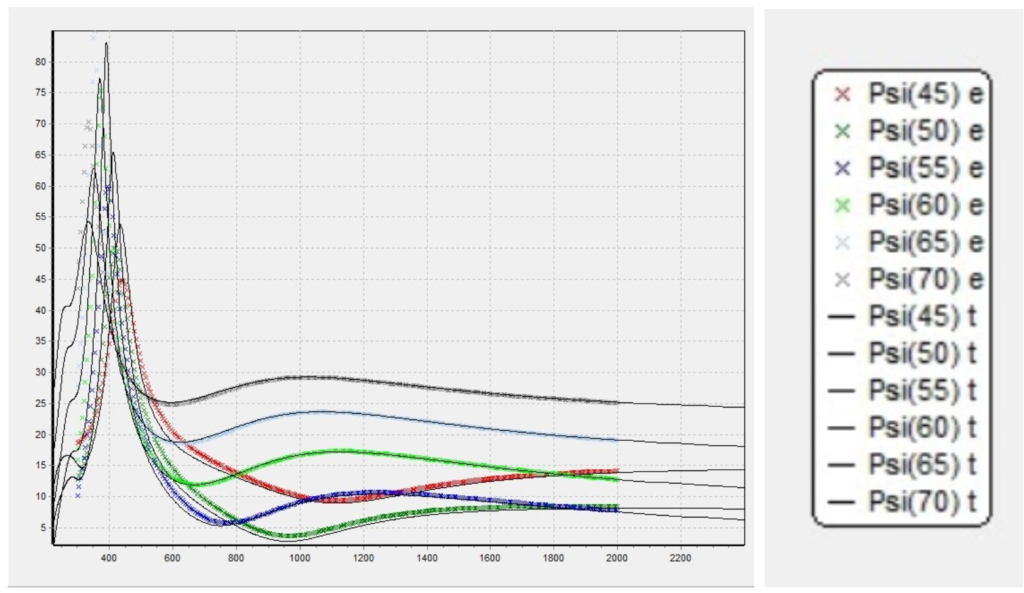
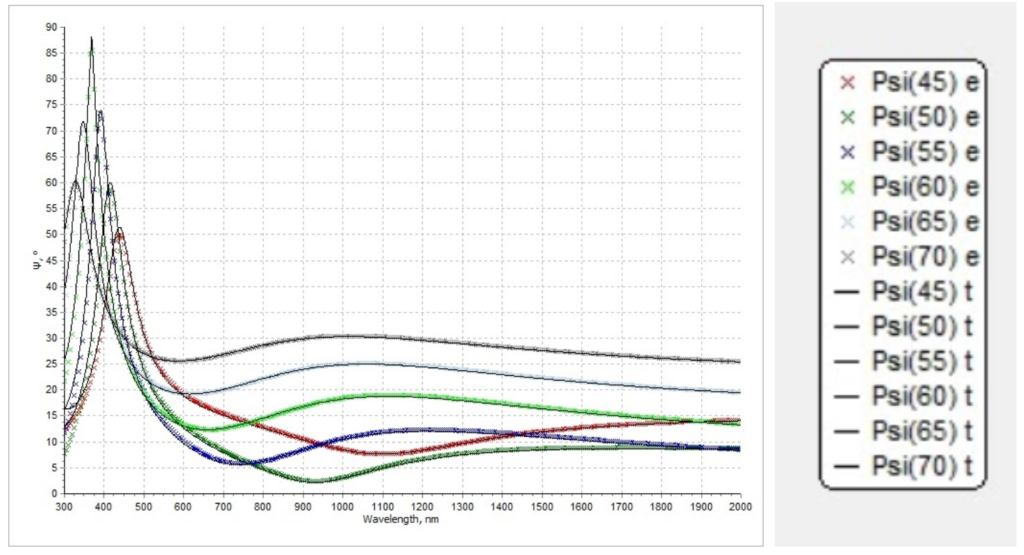
Figure 10.2. Simulated psi spectrum and measured psi spectrum. Note that x legend refers to the measurement data, and solid lines refer to the simulation results.
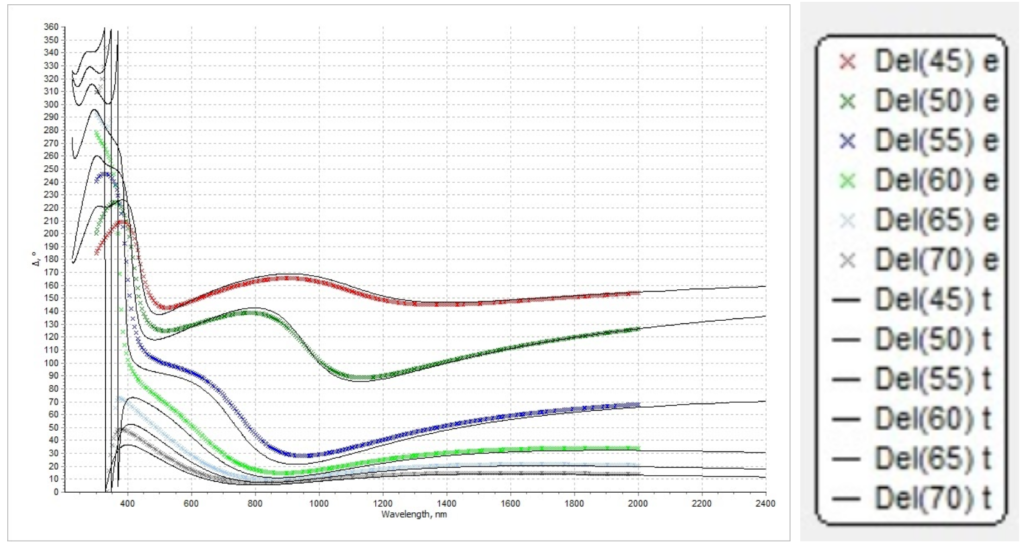
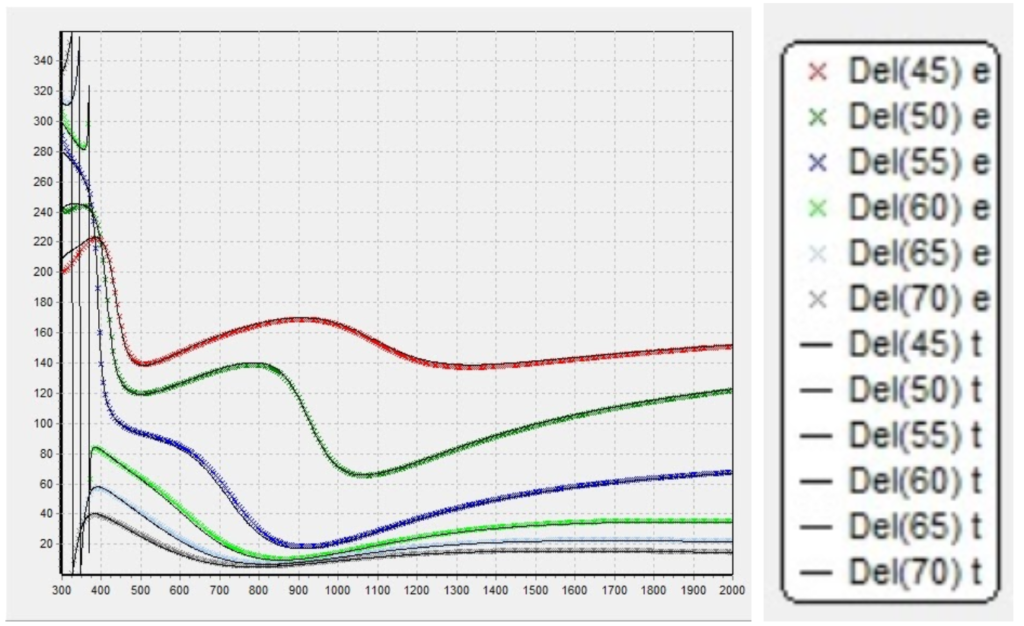
Figure 10.3. Simulated delta spectrum and measured delta spectrum. Note that x legend refers to the measurement data, and solid lines refer to the simulation results.
Third Sample
Measurements:

Figure 11. Plotted ellipsometric data provided by client for initial thin film modeling exploration on Matlab. The provided values are the ellipsometric data for a range of incidence angles [8 – 70] degrees
Optimization Methods
We have followed two approaches; First an optimization following the process flow we created, second, an optimization with a sample 2 design foundation.
Method 1: Follow Process Flow
(a)
(b)
(c)

(d)
Figure 12. Design Details for our latest design with 424nm total thickness. (a) Reflectance fit from OptiRE; (b) Psi fit from OptiRE; (c) Delta fit from OptiRE; (d) Refractive index Profile of the final design for Method 1. Note that in (a),(b), and (c)’s legends, x legend refers to the measurement data, and solid lines refer to the simulation results.
Method 2: From Sample 2
For this approach, we started from Sample 2 profile due to the similarities in performance.
(a)
(b)
(c)

(d)
Figure 13. Design Details for our latest design with 482nm total thickness (include a layer of substrate). (a) Reflectance fit from OptiRE; (b) Psi fit from OptiRE; (c) Delta fit from OptiRE; (d) Refractive index Profile of the final design for Method. Note that in (a),(b), and (c)’s legends, x legend refers to the measurement data, and solid lines refer to the simulation results.
Discussion
Comparison between simulations and actual designs
Comparison between simulations and actual designs
Here is a comparison between the actual intended designs and our simulated expectations:
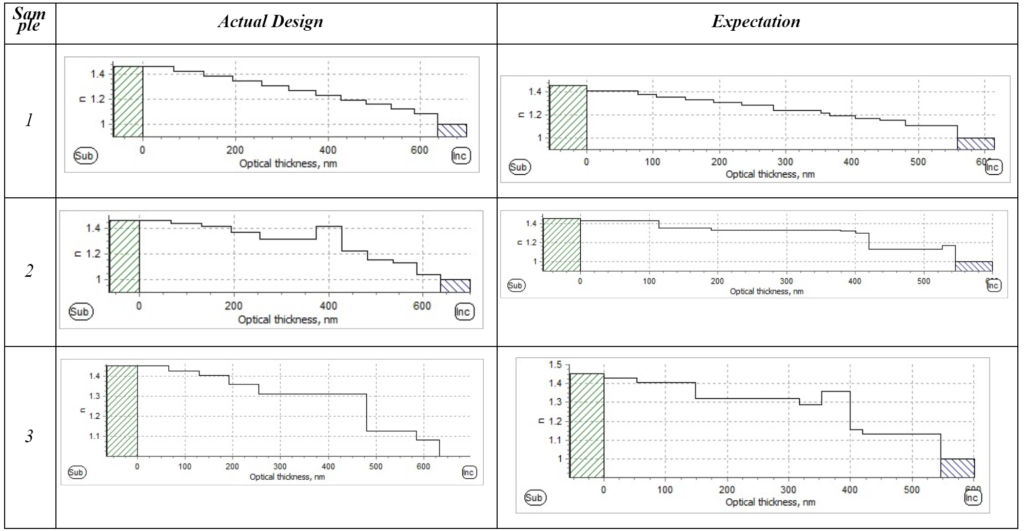
Figure 14. Comparative graph between simulated and actual designs for sample 1 and 2 to show our model fit to the intended refractive index profile
We show that we can predict the profile with a different step and layers number combination. In fact the thicknesses and number of intermediate layers do not affect the performance. For sample 2, we have matched the performance adequately. For sample 3, we show how different profiles are able to achieve similar performance. The refractive index steps could be chosen in a multitude of ways, but we observed that the average refractive index is the same over a similar spectral range between the two profiles.
Comparison between the two approaches for Sample 3
Comparison between the two approaches for Sample 3
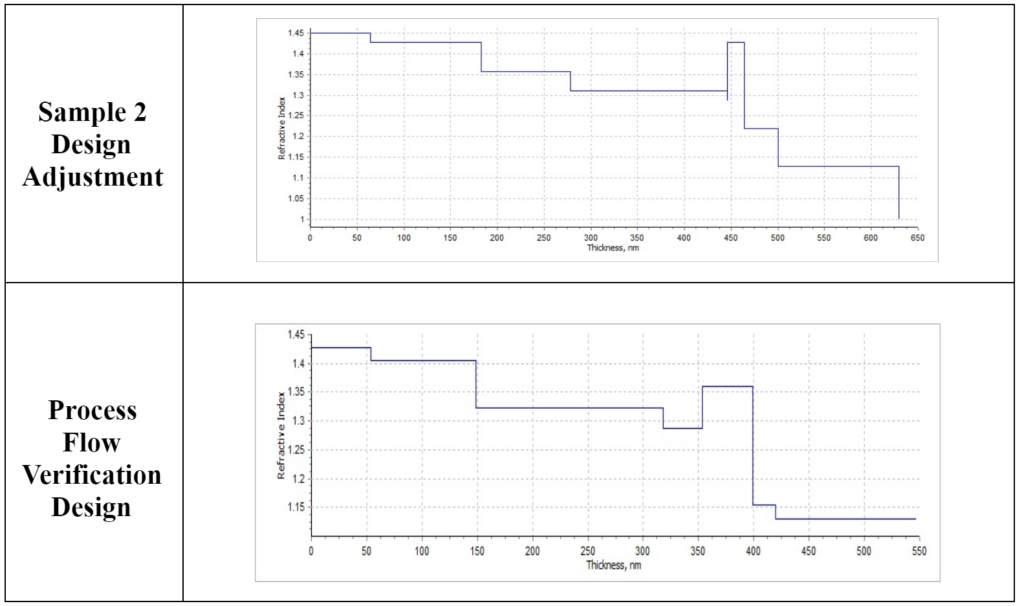
Figure 15. Comparative graph between two designs for sample 3.
From the comparison, we notice that what matters is the refractive index gap’s position count from the air. We can see that the two designs have different refractive indices at the bump, around 1.43 and around 1.36. Even with different physical thicknesses, they can share similar optical path lengths, which will lead to similar results. This provides an optimization freedom range, to achieve the same performance with alternative, yet similar, design profiles.
Quality of Fit metrics
Quality of Fit metrics
Understanding the uncertainty in the thickness/refractive index of each layer is important in building confidence in the thin film modeling of nanostructures. In order to do that, some metrics for quality of fit need to be developed. For example, testing for stack sensitivity, constraining the fit error and wavelength weight help in determining fit accuracy.
Extreme optimization cases include:
- Keep all layers same physical thickness and change refractive index n of layers as needed
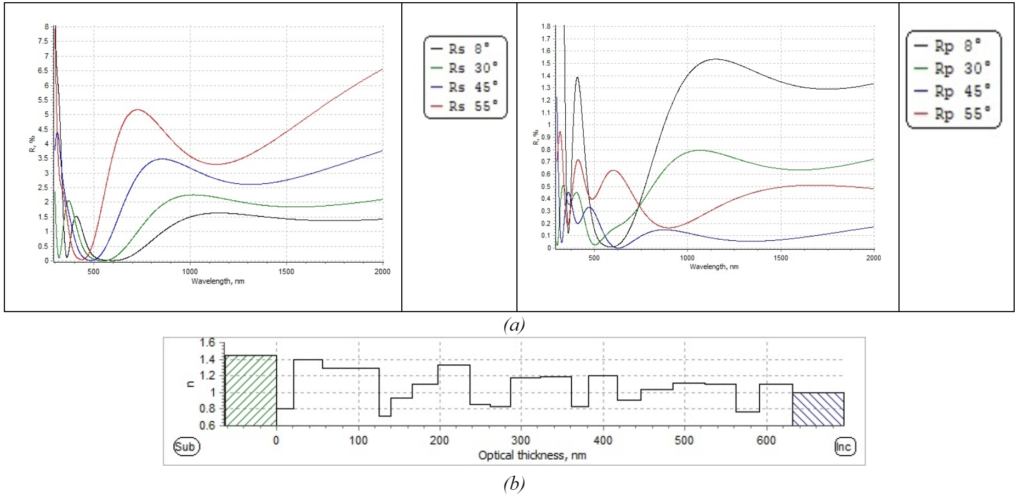
Figure 16. 19 Layer design post optimization for refractive indices error only. (a) presents the R% for S-polarization at AOI within [8-55] degrees. (b) is the optimized refractive index profile for the coating.
2. Change thickness as needed but keep the refractive indices of the layers fixed.

(a)

(b)
Figure 17. 19 Layer design post optimization for thickness error only. (a) presents the R% for S-polarization at AOI within [8-55] degrees. (b) is the optimized refractive index profile for the coating
Performance per Polarization
To note the difference for reflectivity performance per polarization, refer back to the graphs presented in each of sample 1, sample 2, sample3. We observe that the performance is considerably better for P-polarization than S-polarization. If we compare the plot peaks, we observe that P-polarization peak is within [< 1% – 2%] while S-polarization peaks are within [6.5% – 8%.].
Another point of interest is the variation of performance over the range of angles of incidence. The Reflection increases continuously as the angle of incidence gets larger for S-polarization. As we get closer to the Brewster angle, P-polarization actually has a lower Reflection % and better performance, as noted in the graphs, by comparing the performance for 45 degree incidence vs. the rest of the angles range.
During the completion of this project, we did not receive any information about the actual application of this nanostructure AR technique in ASML’s products. As such, we can only recommend the use of p-polarization for better performance, if possible.
Conclusion
- Performance: The maximal reflection amplitude depends mainly on the refractive indices at the edges of our coating. The more gradual the change of refractive indices from the substrate to coating and coating to medium (air), the better the performance achieved.
- Bandwidth: The overall depth of the coating (nanostructure) impacts the bandwidth of our AR coating.
- Ripples: Unexpected noticeable ripples in the measurements (Psi measurement shows clearly the ripples) would have a high possibility to represent either a “hole” or a “bump” in the intermediate layers in the index profile.
- Layer Thicknesses: The thicknesses of the middle layers do not affect the overall performance but the shape and location of the ripples on the spectrum. We aim to keep all thicknesses reasonable and averaged to be the same across our stack.
- The thickness and refractive index of each layer contribute to the optical path length of the light. Different profiles might result in similar performances.
- The reflection graphs and the refractive index profile represent the performance of the average structure across the profile.
- Having fewer but wider structures across a sample allows for reaching a better performance. Likewise, the size and number of the structures depend on the mechanical limitations of the coating process.
Note: Absorption and scattering are assumed to be irrelevant in these models due to the fictitious and “perfect” aspect of the proposed “mystery” designs by the customer. (Not real data)
Acknowledgements
We are extremely thankful for the help and support of our faculty advisors Dr. Jim Oliver and Dr. Wayne Knox. We are also grateful for the opportunity to work alongside ASML Dr. Parag Kelkar in the analysis and development of the coating designs and models. This has been a great learning experience and technical application of our engineering courses in a real-world problem.