Introduction:
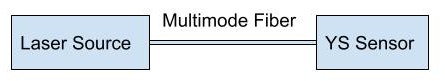
- The purpose of this project is to design a low numerical aperture (NA) multimode (MM) fiber to support ASML’s YieldStar (YS) optics sensor for scanning wafers using white light with the wavelength range of 400 to 1000 nm.
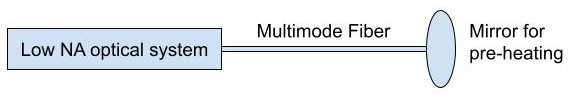
- We are also designing another low NA MM fiber to operate at a wavelength of 1070 nm meant to preheat a mirror for a separate lithography machine.
- For both designs, we will be using a trench-assisted fiber
Simulation Method: Beam Propagation Method (BPM)
- Input Field: Gaussian Field or Fundamental mode
- Segment 1: Straight Propagation for 1cm
- Segment 2: Bending Propagation for 10 turns, under bending radius of 25mm;
- Segment 3: Straight Propagation for 1cm
DETERMINING EFFECTIVE NA
- Full field:
- For each snapshot:
- Envelope’s residual propagation constant:
- Full propagation constant:
- Calculate effective n_core:
- Effective NA:
- (Agrawal, 2012)


1070 NM PREHEAT SYSTEM: SPECIFICATION
| Wavelength range (nm) | Fiber type | NA | Core size (um) | Cladding size (um) | Bend radius [mm] | Bend loss for 10 turns [dB] | Propagation loss |
|---|---|---|---|---|---|---|---|
| 1070 | MM mode | 0.105 | 50/91 | 242+/-7 | <25 | <0.2 | <100dB/km |
Table 1: Specification Table for the First Design for preheating the mirror
1070 nm preheat system: Material Choosing
For our design, we used silica and fluorine‐doped silica as the material.
We then account for fluorine doping by applying a relative index decrease Δn=−0.31%×C (where C is wt % F) (Malitson, 1965)


Figure 1: Comparing estimated refractive index and expected index (Tsukuma, 1991).
1070 NM PREHEAT SYSTEM: TOLERANCE FOR DOPING
Through the tables and figures below, we can observe that the NA and Bending loss are relatively insensitive to Cladding doping compared with the trench doping.
| Trench doping | NA | Bend Loss (dB) |
|---|---|---|
| 2.2% Wt | 0.077 | 0.2523 |
| 2.5% Wt | 0.074 | 0.1380 |
| 2.7% Wt | 0.095 | 0.0886 |
Table 2: The doping tolerance test for Trench material

Figure 2: The effect of doping in trench material on NA and Bend loss.
| Cladding doping | NA | Bend Loss (dB) |
|---|---|---|
| 0.4% Wt | 0.076 | 0.1371 |
| 0.6% Wt | 0.074 | 0.1376 |
| 0.8% Wt | 0.074 | 0.1380 |
| 1.0% Wt | 0.072 | 0.1382 |
| 1.2% Wt | 0.071 | 0.1385 |
Table 3: The doping tolerance test for Cladding material

Figure 3: The effect of doping in cladding material on NA and Bend loss.
1070 nm preheat system: Fiber Design
| Material | Thickness (μm) | Refractive Index | Tolerance | |
| Core | Pure Silica Oxide | 25 (radius) | 1.4496 | N.A. |
| Trench | 2.5% fluorine-doped SiO2 | 8 | 1.4383 | ± 0.2% |
| Cladding | 0.8% doped SiO2 | N.A. | 1.4460 | ± 0.5% |
Table 4: Determined specifications for the 1070 nm fiber

Figure 4: The cross-section of the designed trench fiber
1070 nm preheat system: Simulation Result
| Specification | Wavelength range (nm) | Fiber type | NA | Core size (um) | Cladding size (um) | Bend loss for 10 turns [dB] |
|---|---|---|---|---|---|---|
| Requiement | 1070 | MM mode | 0.105 | 50/91 | 242+/-7 | <0.2 |
| Simulation | 1070 | 55 modes | 0.074 | 50 | NA | 0.01384 |
Table 5: Fiber design results

Figure 5: The propagation loss for the Gaussian mode input

Figure 6: Output far field intensity and phase in paraxial approximtion

Figure 7: Mode overlapping through the propagation
broadband ys system: specification
| Wavelength range (nm) | Fiber type | NA | Core size (um) | Cladding size (um) | Bend radius [mm] | Bend loss for 10 turns [dB] | Propagation loss |
|---|---|---|---|---|---|---|---|
| 400-1000 | MM mode | 0.05 | 50~105 | 125~210 | <35 | <0.2 | <100dB/km |
Table 6: Specification Table for the First Design for YS sensor
broadband ys system: material choosing
We selected silicon dioxide (SiO₂) as the core material. The main reason is that its refractive index is stable, making it easier to use as the core. This also provides flexibility in selecting and doping other materials for the cladding in later design stages. The equation for NA as well as the one the below were used for calculating the appropriate refractive indices needed.

Broadband ys system: tolerance for doping
| Trench doping | NA for = 400nm | Bend Loss (dB) for = 400nm |
|---|---|---|
| 3.2% Wt | 0.041326 | 1.747303e-06 |
| 3.3% Wt | 0.039731 | 9.54328e-07 |
| 3.4% Wt | 0.046580 | 6.818365e-07 |
Table 7: The doping tolerance test for Trench material at 400 nm
| Trench doping | NA for = 700nm | Bend Loss (dB) for = 700nm |
|---|---|---|
| 3.2% Wt | 0.055065 | 0.0025423 |
| 3.3% Wt | 0.04070 | 0.0021732 |
| 3.4% Wt | 0.10740 | 0.0013191 |
Table 8: The doping tolerance test for Trench material at 700 nm
| Trench doping | NA for = 1000nm | Bend Loss (dB) for = 1000nm |
|---|---|---|
| 3.2% Wt | 0.059721 | 0.2523 |
| 3.3% Wt | 0.041827 | 0.20601 |
| 3.4% Wt | 0.139721 | 0.1701266 |
Table 9: The doping tolerance test for Trench material at 1000 nm

Table 10: The effect of doping in trench material on NA and Bend loss at 1000 nm
| Cladding doping | Number of modes for = 1000nm | NA for = 1000nm | Bend Loss (dB) for = 1000nm |
|---|---|---|---|
| 0.19% Wt (n=5.89e-4) | 8 | 0.04832 | 0.18943 |
| 0.18% Wt (n=5.58e-4) | 8 | 0.04831 | 0.18545 |
| 0.17% Wt (n=5.27e-4) | 8 | 0.04829 | 0.1874 |
Table 11: The doping tolerance test for Cladding material at 1000 nm
Broadband ys system: Fiber Design
| Material | Thickness (μm) | Refractive Index | |
| Core | Pure Silica Oxide | 25 (radius) | 1.4701 at 400 nm 1.4504 at 1000 nm |
| Trench | 3.3% fluorine-doped SiO2 | 11 | delta n=0.01023 |
| Cladding | 0.15% fluorine 0.38% chlorine- doped SiO2 | N.A. | 1.4696 at 400 nm 1.4502 at 1000 nm |
Table 12: Determined specifications for the 400-1000 nm fiber

Figure 9: The cross-section of the designed trench fiber
Broadband ys system: simulation result
| Wavelength (nm) | Mode number | NA | Bending Loss for 10 Turns (dB) |
| 400 | 51 modes | 0.042 | 0.206 |
| 700 | 6 modes | 0.041 | 0.002 |
| 1000 | 3 modes | 0.040 | 9.5e-7 |
Table 13: Fiber design results

Figure 10: The cross-section of the designed trench fiber (top left), the propagation loss for the Gaussian mode input (top right), the output far field intensity (bottom left), and the phase in paraxial approximtion (bottom right) for 1000 nm.

Figure 11: Mode overlapping through the propagation for 1000 nm.