Author
- Jiayi Hao (PM)
- Yulin Feng
- Hao Jing
- Runzhou Liu
Mentor
Professor Ajay Anand
Sponsor
Zalliant
Abstract
Zalliant wants to quickly detect abnormal events happening on cattle to increase dairy cow milk production efficiency. Thus, the goal of this project is to automatically detect multiple abnormal events happening on cattle including water intake abnormality, calving, and water intake prediction. To deliver against this goal, the team employed time series analysis and linear regression on cattle temperature and water intake data. As a result, the team receive a high accuracy on water intake abnormality detection and calving detection and employed linear regression on water intake prediction and received a useful prediction model. Finally, the team delivered two Python Jupyter notebooks files for Zalliant to allow automatic data analysis of cattle events. Zalliant wants to quickly detect abnormal events happening on cattle to increase dairy cow milk production efficiency. Thus, the goal of this project is to automatically detect multiple abnormal events happening on cattle including water intake abnormality, calving, and water intake prediction. To deliver against this goal, the team employed time series analysis and linear regression on cattle temperature and water intake data. As a result, the team receive a high accuracy on water intake abnormality detection and calving detection and employed linear regression on water intake prediction and received a useful prediction model. Finally, the team delivered two Python Jupyter notebooks files for Zalliant to allow automatic data analysis of cattle events.
1 Introduction
The health and welfare of dairy cattle are paramount concerns in the agriculture industry, not only due to the ethical implications but also because of their direct influence on productivity and economic viability. Monitoring the health status of dairy cows is essential for early detection of anomalies that could indicate serious health issues such as diseases or calving events. Traditionally, the detection of such health problems relies heavily on visual observations by farmers or veterinarians, a method that can be both time-consuming and subjective. As such, there has been an increasing interest in developing more objective, continuous, and automated monitoring systems to ensure the timely and accurate detection of health-related issues in dairy cows.
Body temperature and water intake are two critical physiological parameters that can provide significant insights into the health status of dairy cows. Deviations in body temperature are known indicators of various health problems, including infections, inflammations, and systemic diseases. Similarly, changes in drinking behavior can signal health issues, as water consumption patterns are closely linked with feed intake, metabolism, and overall animal health. For instance, a decrease in water intake often precedes the clinical onset of diseases like mastitis or ketosis.
This research project aims to leverage these physiological indicators by developing a predictive model that uses changes in body temperature and water consumption to identify health anomalies in dairy cows. The analysis is based on time series data collected from sensors that continuously monitor these parameters. By employing linear regression techniques, the project seeks to extract relevant variables from the time series data and analyze them to predict potential health issues. The hypothesis driving this research is that significant deviations from baseline temperature and drinking patterns can be used as early warning signs of health issues, allowing for real-time alerts, and enabling farmers to take prompt and precise actions.
2 Background
In the realm of dairy farming, various diseases can adversely affect cows, including ovulation irregularities, calving difficulties, milk fever, ketosis, and mastitis, each of which has unique symptoms and effects. The early detection and accurate diagnosis of these conditions are crucial for timely and effective treatment.
Ovulation is a critical process in dairy cattle reproduction. Research has shown that dairy cows experience a rise in body temperature ranging from 0.30 to 1.20°C in specific anatomical areas (such as the eye, cheek, neck, and vulva) from 48 to 24 hours prior to ovulation, as compared to four days before and the day of ovulation. [1] Understanding these temperature patterns can help in predicting ovulation more accurately, thereby improving breeding efficiency.
Calving, another significant event in dairy farming, involves noticeable temperature changes in cows. Studies indicate a decrease in reticulo-rumen temperature by about 0.2 to 0.4 degrees Celsius within 24 hours before parturition. [2] Monitoring these temperature shifts can aid in predicting calving time, allowing for better preparedness and management during the calving process.
Milk Fever and Ketosis are metabolic diseases common in postpartum dairy cows. Milk fever, characterized by stages of mobility loss and potentially coma due to severe hypocalcemia, shows minimal initial impact on core body temperature, which tends to drop as the disease progresses. [3] Conversely, ketosis, often concurrent with milk fever, has not been shown to significantly affect body temperature, making its detection more reliant on other clinical symptoms or biochemical tests.
Mastitis, an inflammation of the mammary gland, significantly impacts milk production and cow health. It causes a considerable increase in body temperature, which can vary widely but typically rises by about 2.6 degrees Celsius. [4]Early detection through temperature monitoring can lead to prompt treatment, reducing the severity and duration of the disease.
Finally, the water intake of cows has a pronounced effect on their internal temperature dynamics. Different studies have shown that water consumption can lead to a significant drop in reticulo-rumen temperature, which varies depending on the volume and temperature of the water. Monitoring these temperature fluctuations by looking at the time required to return to baseline temperature (BTR) provides insights into the hydration status and health of the cows.[5]
Understanding and leveraging these temperature variations through technological means such as rumen temperature boluses, which continuously monitor and transmit temperature data, can vastly improve disease detection and management in dairy cattle. This project aims to develop and refine algorithms that can detect abnormal temperature patterns associated with these conditions, using a combination of mathematical and data-driven approaches to enhance the health monitoring and management practices on dairy farms.
3 Dataset
In the preparation of this study, the dataset utilizes comprised information sourced from three distinct online platforms, each contributing unique data elements pertinent to the health and management of dairy cattle. The integration of these sources allows for a comprehensive examination of cattle health from multiple perspectives.
The first data source, FarmLife, as shown in Fig. 1, is a digital platform dedicated to aggregating various aspects of cow management. It offers ground truth and detailed summaries concerning key areas such as reproduction, health, calving, hospital care, and dietary habits including eating and rumination behaviors. This information is critical for understanding the broader health conditions prevalent within the cattle population under study.
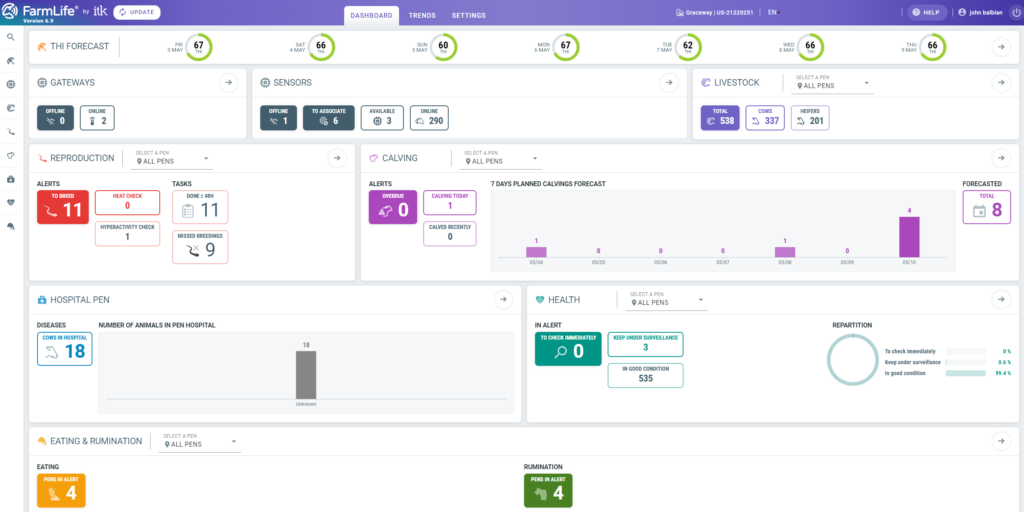
Fig. 1. Main Interface of Farmlife website
The second source, Cow Monitor, as shown in Fig. 2, provides data regarding specific physiological and demographic details of each cow. It contains basic identifiers such as cow ID and age, alongside their developmental stages categorized into weaning, calf, adult, or finishing. A noteworthy aspect of this dataset is the continuous monitoring of rumen temperature via ingested sensor boluses. These sensors deliver biometric data every 30 minutes, focusing particularly on the implications of temperature fluctuations which could indicate potential health issues.
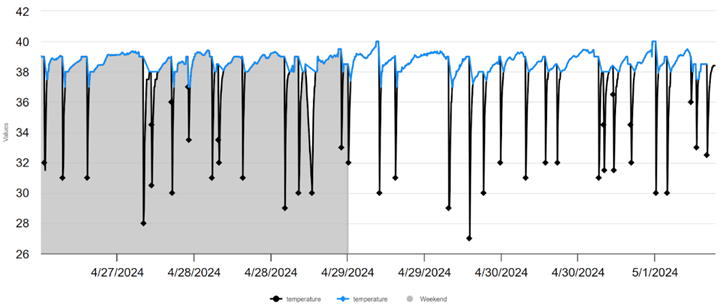
Fig. 2. Temperature data shown in Cow Monitor
Lastly, the H2O Degree water meter system, as shown in Fig. 3, provides data of monitoring water usage at two distinct locations. Each location is equipped with a water meter that records daily water consumption, event logs, and timestamps. Each water meter tracks two cows exhibiting irregular symptoms, which are put in by farm at each location, providing data that helps in correlating water intake patterns with potential health anomalies.
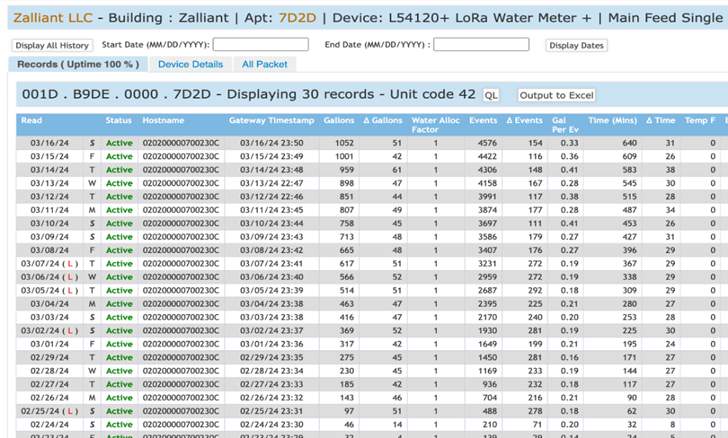
Fig. 3. Water Intake data are shown in H2O
Together, these datasets provide a comprehensive view of the physiological and environmental conditions affecting cattle, supporting the detection and analysis of emergent health patterns and forming the empirical foundation of this study, which aims to enhance understanding of the factors influencing cattle health and improve management practices.
4 Exploratory Data Analysis
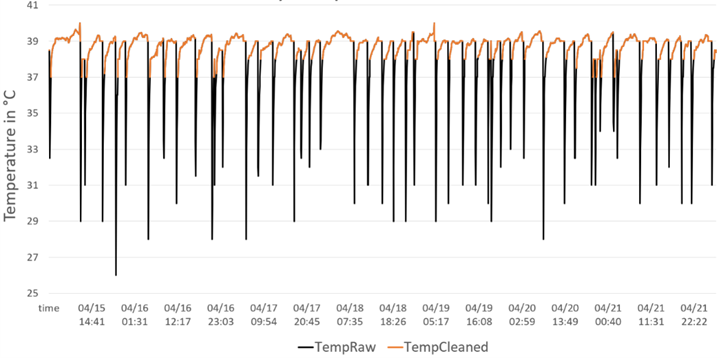
Fig. 4. Temperature data of a normal cattle 1699
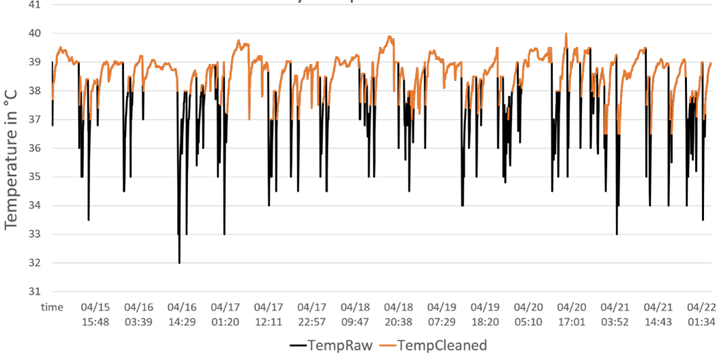
Fig. 5. Temperature data of an abnormal cattle
Fig. 4 is a picture of the temperature pattern of normal cattle and Fig. 5 is a picture of the temperature pattern of abnormal cattle. From the two pictures, it can be seen that there are significant differences between the two temperature patterns. For normal cattle, the temperature without drinking is around 38 to 39 degrees Celsius, and the temperature would drop to around 29 degrees Celsius after drinking water. Also, the drinking frequency of normal cattle is regular and the pattern is recognizable. However, for abnormal cattle, the overall temperature is noticeably higher, with temperatures after drinking water being only around 34 degrees Celsius. Also, the water intake pattern seems random and cannot be easily recognized.
Therefore, considering the differences between the two temperature patterns, we think the abnormality of cattle can be detected using temperature data and water intake data.
5 Model Development
5.1 Model 1: Water Intake Abnormality Detection
In this model, we detect cattle’s water intake abnormalities by analyzing their temperature information. Considering the significant differences between the temperature patterns of normal and abnormal cattle, we aim to use this discrepancy to determine if a cow is abnormal. Since the temperature of an abnormal cow is generally higher than that of a normal cow, we have designed higher and lower temperature thresholds. By counting the number of temperature data points that hit these thresholds, we can determine the abnormality of the cattle.
As shown in Fig. 6, the detection process begins with the collection of data, where time-series data regarding water intake is stored in CSV format. This data is then loaded into a dataframe for processing. Key steps in the model setup involve establishing threshold values for normal and abnormal water temperatures, which are essential for differentiating between usual and unusual consumption patterns. Following the data setup, a classification model is applied. This model classifies the data based on the predefined temperature thresholds and records each instance in the dataframe.
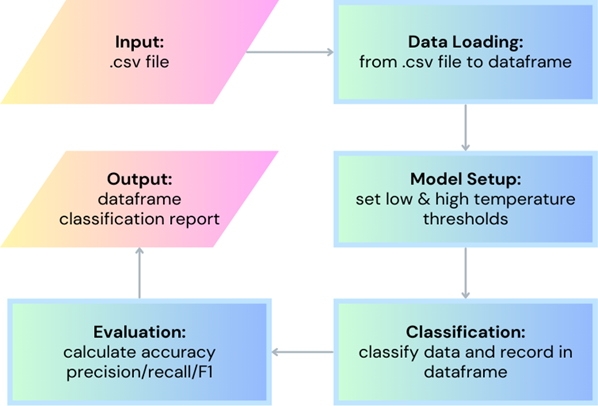
Fig. 6. Flow chart of water abnormality detection
The setting of temperature thresholds includes both higher and lower limits. The higher temperature threshold is set at 40 degrees Celsius, while the lower temperature thresholds are set at 32, 33.5, and 34.5 degrees Celsius. If the cattle exhibit temperatures above the higher thresholds or below the lower thresholds, we determine that the cattle have a water intake abnormality.
5.2 Model 2: Calving Detection
The second model is the calving detection model. As shown in Fig. 7, the process initiates with the input phase, where the model receives data in the form of a .csv file. Next, the data loading phase transitions this data into a dataframe structure, suitable for manipulation and analysis within the model.
The data preprocessing step is crucial in enhancing data quality; it involves setting a threshold to eliminate extreme temperature values and handling missing data (NAs). This is followed by two concurrent model setup steps: The first calculates the median temperature for each half of the day, which provides a baseline for normal temperature fluctuations, while the second calculates the average of the previous four data points compared with the current data point, establishing a pattern for detecting significant changes over time.
The classification step is central to the model’s function, employing a decreasing threshold to identify when a calving event is likely occurring based on temperature data, which is known to drop when calving is imminent. Finally, the model outputs two results: the updated data frame and a classification report. The classification report is generated after the evaluation phase, where the model’s accuracy, precision, recall, and F1 score are calculated to assess its performance in correctly detecting calving events.
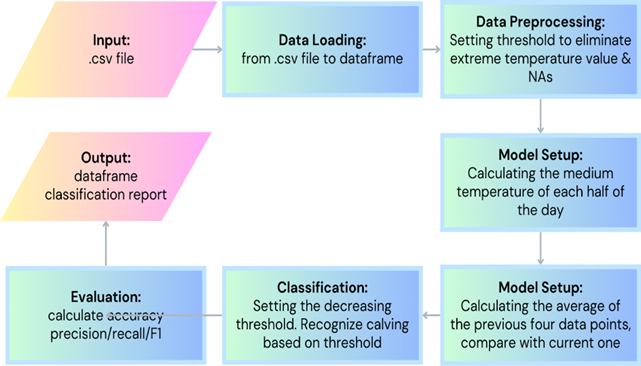
Fig. 7. Flow chart of calving detection
5.3 Model 3: Water Intake Prediciton
As shown in Fig. 8, the predictive analysis of water intake in dairy cows begins by collecting data stored in five .csv files, which include the historical reading of a water meter and the body temperatures of the two cows that are currently using the water meter. This data is then loaded into dataframes, providing a structured format that facilitates easier manipulation. The preprocessing phase involves joining data in multiple data frames, removing missing values, and adjusting for different time zones to ensure consistency.
Features that influence water intake are extracted after the data frames are combined. The selection of the features is essential to regression performance. We currently use 8 features as listed below but there is still large room for optimizing the selection. Both the features and targets (actual water intake) are grouped in bins of the hour, which are used as the observations in the regression. To identify the data point related to water intake, we directly compare the raw temperature data with the data where the effects of water intake are removed. Both raw data and processed data are available from the Cow Monitor system, thus allowing a more efficient algorithm. To extract the amplitude of the temperature drop, we use thresholds of 32.5, 33, and 33.5 degrees Celsius and record the number of timestamps with temperature below the threshold.
- NumDrink: number of timestamps identified as drinking
- MinDrop: minimum temperature recorded
- NumBelowT1: number of timestamps with temperature below threshold 1
- NumBelowT2: number of timestamps with temperature below threshold 2
- NumBelowT3: number of timestamps with temperature below threshold 3
- AvgDrink: the mean temperature for timestamps identified as drinking
- TotalDrink: sum of temperature for timestamps identified as drinking
- AvgTemp: mean baseline temperature during the hour
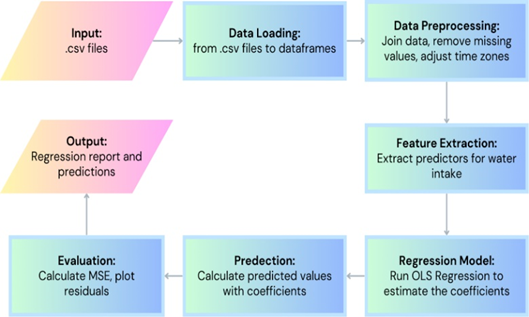
Fig. 8. Flow chart of water intake prediction
An Ordinary Least Squares (OLS) regression model is then built using these features to estimate the relationships and predict water intake. Predictions are then calculated by the regression coefficients, and the residuals are calculated accordingly. The model’s accuracy is evaluated using the Mean Squared Error (MSE) and residual plots to assess the fit between the observed and predicted values. Finally, a regression report and predictions are generated, outlining the model’s performance and the expected water intake.
6 Result
6.1 Model 1: Water Intake Abnormality Detection
The dataset for water abnormality detection includes a total of 21 cattle, comprising 10 abnormal and 11 normal cattle. The effectiveness of this classification is meticulously evaluated through various statistical measures including precision, recall, accuracy, and the F1 score as shown in Fig. 9. As depicted in the results, the model achieved a precision, recall, accuracy, and F1 score of 1.00, indicating perfect performance in this scenario.

Fig. 9. Results of water intake abnormality detection
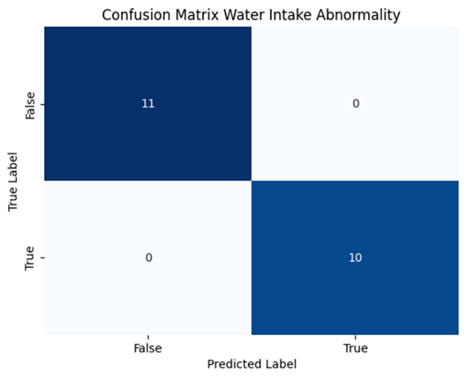
Fig. 10. Confusion matrix of water intake abnormality detection
The results are also visually represented in a confusion matrix, which further confirms the model’s accuracy. In this matrix, the true positive and true negative rates are illustrated, showing the model’s flawless performance with no false positives or negatives in predicting water intake abnormalities.
To sum up, this water abnormality detection system offers a highly accurate tool for monitoring the health of dairy cows through their water consumption patterns. By leveraging advanced data analysis techniques and setting precise thresholds, the system ensures early detection of potential health issues, allowing for timely interventions and better health management of the herd. This not only contributes to the welfare of the animals but also enhances the efficiency and sustainability of dairy farming operations.
6.2 Model 2: Calving Detection
As shown in Fig. 11, based on the analytical outcomes of our study, the predictive model has achieved an accuracy rate of approximately 81%. Our research encompasses a sample of 16 cows, deliberately selected to ensure a balanced representation: half are clinically normal and the other half had recently undergone calving. Despite the overall success of the model, there are instances where the conditions of 3 cows are incorrectly interpreted.

Fig. 11. Results of calving detection
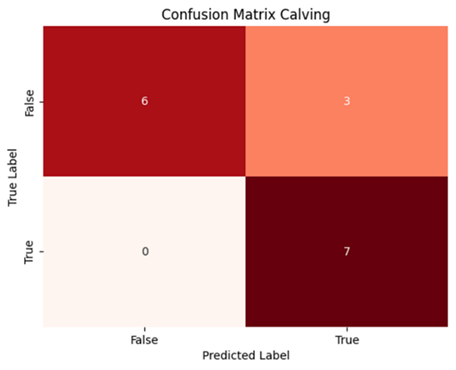
Fig. 12. Confusion matrix of calving detection
As Fig. 12 shown, within these inaccuracies, two cases are attributed to an aberration in the body temperature of the cows which is higher than their typical range. Subsequently, as their temperatures normalize, the algorithm recognize this reduction as indicative of a calving event, thus leading to a false positive classification. These misclassifications highlight potential areas for refinement in our algorithm, particularly in distinguishing between normal temperature fluctuations and those specifically relate to calving events.
6.3 Model 3: Water Intake Prediction
We run the water intake regression on four cows for a total of 30 days. The regression report is shown in Fig.13. The overall R-square we have achieved is 0.621. The R-square is not as high as we expected as we have found the model to be able to perfectly predict all the data when we experiment on a short timeframe of 5 days. As reflected in the p-value, most of the coefficients are not statistically significant except for the baseline temperature AvgTemp. We attribute this to the multi-collinearity between the variables.
However, we have decided not to remove any of these variables despite the multi-collinearity because removing any of these variables will result in a significant increase in the mean square error. In terms of AvgTemp, the result reveals a strongly negative correlation between the average baseline temperature and the amount of water intake. This is very likely because the baseline temperature of a cow usually increases only when the cow is experiencing some other health conditions like diseases or ovulation, which is mostly of the time companying with the decrease in water and food intake.
Despite the R-square value not reaching the anticipated levels, the regression model demonstrated considerable effectiveness in its application. The majority of residuals remained tightly bound within a ±4 range, which, considering the water intake varies between 38.9 to 57.2, allows for highly accurate classifications across multiple categories—specifically, 2, 3, or 4 classes. This level of precision is particularly advantageous for monitoring fluctuations in water consumption, which is critical for early detection of reductions in water intake that could indicate other underlying health issues, such as ovulation cycles in dairy cows.
In broader terms, the regression model has shown a high degree of effectiveness in predicting daily water intake over short periods, providing valuable insights into the hydration patterns of dairy cows. It also exhibits satisfying generalizability when applied over longer timeframes and across a larger population of cows, suggesting its utility in diverse farming environments. However, the dataset used in the current study was limited, which might restrict the comprehensive evaluation of the model’s performance. To enhance the accuracy and reliability of the predictions, it is advisable to extend the study to include a larger sample of cows and to span a more extended period, which ensures more precise predictions.
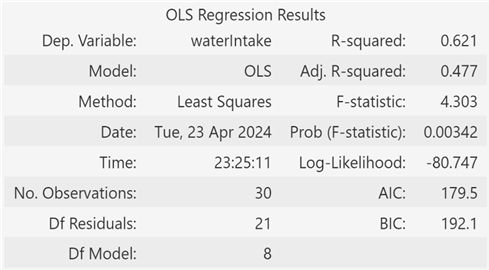
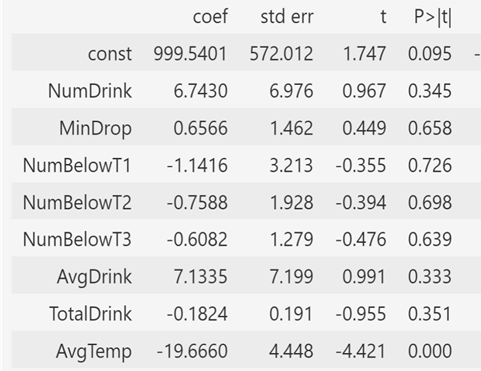
Fig. 13. Regression table of water intake prediction
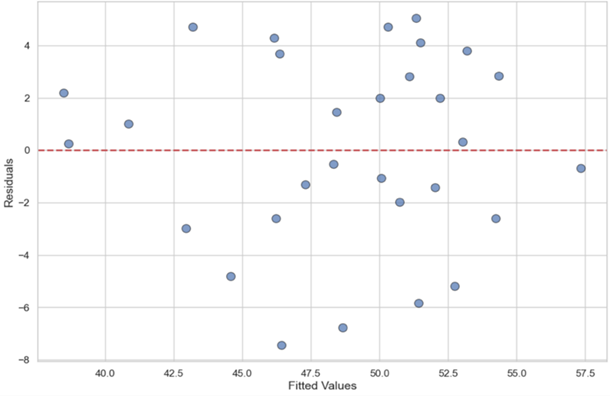
Fig. 14. Residual plot of water intake prediction
7 Conclusion
The three innovative models show great potential in detecting abnormal conditions of dairy cattle while subject to further improvements.
However, there is still room for improvement in each model and future work on ovulation detection. The water intake abnormality detection model’s high accuracy in distinguishing between normal and abnormal cases highlights its potential utility. However, further testing on a broader dataset and enhancement of the algorithm to identify specific diseases are needed to increase its practical application. With a reliability rate of 81.25%, the calving detection model proves effective but faces challenges with false positives and negatives due to temperature variability. Future iterations should explore additional physiological indicators to refine accuracy.
The daily water intake prediction model aims to predict daily water intake, showing promise in its initial tests. The challenges we have faced include the integration of scattered data sources and the inherent variability in animal behavior, which complicates data modeling. The model can be further improved by expanding the data to longer timeframes and a more diverse group of cattle to improve generalizability. It will also be meaningful to closely examine the feature selection, potentially integrating feature selection algorithm.
Future work will focus on extending these models to predict ovulation by incorporating insights from the abnormalities in water intake before ovulation, despite the minimal impact of temperature changes. Enhancing algorithm robustness will also be critical. By addressing these challenges and continuing to refine our models, we aim to develop a more robust system that can significantly aid farmers in the early detection and management of health issues in dairy cattle, ultimately leading to improved animal welfare and farm productivity.
References
- Author, F.: Article title. Journal 2(5), 99–110 (2016)
- Author, F., Author, S.: Title of a proceedings paper. In: Editor, F., Editor, S. (eds.) CONFERENCE 2016, LNCS, vol. 9999, pp. 1–13. Springer, Heidelberg (2016)
- Author, F., Author, S., Author, T.: Book title. 2nd edn. Publisher, Location (1999)
- Author, F.: Contribution title. In: 9th International Proceedings on Proceedings, pp. 1–2. Publisher, Location (2010)
- LNCS Homepage, http://www.springer.com/lncs, last accessed 2023/06/20