PROBLEM STATEMENT
NEEDS/WANTS SPECIFICATIONS
PROTOTYPING PROCESS
TESTING RESULTS
CUSTOMER FEEDBACK
FUTURE WORK
OUR DESIGN TEAM
Problem Statement
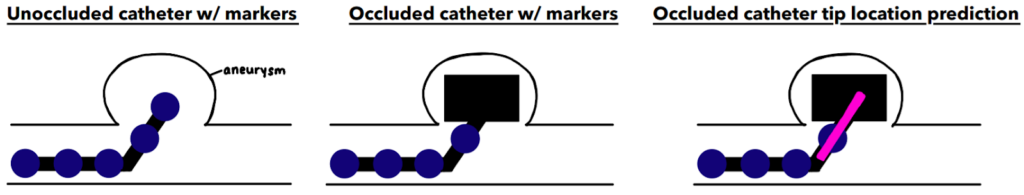
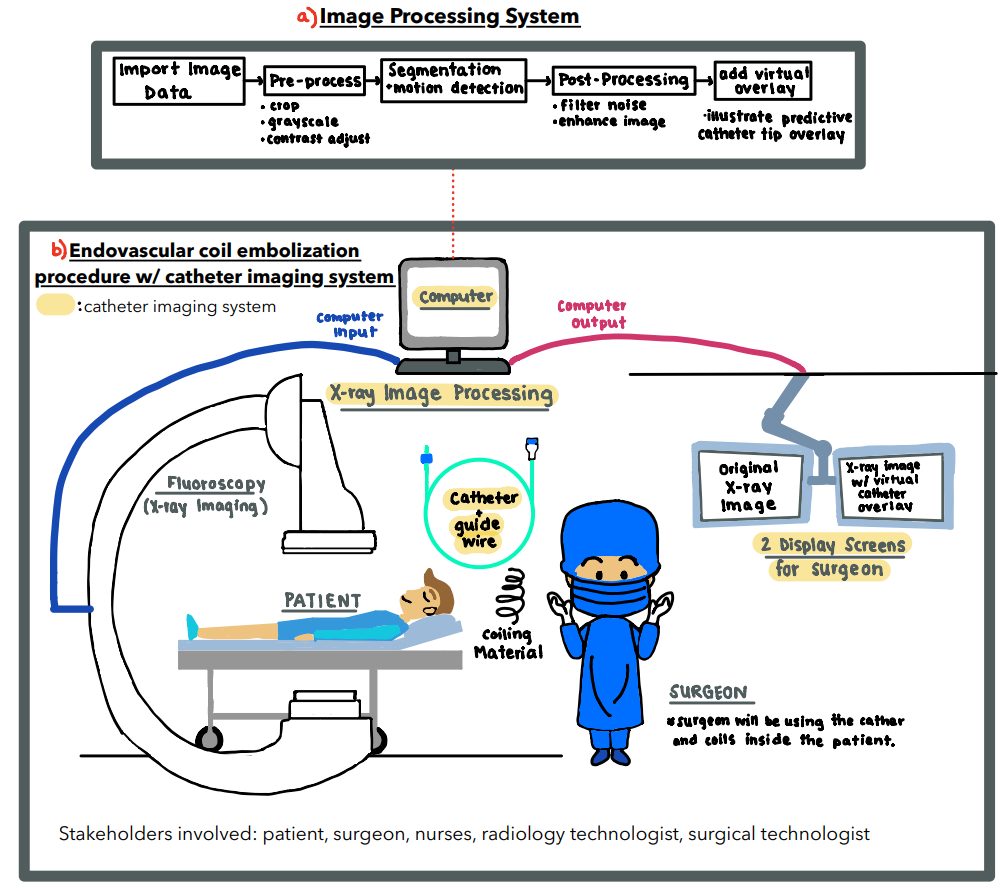
Endovascular coiling is a common surgical procedure used to prevent aneurysm rupture. This involves the use of a catheter to feed microwires into an aneurysm. The presence of many radio-dense materials such as catheters and coiling wires results in the surgeon having poor visualization of the catheter tip during surgery. The overall goal of this project is to track the catheter tip by estimating how far it has moved into occlusion. Our localization goal will be accomplished by designing a catheter with markers and an image processing system that is able to provide the surgeon with information that may not be visible with occlusions.
Needs/Wants Specifications
These are the identified needs and wants of our customers in the design of the catheter and image processing system. These needs and wants, once identified, will also have a corresponding metric that can be measured and a value or range of values that when reached we will consider that need or want to be met.
Needs
| Customer Requirement | Translated Metric | Possible Target |
| Accurately determine tip position | 95% Confidence (p<0.05) | 1 mm |
| Image covers the full clinical area | Field of View | 28 cm2 |
Wants
| Customer Requirement | Translated Metric | Possible Target |
| Real-time | Latency | 200 – 400 ms 1 – 2 second (analysis of single photo) |
Prototyping Process
Our prototyping process involved both physical and computational designs that will ultimately interact with another to create the entire catheter imaging system prototype. The goal of our physical prototype portion of our system was to build a system that best represents an endovascular coiling procedure in which an occlusion is present and is blocking the catheter tip from camera view. Images of the physical prototype were then taken and analyzed computationally to provide a real-time estimate of the actual location of the occluded catheter tip.
Physical Prototype Setup
3-D Printed Aneurysm Phantom
We first designed and 3D-printed an aneurysm phantom that was best suited for our system: a cross section with stabilizers. As seen below, it was designed with CAD then printed and ready for use in our physical system.
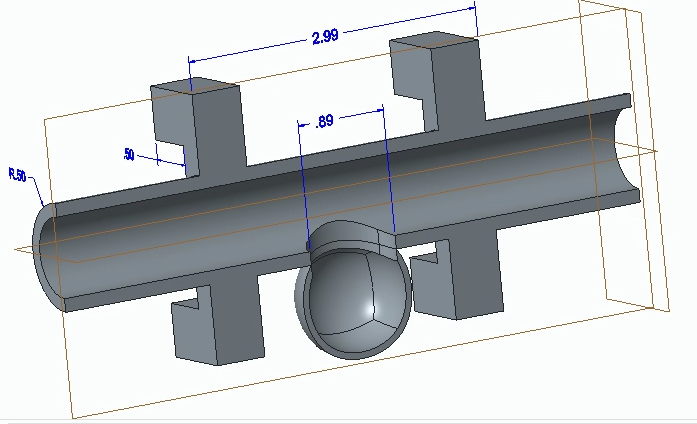
CAD Drawing of Aneurysm Phantom 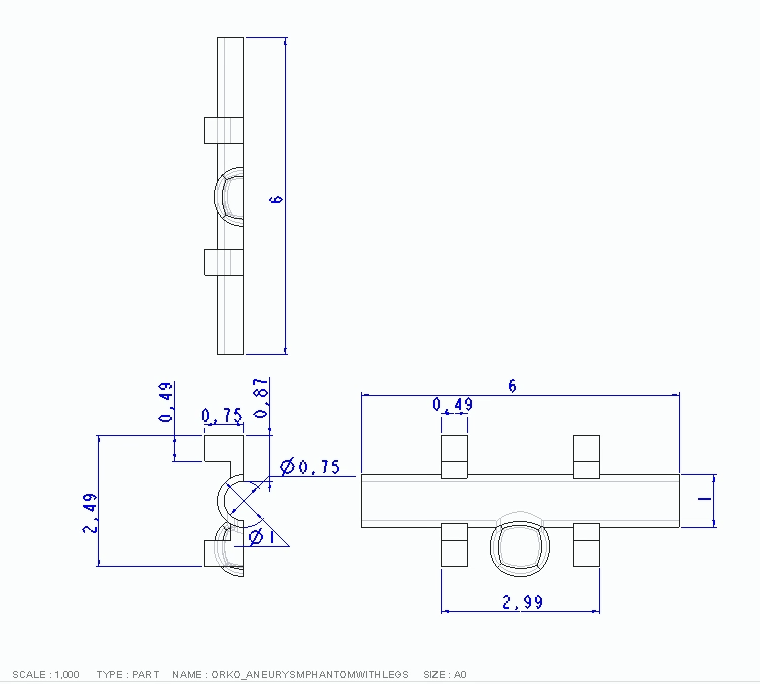
Technical Drawing of Aneurysm Phantom 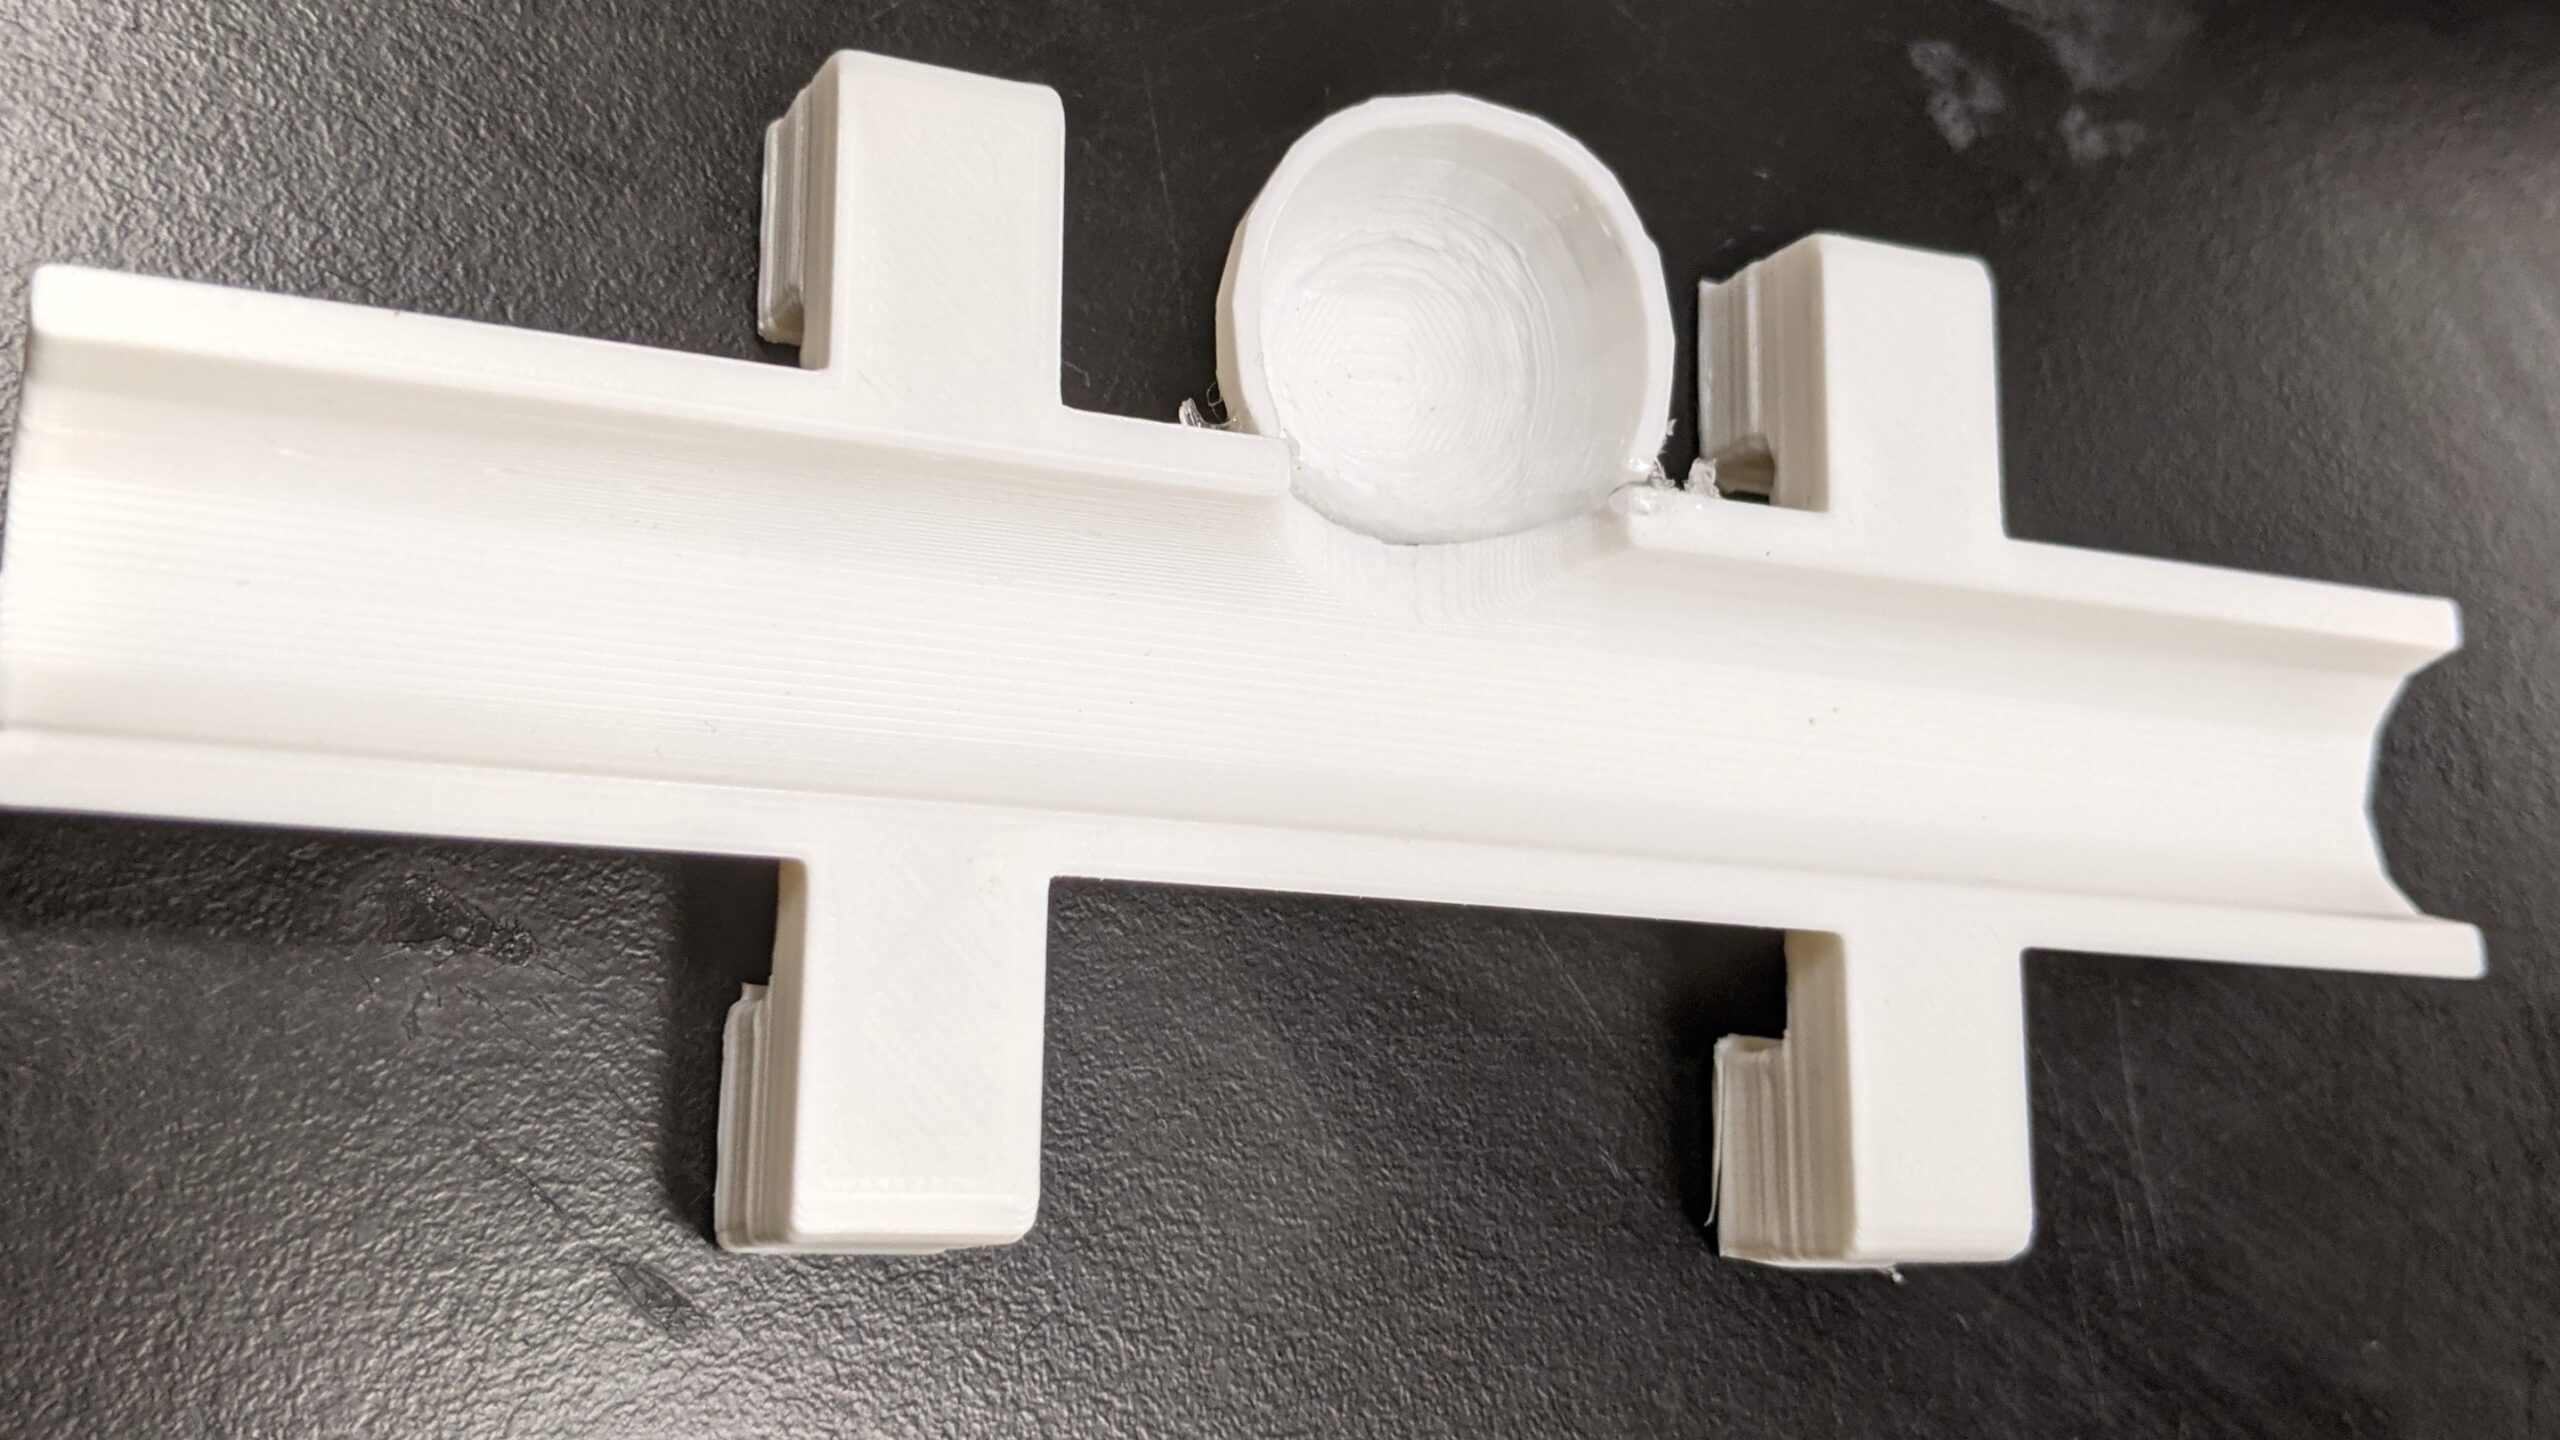
3-D Printed Aneurysm Phantom
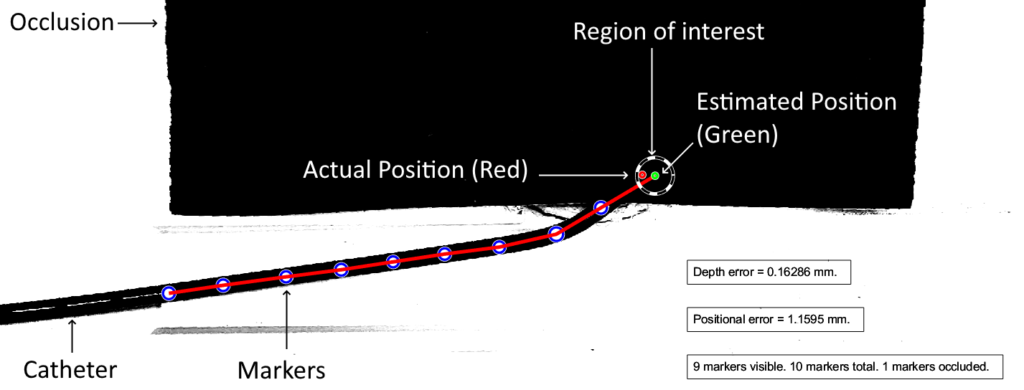
Straight Tip Catheter with Markers

In order to extrapolate and estimate the location of the hidden catheter tip, we chose to add markers (painted dots) to the physical catheter. These circular dots can be detected computationally and their marker location data may be used to calculate & estimate the hidden catheter tip position.
Physical Setup with 3-D Aneurysm Phantom
Next, the aneurysm phantom was placed on a light table facing up towards a iPhone camera mount. The third image below demonstrates the final setup for our physical system in which the phone camera is taking images/videos of the aneurysm on the light table while the catheter is being moved in and out of the aneurysm with occlusions are being added and removed.
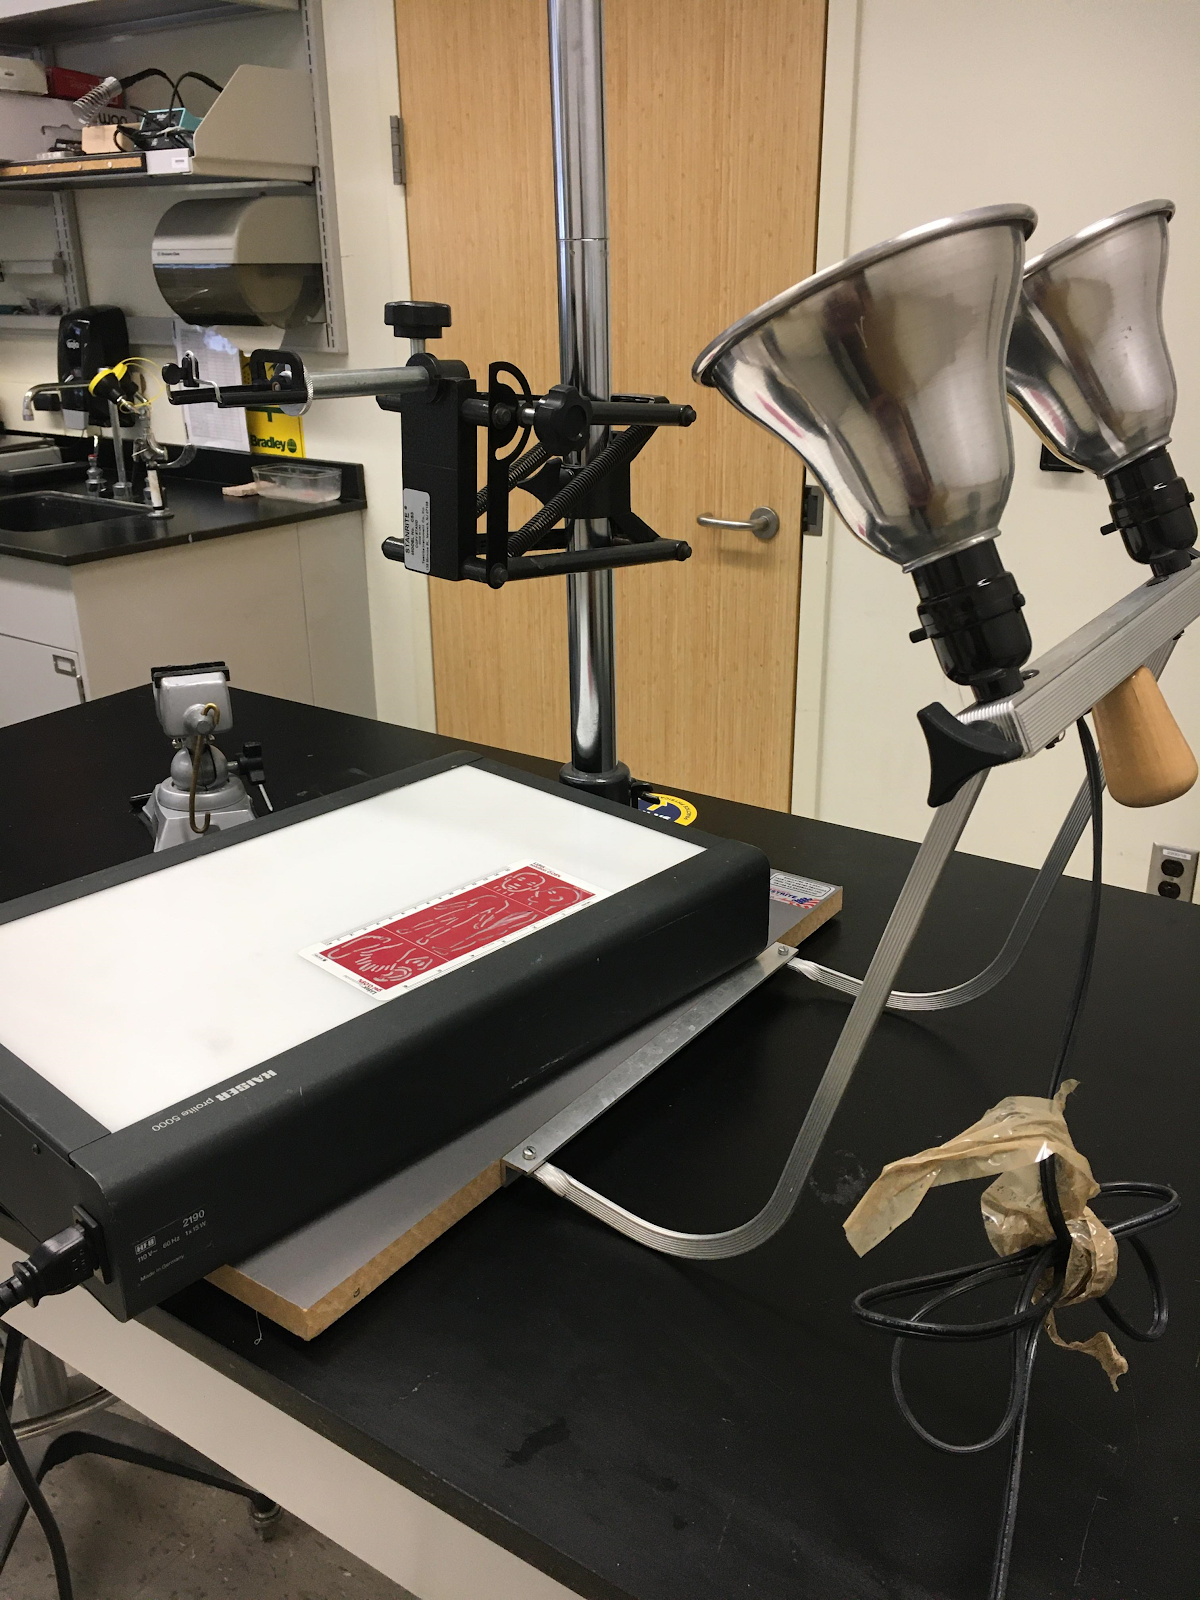
Light Table Setup 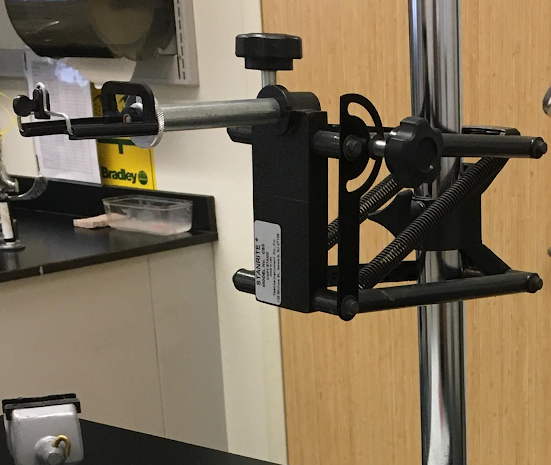
Phone Attachment Mount 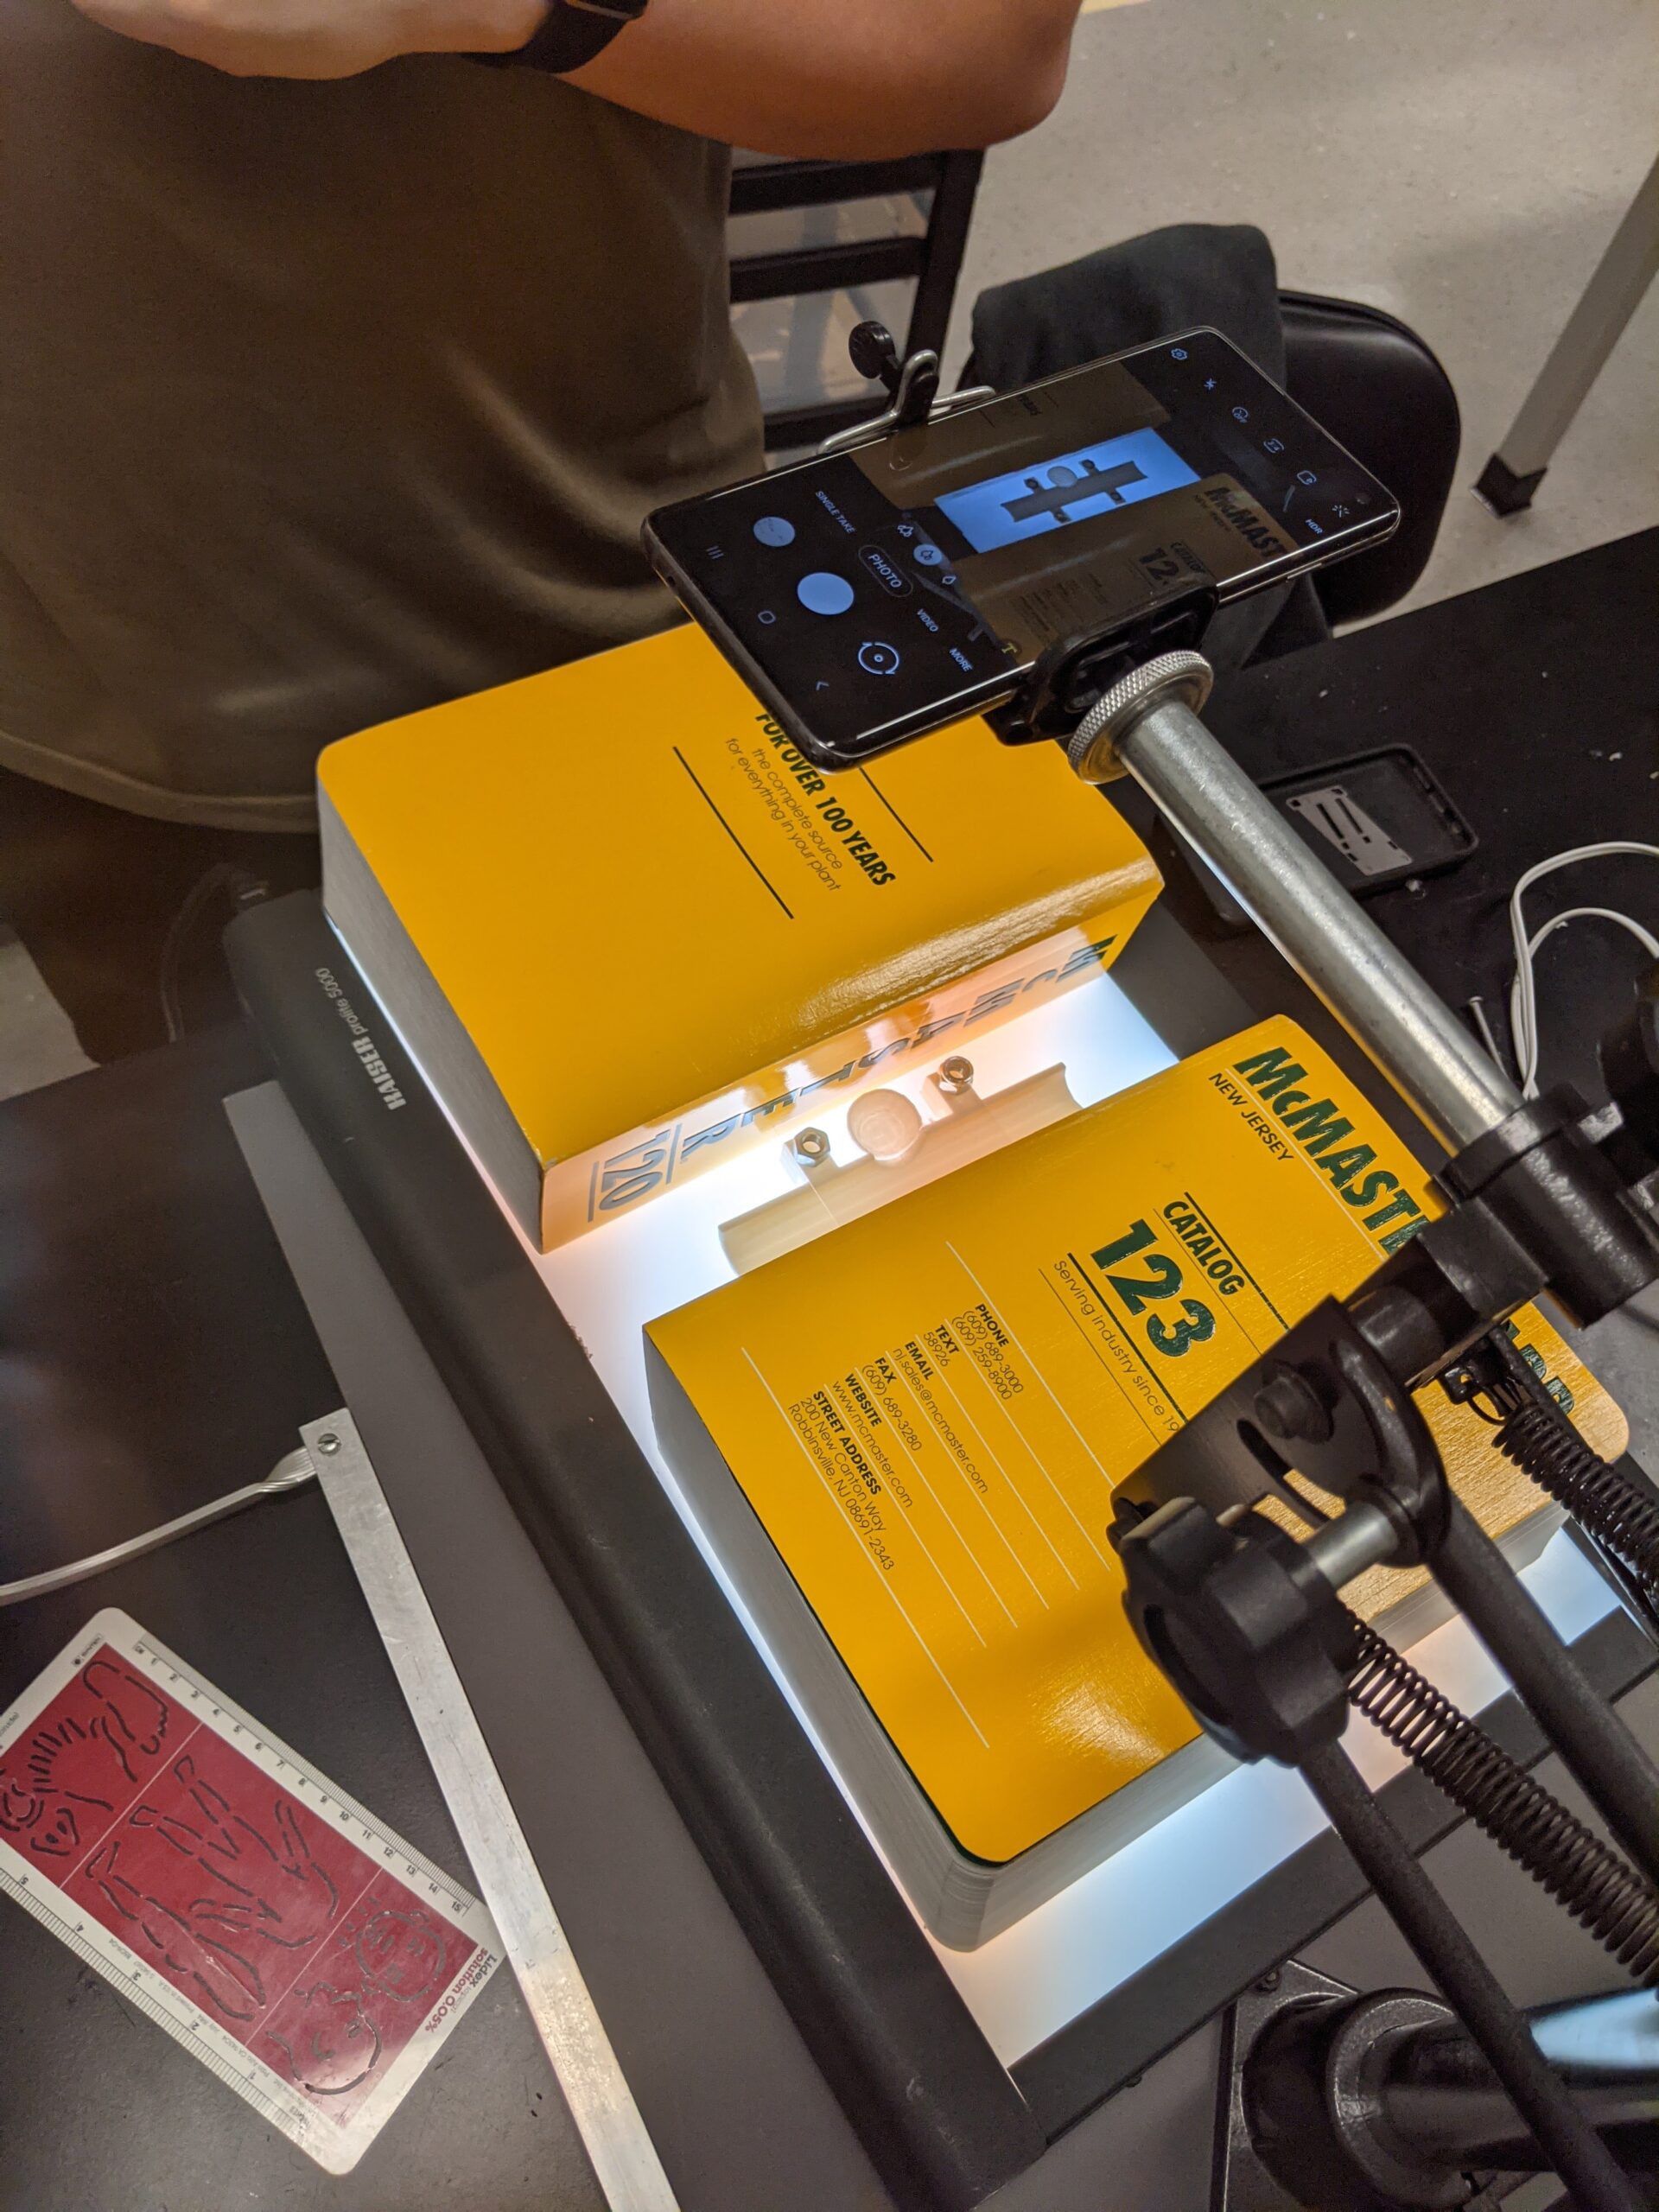
Physical Setup in-action
Computational Detection and Estimation Process
Below is a flowchart that outlines our image analysis and estimation process using MATLAB. Overall, our system works by pre-processing, detecting the circular markers on the catheter , and using this marker data and extrapolation to best estimate the position of the occluded catheter tip.

Final Prototype Setup and Outputs
The final output of our prototype is demonstrated in the video below. This video illustrates the system detecting, extrapolating and overlaying an estimated location of the hidden catheter tip in the aneurysm phantom setup.
Catheter Imaging System Prototype In-Action
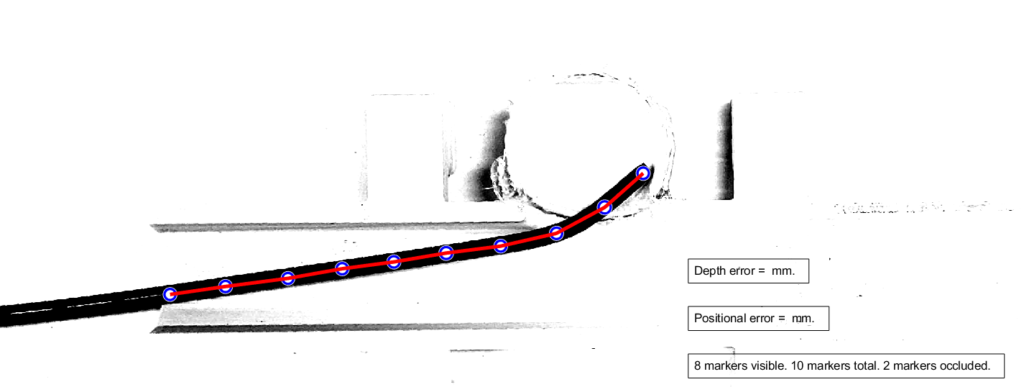
Example Output Frame with Descriptors
Testing Results
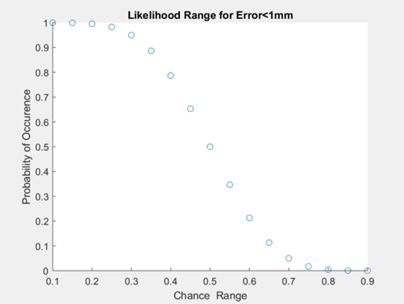
We tested our software to assess if our code was able to accurately locate the catheter tip. The overall goal was to assess if the ground truth catheter location was within 1mm accuracy of our software. Once errors were obtained for each frame (process described below), we performed a binomial distribution for a range of chance values. In other words, we wanted to find the maximum percentage of time that our algorithm will locate the catheter tip with 1mm accuracy (error<1mm). Figure X below shows a plot of chances ranging from 10% to 90%, using the calculated error data. We found that the maximum percentage of time the catheter tip will be located with 1mm accuracy is 70% of the time. However, it must be noted here that our considerations for further development (indicated in the next section) may drastically improve this outcome.
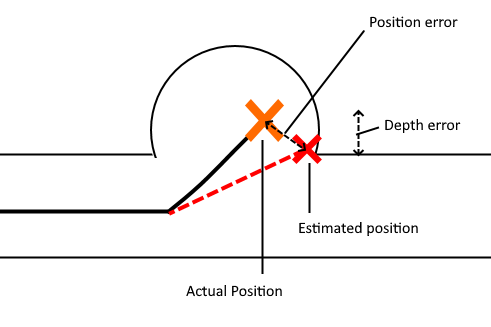
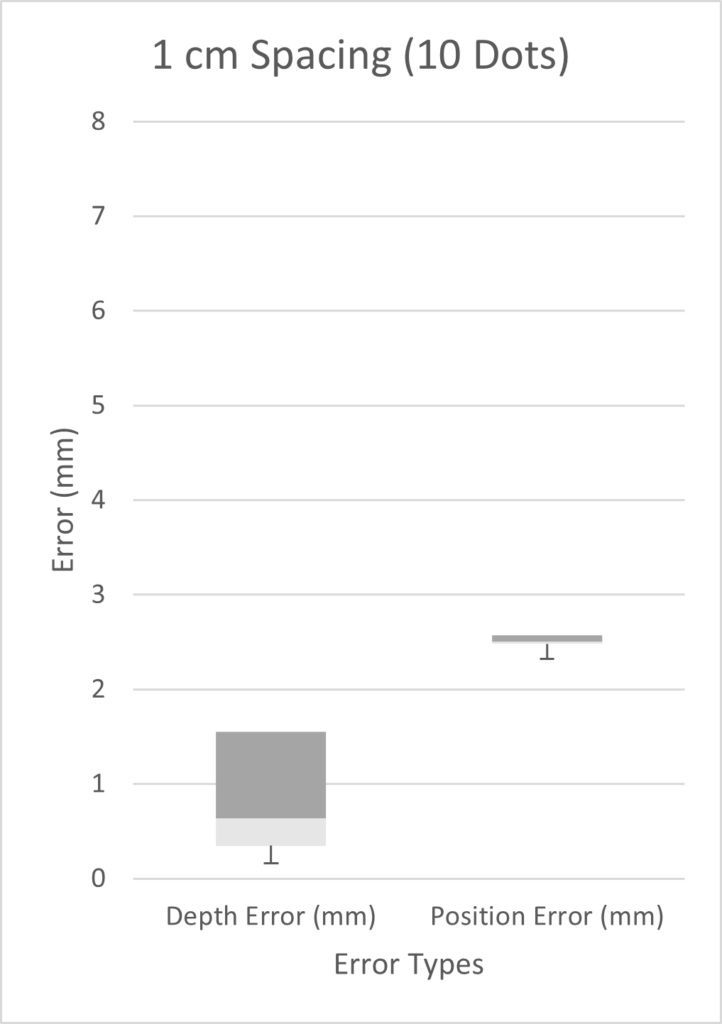
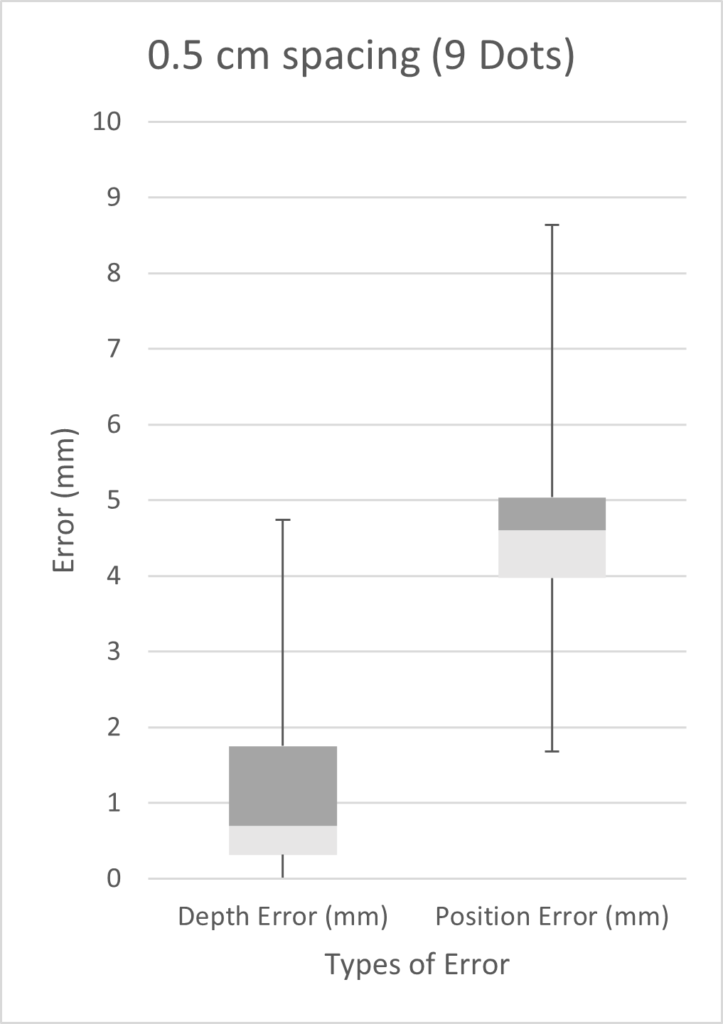
The diagram below illustrates the two kinds of error we investigated. Position error is the most straightforward, being the distance between the actual and the estimated position of the tip. Depth error is the distance perpendicular to the length of the blood vessel. The relevance of depth error is in helping the surgeon avoid the re-entry of the catheter tip into the blood stream, exposing unwanted clot-inducing material into the blood flow.
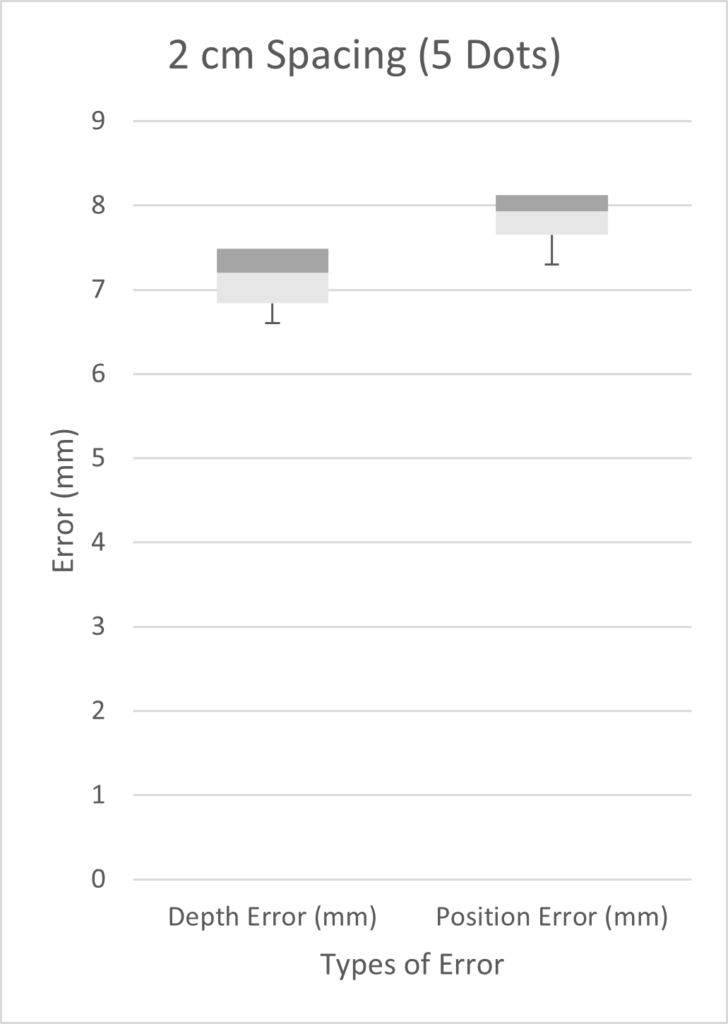
We tested three scenarios: 5 dots spaced 2 cm apart, 9 dots spaced 0.5 cm apart, and 10 dots spaced 1 cm apart. Given more time, we would have performed a full factorial design of experiments (DOE). However, in the time constraints of our project, we chose three scenarios on the basis that we expected our best results to come from a high number of markers with small inter-marker spacings. As seen from the three box plots below, the only two scenarios with errors under 1 mm were the depth errors for 0.5cm and 1cm fiducial spacing. This is expected as greater spacing led to a smaller number of fiducials, which results in less information possible for tip extrapolation.
Customer Feedback
Our response from the customer, Dr. Jonathan Stone, has been positive. We were able to take feedback on board through a pivot near the end of our project. This pivot involved tracking the tip of the catheter in the presence of full occlusion compared to previous work tracking the microwire. Going forward we are now emphasizing the depth of the catheter tip in our display, using fiducials to track the catheter tip in real time. Our customer is optimistic about proceeding further with this project using our pathfinding and proof-of-concept materials to demonstrate the viability of this approach.
Future Work
For our project, we were able to accomplish our goal of producing preliminary software that uses fiducials to track the catheter tip in real time. We pursued this with various goals in mind: perform initial path-finding that can be used to inform development, clearly define the problem statement by characterizing the customer’s use scenario and incorporating the voice of the customer (VOC), and provide a usable demonstration that our customer can present to investors. We also determined a suitable way to visually present location information from catheter tracking to the neurosurgeon, such as a specific region of interest. However, many of our prototyping efforts were based on simplifications. For example, the fiducials we used were painted dots rather than actual, biocompatible fiducials that can be used in the body. Future work would require a team working more on the fiducial side of this project, finding ways to produce markers that will allow localization while being safe to use in the body. Additionally, while the processing is happening quickly (< 1 second), a company or team taking on this project may want to use specialized equipment to make the run-time even lower (< 0.3 seconds). The goal is to make this as real-time as physically possible so the neurosurgeon can always know where the tip is.
Catheter Imaging Team
Michaela Alarie
Pursuing a PhD in Biomedical Engineering at Brown University.
Renae Lapins
Pursuing a PhD in Biomedical Engineering at University of Utah.

Thomas Cadenhead
Attending Army officer training and pursuing a job in the biomedical engineering field.

Warish Orko
Pursuing a MS in Biomedical Engineering at the Center for Medical Technology and Innovation at the University of Rochester, to enter the medical device design industry.