Authors:
Supervisors
Ajay Anand, Pedro Fernandez
Department of Data Science, UR
Sponsors
Kate May, Na Liu
City of Rochester
Background
The City of Rochester has hundreds convenience stores and liquor stores. There is a thought that certain types of crime might be higher in the areas surrounding these stores. Additionally, we explored vacant land parcels, to look into the broken window theory – if there are visible signs of crime/disorder, it will increase rater of crime. If there is supporting evidence of this these ideas, policing policies may be changed to better protect the people of Rochester.
The City of Rochester has lots of available data surrounding crime statistics. Using this data, we want to identify if there is a relationship between part 1 crime in the city and the location of convenience stores or liquor stores. To accomplish this, we established the following definitions to ensure uniformity throughout the process:
Part 1 Crime: Murder, manslaughter, robbery, aggravated assault, burglary, motor vehicle theft
Convenience Store: Typically less than 5,000 square feet and sells a range of everyday items
Liquor Store: Exclusively sells liquor and wine

Goals
The objective is to build a model to provide further insight to crime in the city of Rochester and create a visualization of crime patterns across the city & locations of convenience stores, as well as vacant structures.
Methodologies
- Combine crime data with convenience and liquor stores data.
- Develop an interpretation of crime severity scale based on the City of Rochester crime dataset. Establish clear definitions for what qualifies as convenience or liquor store.
- Obtain geospatial data and map data to provide further insight with visualization.
- Build model to provide insight into crime across the city of Rochester.
Description of Datasets
https://data.cityofrochester.gov/app/city-of-rochester-police-department-open-data-portal
The first data set we used was the open data portal from the City of Rochester. It contains information on just over 104,000 crimes from approximately the last 10 years. The key information we needed was the crime description and location for calculating distances to stores.
https://data.ny.gov/Economic-Development/Retail-Food-Stores/9a8c-vfzj/data
The next data source we used was from the NYS retail food store database. This contains the location of all food-selling stores in New York, along with square footage which was critical for our filtering of convenience stores which were determined to have a square footage approximately 5,000ft or less. There are over 28,300 entries which we filtered by the store type code in the dataset to only include food and miscellaneous selling stores. Then we used the filter to select stores from Rochester and trim any that didn’t fit in our provided shape file. Lastly, we sorted by square footage and removed all stores with greater than 5,000ft that were not obvious exceptions such as a larger CVS.
Next was the liquor data, which was acquired in the same way as the convenience store data. We filtered the 50,000 entries to only stores that sold liquor. Then we filtered to just Rochester and used the shapefile to trim any extraneous entries.
https://data.cityofrochester.gov/datasets/tax-parcels-vacant-land-live
The tax parcel vacant land dataset from the City of Rochester gives all available vacant structures in Rochester. Since this uses the same shape as the City of Rochester shape file, there is nothing additional we needed to begin using this data.
https://www.cityofrochester.gov/neighborhooddatamap/
Lastly we added in data from the census for our model. We used the block groups from this data to look for explanatory variables in our model.
Data Preprocessing
After the data was prepared for download and limited to the City of Rochester bounds, there was still the challenge of combining all of the data. In order to properly utilize ArcGIS to calculate distances we had to remove columns we did not need for processing speed and clarity. We removed everything we did not need until we were left with the store address, location, type (liquor or convenience store) and coordinates. Not every record had X and Y coordinates which were essential for this to work. In order to work around this we uploaded the data with addresses to ArcGIS and used that software to calculate X and Y coordinates. Using that, we added the coordinates back into our file that was missing it. If the address or coordinates were missing we had to remove that data, but luckily there were almost no instances of this. The crime data had around 500 instances of missing address and coordinates so we removed those. As there are over 100,000 crimes, removing just 500 would not impact the significance of our results.
Exploratory Data Analysis

Based on our definitions and cleaning, our data set is left with 411 convenience stores and 42 liquor stores to process. Although many of the stores had missing square footage data, we were able to check the data quickly for obvious exceptions and felt satisfied we had a well-established definition for what we were going to analyze.

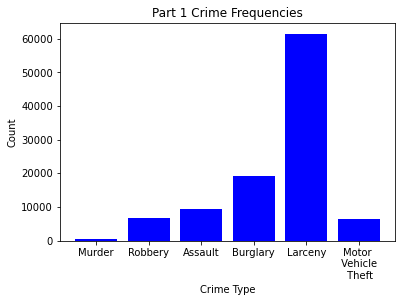
Next we checked on the available part 1 crime data. There was a disproportionate amount of larceny data available and overall around 100,000 data points for us to use.
Missing values posed a possible problem for us moving forward as we rely heavily on location information for analysis and graphing. We checked for any stores with missing data first and did not find any. In the crime dataset, there were many missing values for descriptions, patrol beats and several other columns that were deemed allowable for our purposes. There were 509 rows with missing information. We decided to remove these data as that small a percentage of information will not tarnish the significance of our analysis.
| Column | Number Missing Values |
|---|---|
| X | 497 |
| Y | 497 |
| Geocode_Address | 497 |
| Geo_Beat | 509 |
| Geo_Section | 509 |
| Geo_Section_Num | 509 |
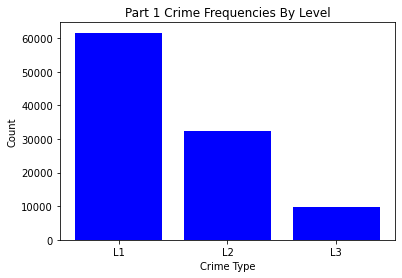
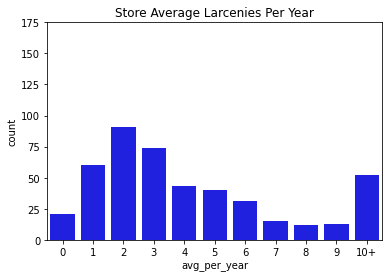
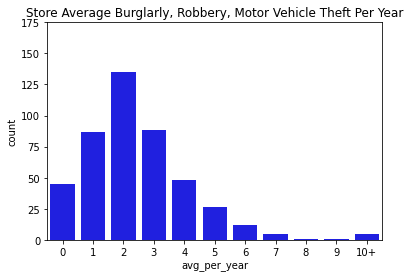
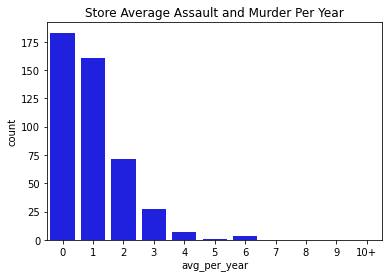
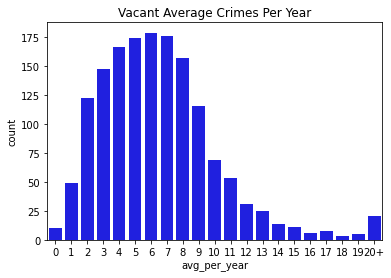
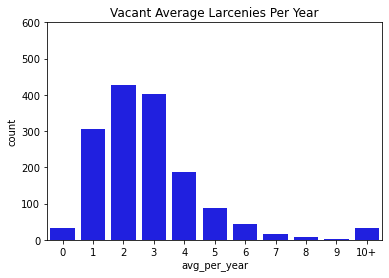
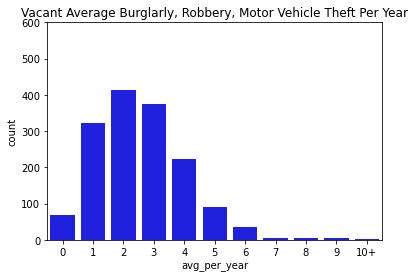
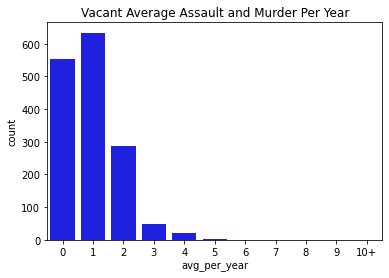
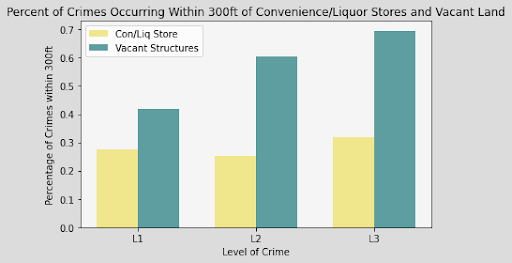
Next, we went through and visualized all of our data. Below you can find bar charts of all the crimes, followed by breakdowns of the crime. We broke the crime types into 3 levels. Level 1 was just larcenies because that was a particular interest for convenience and liquor stores. We might expect larcenies to be occurring at a far greater rate than other types of crimes because they are theft from a store. Next we split up the other types of theft and assault and murder. Separating the levels allowed us to check if there are specific patterns for certain types of crimes, or if there are any overall patterns. What we found was that each of the types of crimes was similarly distributed between the levels for both stores and vacant structure data, with a heavy skew to the large count for outliers. In addition, the final image showing the percentage of crimes that occurs within 300ft of the stores, shows occurrence around 30% no matter the crime level. The vacant structure data has higher Level 3 percentage, but this is expected due to vacant structures not being stores where things can be stolen from. The percentage of crimes were also not very high compared to how much land was taken up by all the convenience/liquor stores and vacant land. From an glance, it appeared the percentage of crimes within 300ft was about equal to the percentage of land taken up in Rochester. This was the first indications that the existence of these stores doesn’t actually affect part 1 crime.
Data Visualizations
Below are numerous visualizations created using ArcGIS. We utilized this software to create useful data and calculate occurrences of crime within 300ft of the stores and vacancies of Rochester. The images that are ‘Zoomed’ are in the same location along the river near the University of Rochester campus and the 19th Ward area.
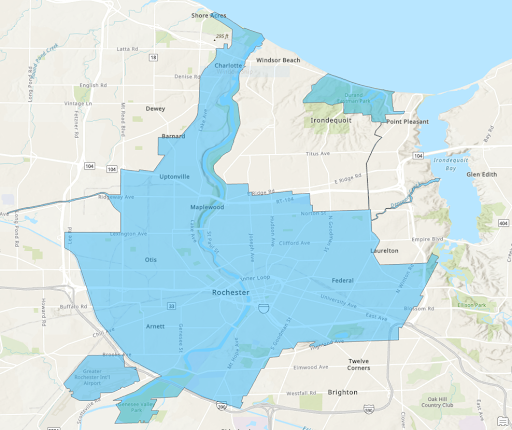
Rochester Shape 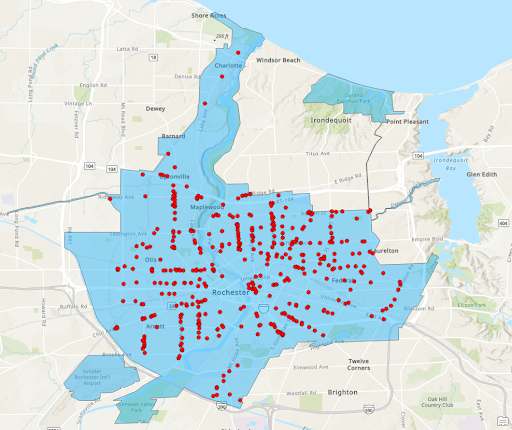
Convenience/Liquor Store Locations 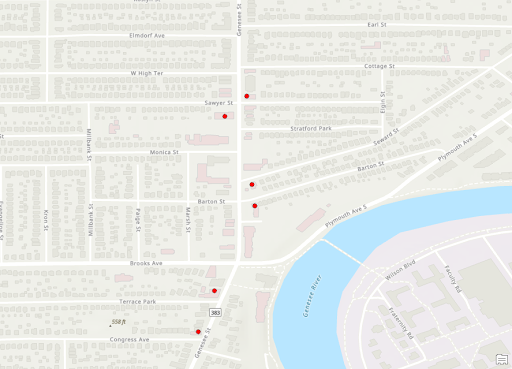
Stores Zoomed 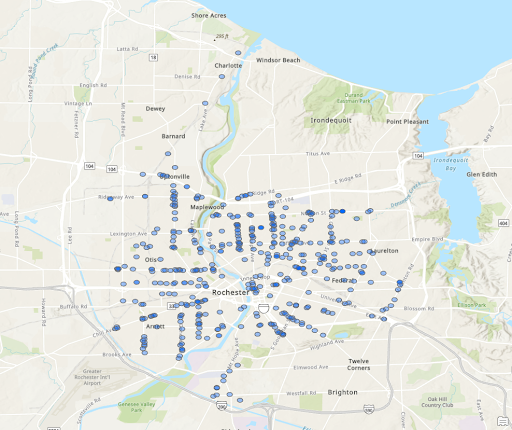
Stores with 300ft Buffer 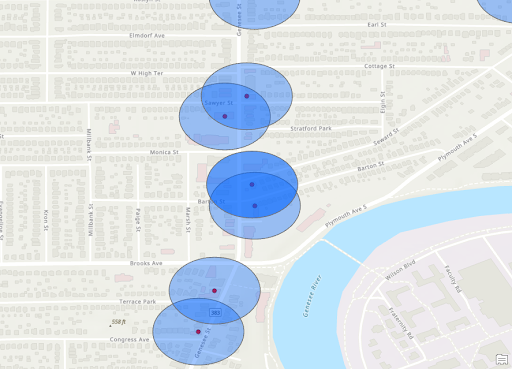
Store Zoomed with 300ft Buffer 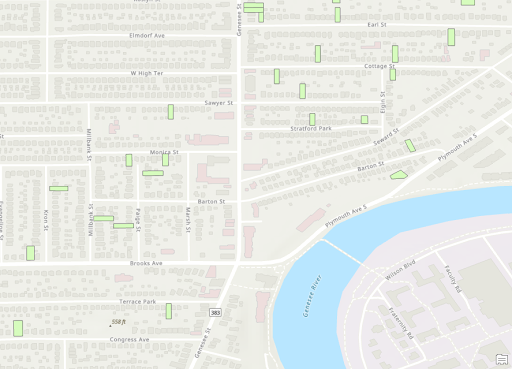
Vacant Structures Zoomed 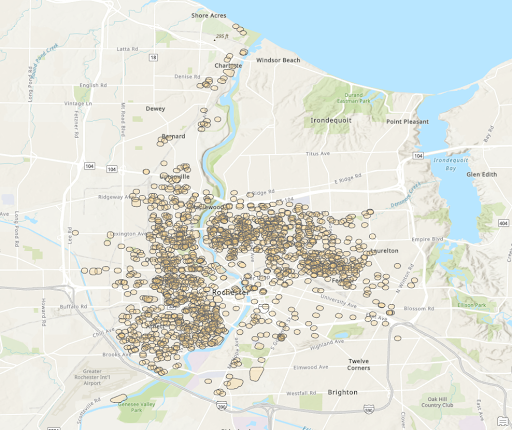
Vacant Structures with 300ft Buffer 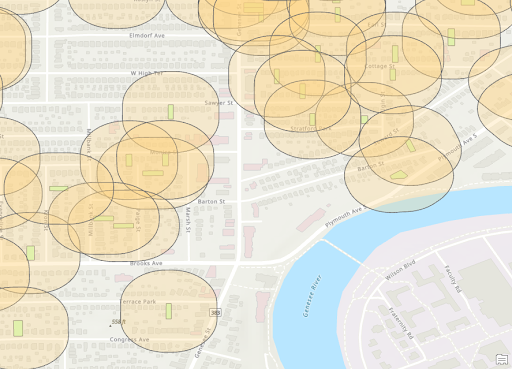
Vacant Zoomed with Buffer 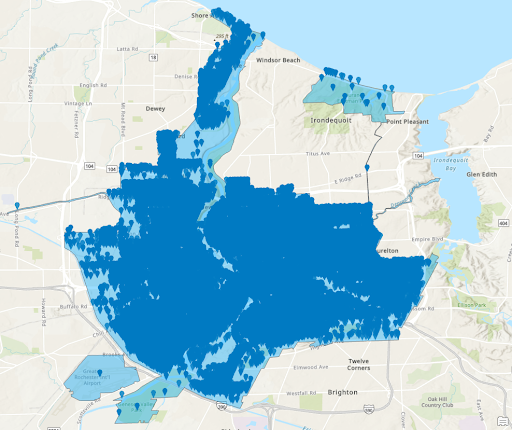
All Crimes 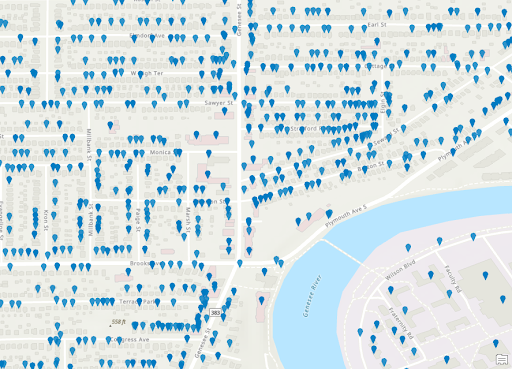
Location of Crimes Zoomed 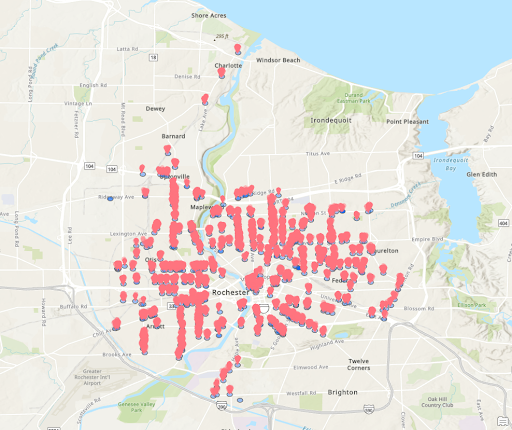
Crimes within 300ft of Stores 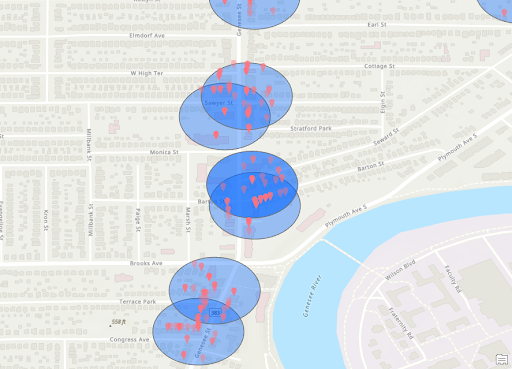
Zoomed Crimes in 300ft Buffer of Stores 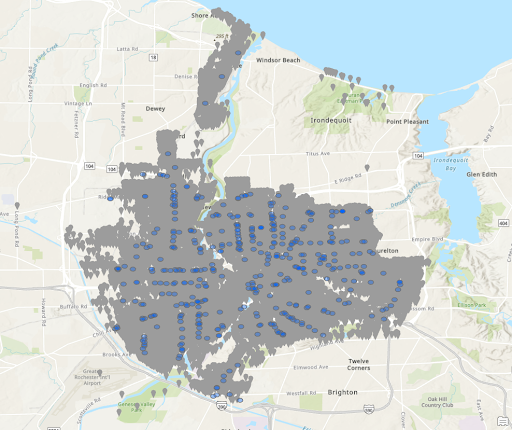
Crimes Outside 300ft Buffer of Stores 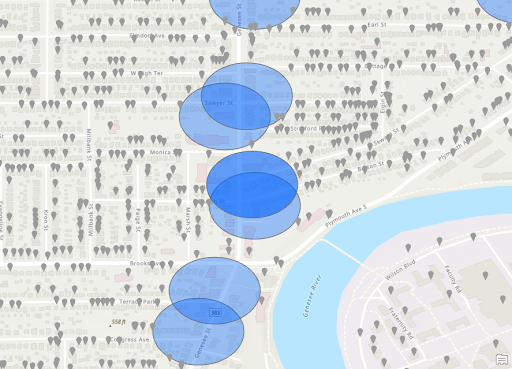
Zoomed Crimes Outside 300ft of Stores 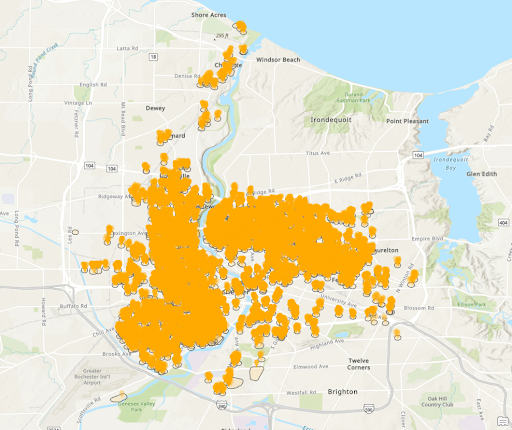
Crimes within 300ft of Vacant Structures 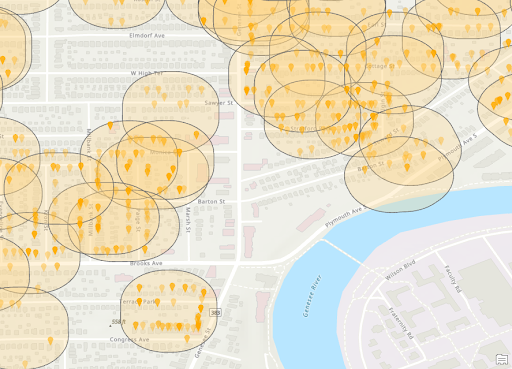
Zoomed Crimes in 300ft Buffer of Vacant Structures 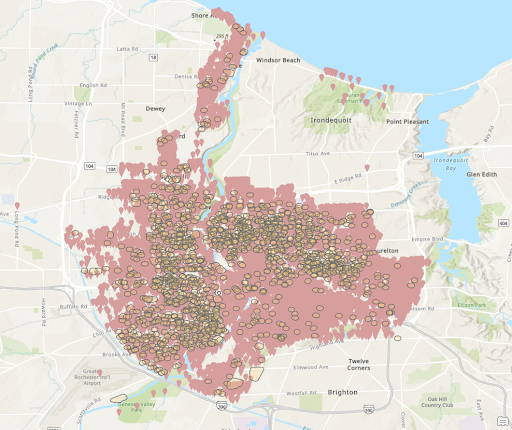
Crimes Outside 300ft Buffer of Vacant Structures 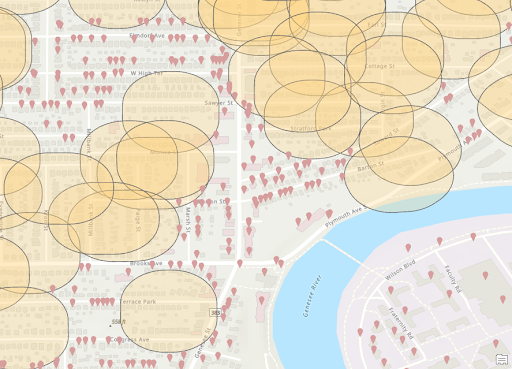
Zoomed Crimes Outside 300ft of Vacant Structures 
Store Heat Map Scale 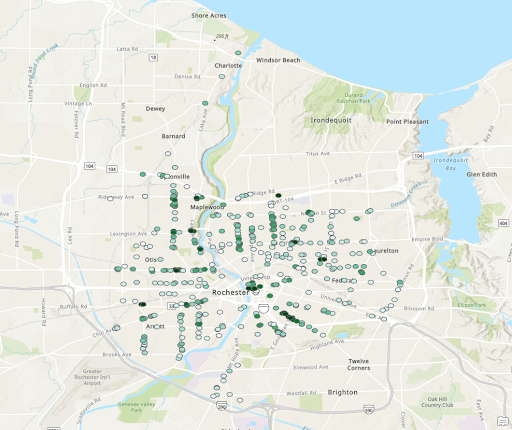
Heat Map of Crime Density for Stores 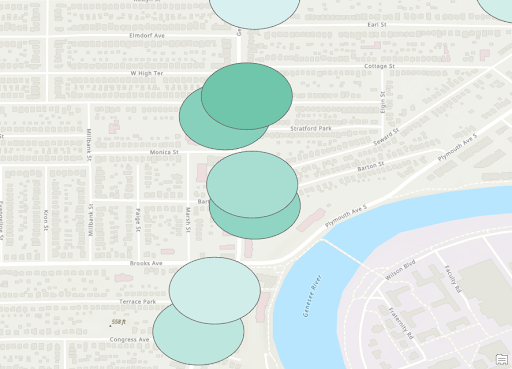
Zoomed Heat Map for Stores 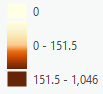
Vacant Structure Heat Map Scale 
Heat Map of Crime Density for Vacant Structures 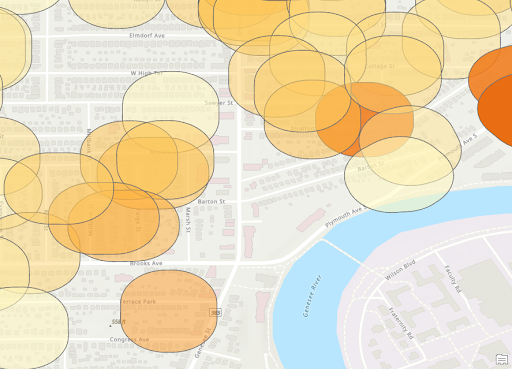
Zoomed Heat Map for Vacant Structures 
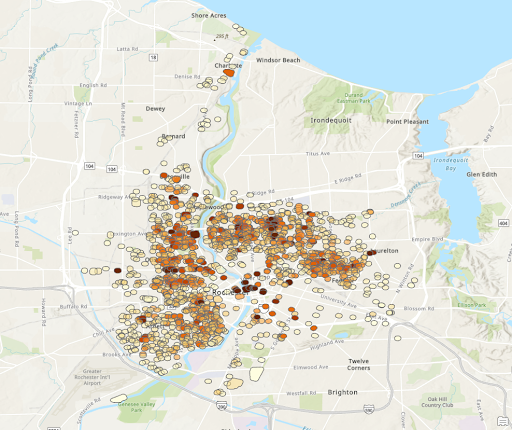
From the final 2 heat map shown again, it can be seen that there are certain areas that fit the same pattern. The area near the second ‘r’ in Rochester and just to the Northeast of there both are particularly dense in both maps. Then there are much lower densities around Blossom Road. This indicates the presences of stores or vacant structures may not be the reason for crimes but rather those are simply busier areas with more crimes. We can also see that most isolated locations of stores appear to have lower densities. This indicates the presence of an individual store may not be a large contributing indicator of more crime.
Feature Engineering
To start with our modeling, we needed to first create some custom features to get the best results. We downloaded the Census tract data as mentioned above, and pulled out what we thought would be relevant social and economic variables for determining crime rates. We also used the date set with our crime severity metric of the 3 levels of crimes. Larceny, Level 1 was the least severed followed by Level 2 and than 3 which was assault and murder. The model we planned to use was a weighted linear regression. We needed to determine the spatial resolution of our data and broke our spatial units down into the 229 block groups from the census data. All of the data for the stores was merged with census block data. Our goal was to use this information to determine the models ability to predict crimes with and without using the store data to see if they added any explanatory power.
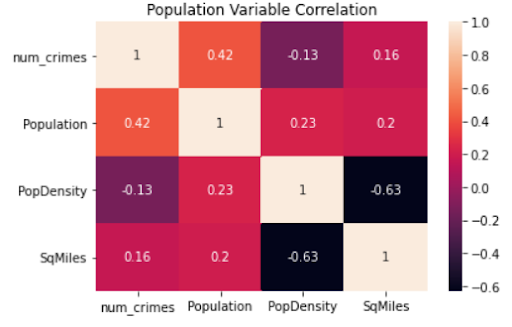
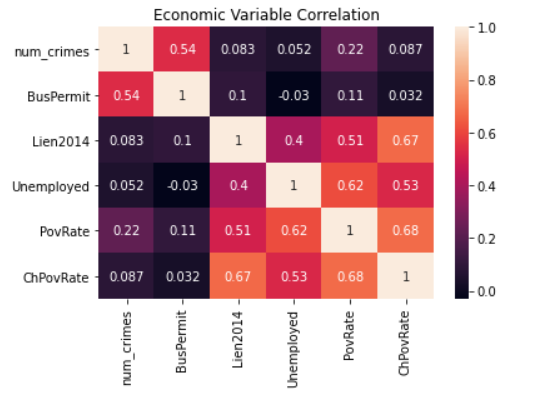
We first explored some of the feature correlations to determine what features might be useful in having explanatory power. From the correlation maps below, it is shown the number of crimes is most correlated with population, poverty rate, and existence of business permits (BusPermit).
Modeling
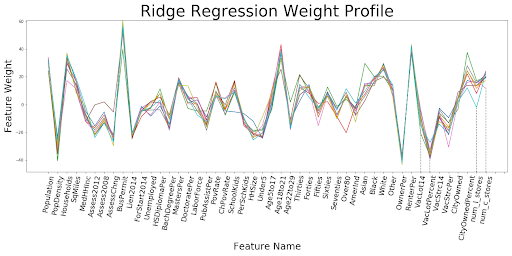
Setting up the model required a few more normalization steps. We decided to use a linear regression with L2 regularization. Every feature was normalized between [0,1] to account for additional weight being put on features with larger starting values. Null values were replaced with median values, and k=10 fold cross-validation was used. The goal was to predict crimes from 2014-15, the last year the census data was available. The way we aimed to determine if the presence of stores had an impact was to create 5 variations with the following as predictive variables:
- Just environmental factors
- Environmental factors and convenience stores
- Environmental factors and liquor stores
- Environmental factors and convenience and stores
- Just convenience and liquor stores
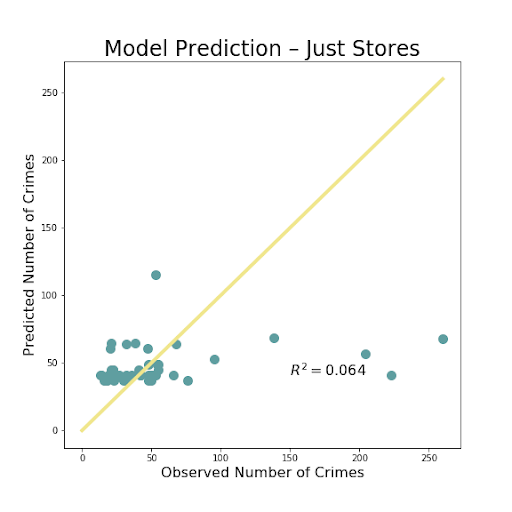
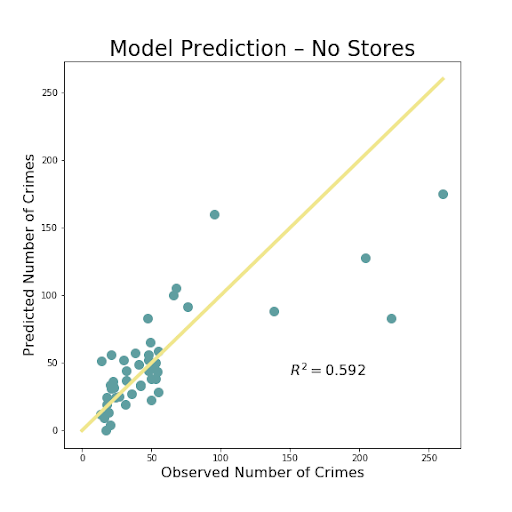
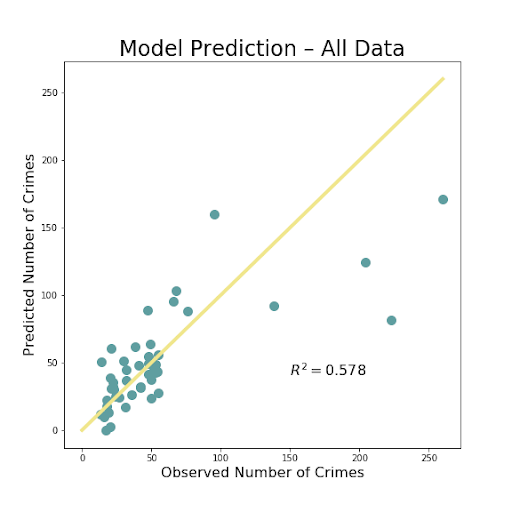
The above images so the resulting images of the most important iterations. There was very little difference between adding just one of the store types, so we decided to just use both liquor and convenience stores combined to show our results. The R^2 value shows the amount of variation explained by the model. That value is extremely low, less than .1, for just using the number of stores in a block group to predict amount of crime. The R^2 is much better, but not fantastic at .578 for using all of the available data, including the stores. The value is even slightly higher when the stores are removed, but not by a significant amount. This is likely just do to randomness of the model, but also some multicollinearity as the count of these stores are often correlated with several of the social and economic variables.
Finally, below we can see the results of the 5 models using our 10 cross validations broken down by crime category level. It is clear that models that only use stores perform the worst no matter the type of crime being predicted. In addition, the inclusion of the store variables has little to no impact of the overall ability of the model to predict.
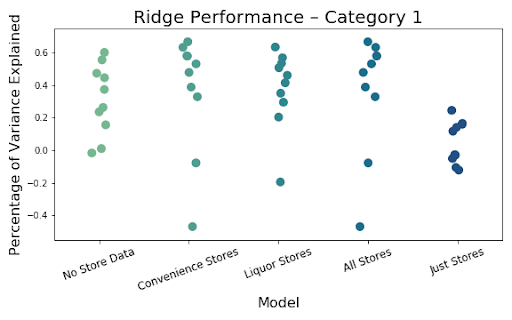
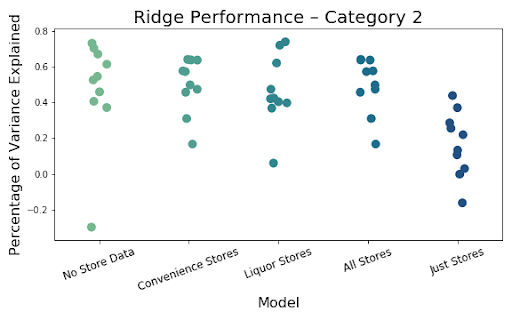
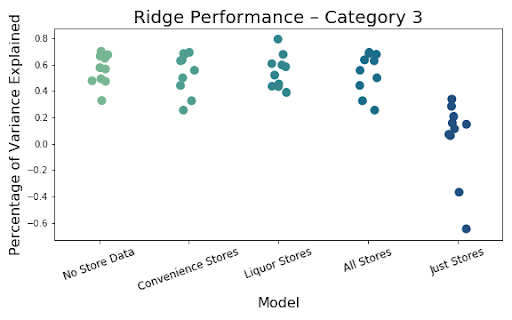
Adding convenience and liquor stores to our models have little effect on performance overall. This leads us to believe stores may just be proxies for crime as they did have some raw correlation. The model has decent explanatory power so we do not feel like it is just a bad model, but rather the addition of stores truly is not as impactful as other features, which seem to have greater impact.
Conclusion
While we all wish we could create a model and definitively say the presence of convenience or liquor stores or vacant land causes crime, we understand the issue at hand is far more complex. There are hundreds of reasons for crime to occur. Based on our exploration, visualization and modeling, we have little conclusive evidence that the existence of convenience and liquor stores impact the rates of part 1 crimes. While this may seem disappointing, it is actually a useful result. By finding no evidence, it can still help as a citation in policing policies. Often times these types of stores are thought to bring about crime as they can be a gathering place and easy target for criminals. We have now created supporting evidence that this does not seem to actually be the case, and it is more likely that there are other factors at play causing this criminal activity.
Acknowledgment
We would like to give a special thank you to Professor Fernandez for being our lead contact and meeting our group throughout the semester. We would also like to thank Kate May and Na Liu for letting us work on their project and providing great insights throughout the process as well as taking time to meet with us during their busy schedules.
References
Chattoraj, Ankani, Rupam Acharyya, Sabyasachi Shivkumar, Iftekar Tanveer, and Mohammad Rafayet Ali. “To Be or Not to Be? A Spatial Predictive Crime Model for Rochester.” (2020). Print.