Abstract
One of the main priorities for teams competing in the Baja SAE races is to design a car that will drive the fastest through any environment. A major contributor to speed reduction is aerodynamics. Teams need to find a way to reduce the drag caused by air slows on the vehicle with their design. The point of this project was to reduce the drag coefficient and the weight of the car with panels made of lighter and stronger materials.
Our Team


Mentor
Christopher Muir

Christine Pratt
Project Description
Problem Statement
The goal is to design body panels that are more aerodynamic and lighter. The problem with the current design is that both the front and rear panels are not in optimal aerodynamic shapes. Changing the geometry of these panels can reduce the drag and pressure near the rear of the car. At the same time, all the panels on the car are not manufactured with the optimal material to reduce the weight. Once the materials can be switched to a lighter one but with similar or even better strength, the performance of the car can be further improved.
Requirements
- New fairing composed of lightweight material – carbon fiber
- A more aerodynamic fairing design of the front footbox and rear panels
- The fairings must fit on the car
- A CFD simulation showing reduction in drag coefficient for the Baja SAE car
- The design of the faring must comply with SAE rules and safety regulations
Specifications
- The Baja SAE car needs to be 20% lighter than existing body panels
- The Baja SAE car needs to produce 15% less drag
Concepts
*don’t change image sizes, they look normal in preview lol
Front Design
The design idea originates from streamline and airfoil shape concepts in fluid dynamics. The design is expected to have a smooth curved front with a relatively larger radius of curvature near the bottom such that the air flows underneath will have a smooth transition from the front to the body of the car. The design can either leave the tow point outside of the panels or cover the entire front footbox frame with a removable tow point cover to comply with the competition rules. The front panels will be designed to be easily removable for the convenience of the crew in daily maintenance. The designs are based on the Baja team’s frame for 2022.
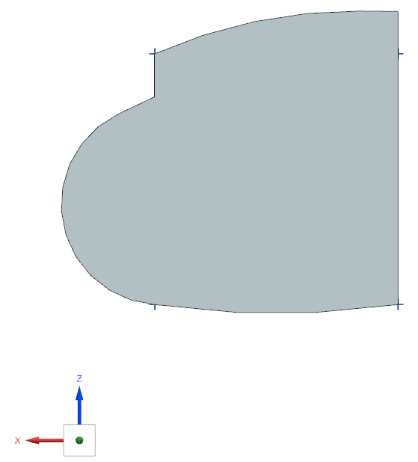
The first design (Fig. 1) is based on the frame shape of the car, leaving the tow point outside of the panels. The design has a drag coefficient of 0.975 from simulation.
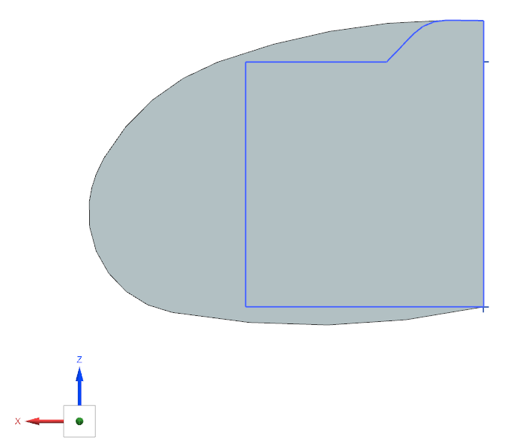
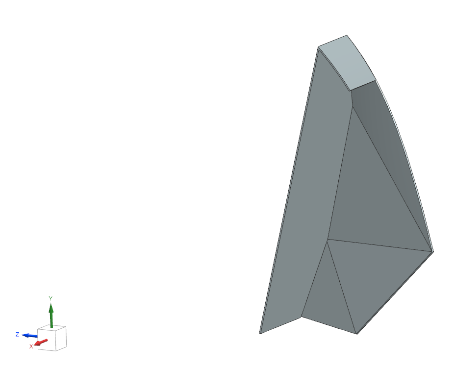
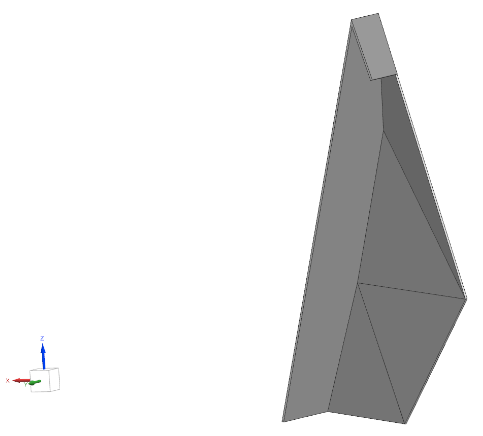
The second design (Fig. 2) fully utilizes the idea of streamline and airfoil shape. It covers the tow point entirely, so it has a removable tow point cover, which adds to the complexity in manufacturing. At the same time, it has a lot of room in front of the frame (the frame contour is shown in Fig. 3 with blue lines). However, it has a drag coefficient of 0.805 from simulation, which is lower than the first design.
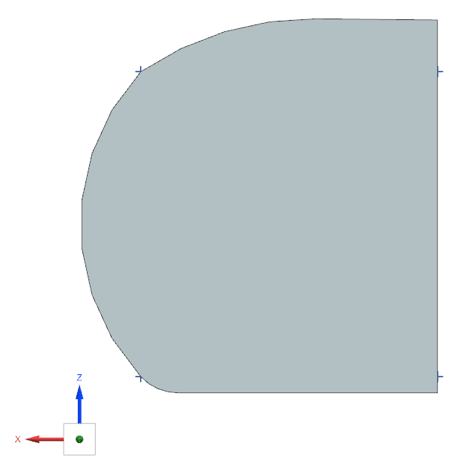
The third design (Fig. 3) is based on the second design with an attempt to reduce the room in front of the frame. It kept the top radius of curvature, but the bottom had to be modified to fit the frame. The drag coefficient from the simulation is 1.073.
| Criterion | Base Case | Design 1 | Design 2 | Design 3 |
| Manufacture | Baseline | – | – | – |
| Drag Coefficient Reduction | Baseline | + | + | – |
| Installation and maintenance | Baseline | – | + | + |
| Total | Baseline | -1 | +1 | -1 |
To find the optimal design of the three, a Pugh matrix was used. From Table. 1, it is obvious that design 2 is the optimal design given the criteria. Also, according to the specifications, only the second design can achieve a drag coefficient reduction of 15% based on simulation results.
Rear Design
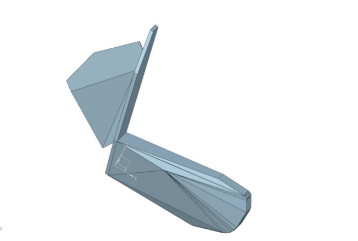
The rear panel concepts were mostly based around trying to allow the air to move around the back of the car more smoothly. The first concept design shown in Fig. 4 covered part of the back frame so that the air flowing past the car wouldn’t interfere as much with the firewall’s differences in pressure.
The second concept design shown in Fig. 5 included more rounded edge for better air flow, more area covered by material, and a top panel. This design resulted in a better drag coefficient than the first concept design but would have been much harder to manufacture.
The third design shown in Fig. 6 that was used for manufacturing and testing was very similar to the second design but was comprised of only straight edges to make them easier to create.
| Criterion | Base Case | Design 1 | Design 2 | Design 3 |
| Ease of Manufacture | Baseline | + | – | + |
| Drag Coefficient Reduction | Baseline | – | + | + |
| Ease of Installation | Baseline | – | – | – |
| Total | Baseline | -1 | -1 | +2 |
A Pugh matrix (Table. 2) was created to distinguish the positives and negatives of the rear designs compared to the base design of just the firewall. These results made it clear that the third design was the best option for the rear panel design since it was easier to manufacture and install than the second design and had a lower drag coefficient than the first design.
Analysis
Front Design
In the CFD analysis, the geometries used for both base and design simulations as the fluid domain have a dimension of 210x100x50 inches. The fluid used was air in both cases. The mesh was TET 10 of element size 1 inch with max growth rate 1.3. Boundary layers were implemented on the surfaces of the design with 5 layers and a growth rate of 0.25 inches. Face meshing of 0.5 inches was also implemented on these surfaces. In simulation setup, a moving wall boundary condition was implemented at the bottom face of the flow domain to make the simulation more realistic, with the model being stationary while the air and ground were moving at a velocity of 7 mi/hr.
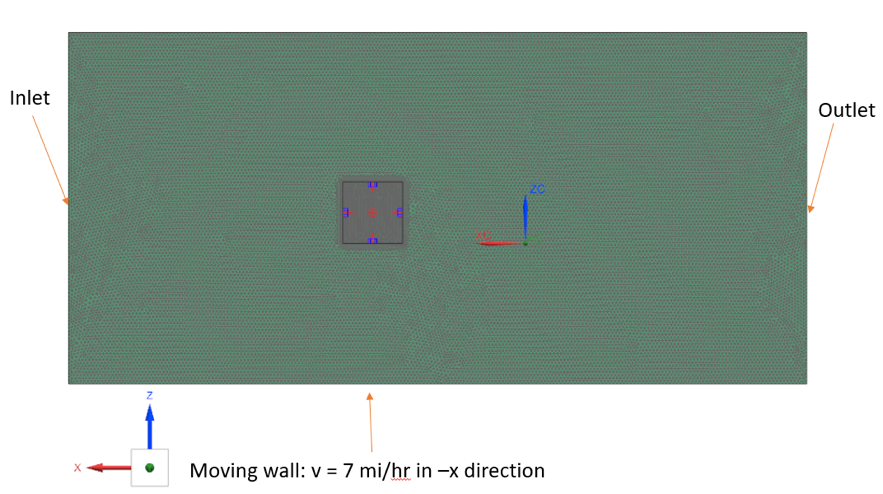
For the base case simulation, the boundary conditions are marked in Fig. 8. The final mesh has 2524242 elements and 3540955 nodes. The solution was set up using the SA turbulence model. The inlet velocity and the moving ground velocity were both 7 mi/hr in negative x direction. The outlet was open, and the fluid used in this simulation was air. The smooth with friction wall function was used for calculation. The iteration was set to complete at a max residual of 2e-5. The lift & drag report was used to obtain the drag coefficient, and the area used was 109.375 in2, and the length was 17 inches.
The simulation results were shown in Fig. 9 and Fig. 10. The drag coefficient was 1.002.
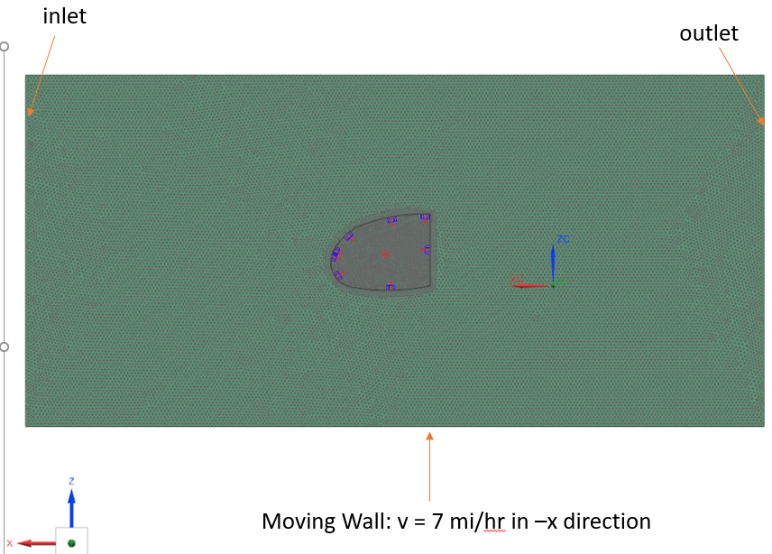
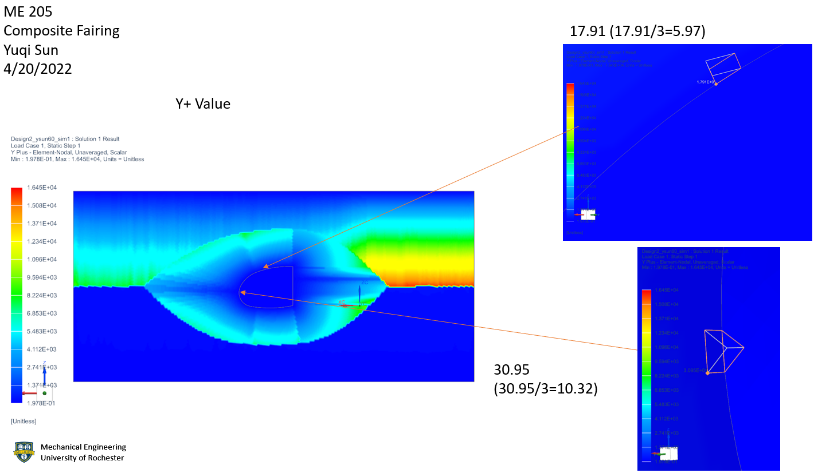
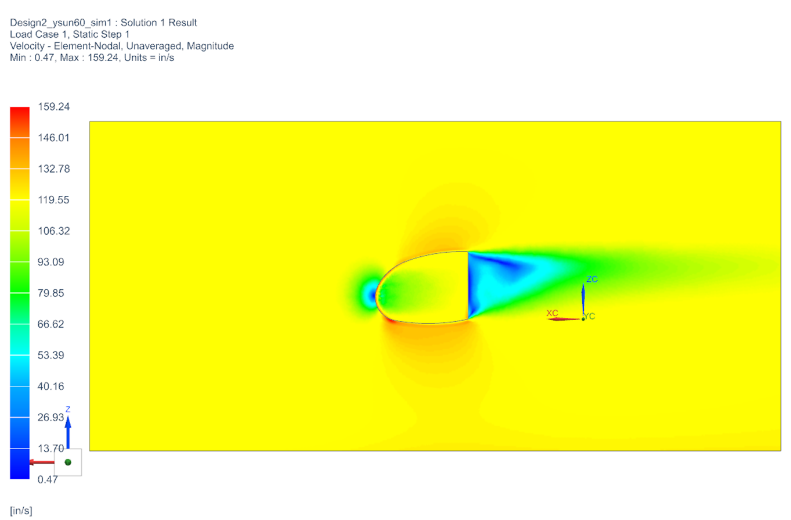
For the final design simulation, the boundary conditions are marked in Fig. 11. The final mesh had 2581802 elements and 3621566 nodes. The solution was set up using the SA turbulence model. The inlet velocity and the moving ground velocity were both 7 mi/hr in negative x direction. The outlet was open, and the fluid used in this simulation was air. The smooth with friction wall function was used for calculation. The iteration was set to complete at a max residual of 2e-5. The lift & drag report was used to obtain the drag coefficient, and the area used was 109.375 in2, and the length was 22 inches.
The simulation results were shown in Fig. 11 and Fig. 12. The drag coefficient was 0.805.
Rear Design
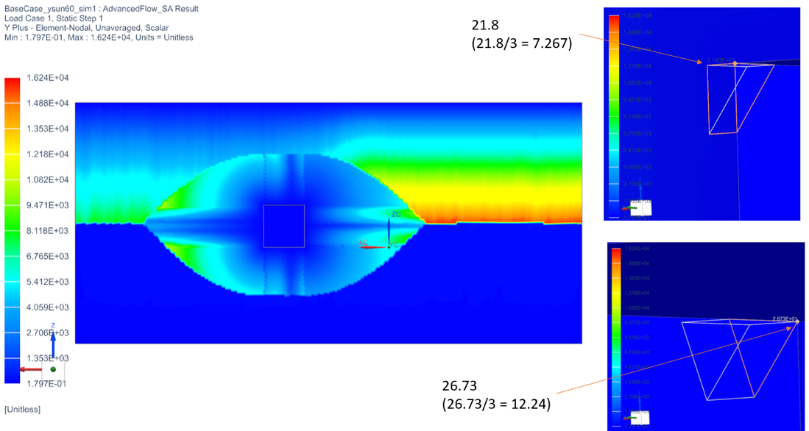
The rear panel CFD analysis used a fluid domain volume of 175x145x41.5 inches. The mesh (Fig. 12) was a TET 4 with an element size of 1 inch and a growth rate of 1.1. The boundary layers at the surfaces of the design mesh had 6 layers with a growth rate of 0.15 inches. There was face meshing of 0.5 inches on the surfaces as well.
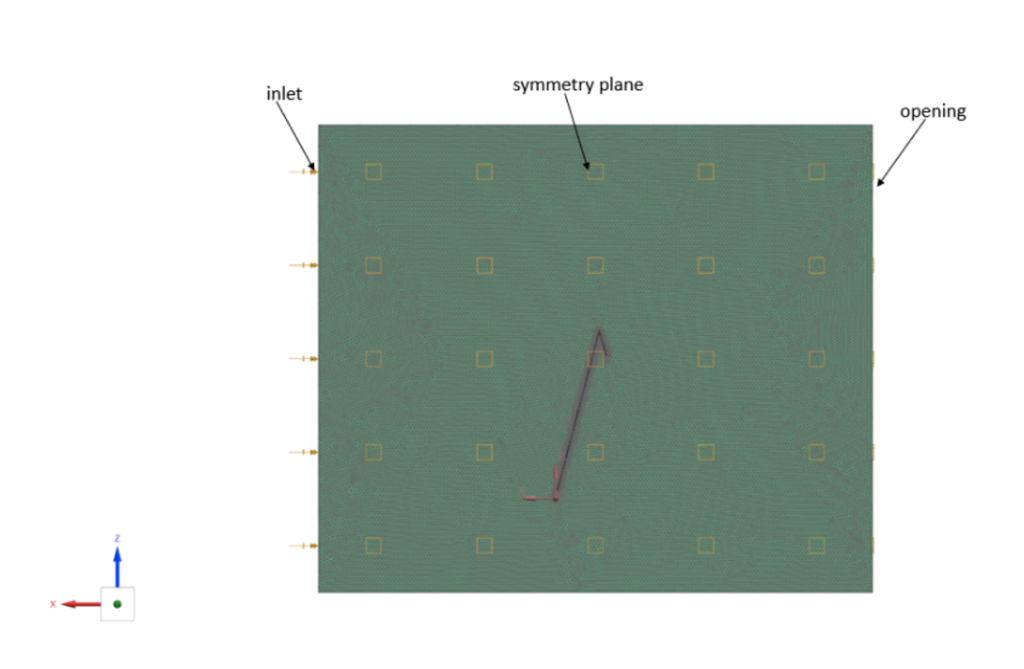
The solution used a SA turbulence model for analysis. The velocity at the inlet was 7 mi/hr in the negative x direction. Air was used to simulate the drag on the design. A lift and drag report were used to analyze the results with the drag in the negative x direction and lift in the positive z direction.
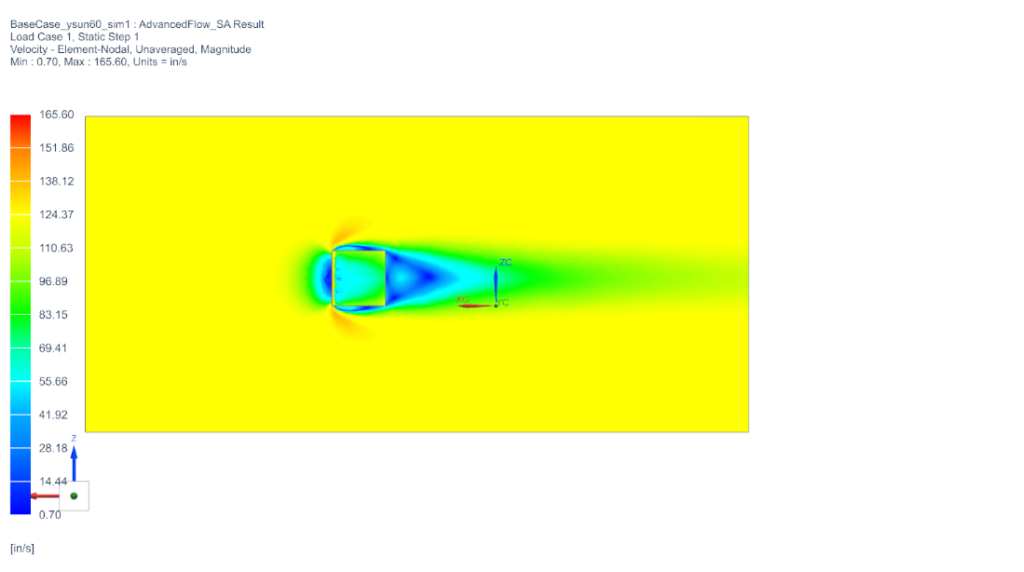
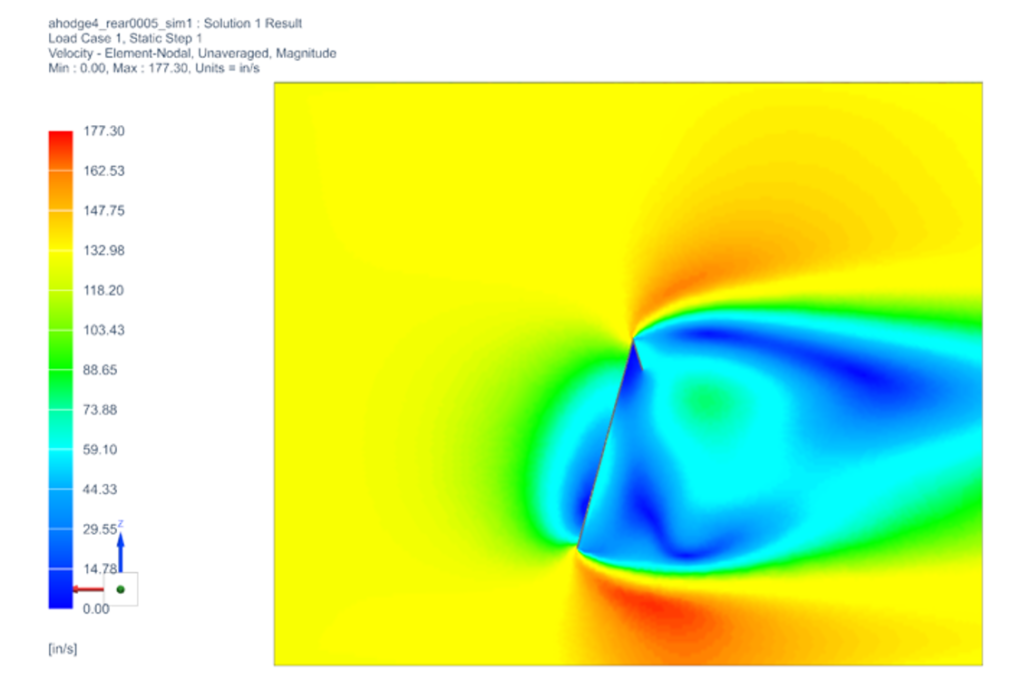
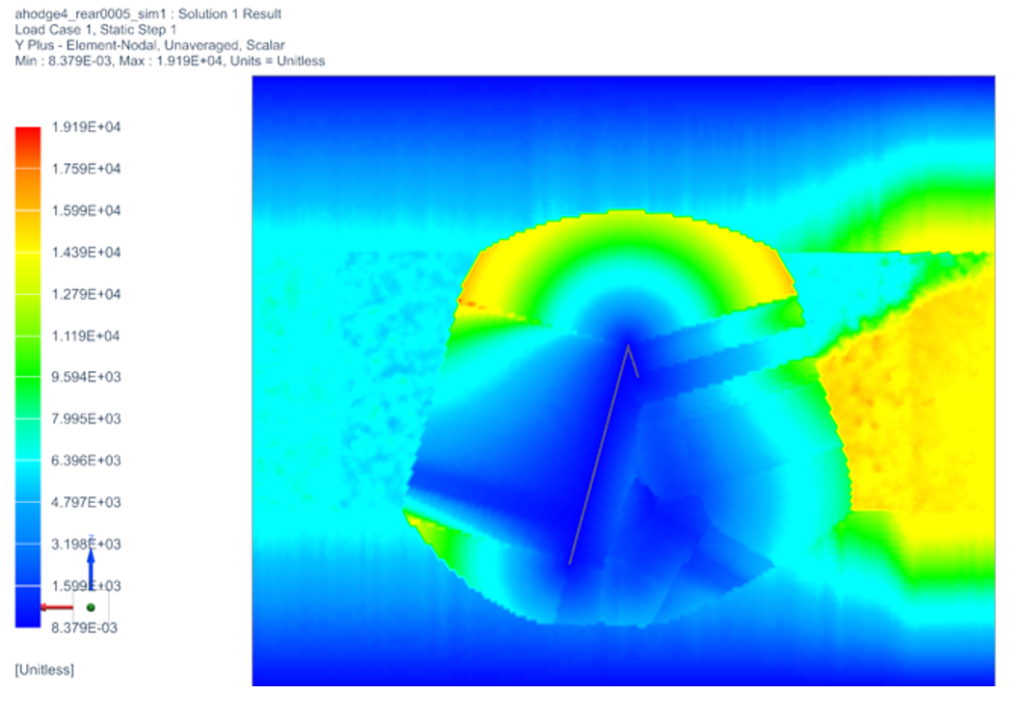
The velocity and Y+ results of the simulation were shown in Fig. 13 and Fig. 14, respectively. The final drag magnitude was 43.3 while the drag magnitude for the design with only the firewall was 45.5 which was a reduction of about 4.83%.
Manufacturing
*don’t change image sizes, they look normal in preview lol
The manufacturing of the parts was split up into two segments, manufacturing of the front panels and manufacturing of the rear panels.
Front Panels
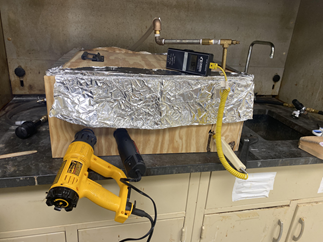
The front panels were designed to be curvy in shape and as such we required a method that could create this curved shape with relative ease. Composite layup was used for this as we were able to create curved shaped panels with Carbon fiber. As there are two ways to do composite layup, we chose to use prepreg sheets as opposed to prepare the carbon fiber sheets ourselves with resin epoxy. Prepreg carbon fiber sheets however need to get up to 154 degrees Celsius to cure and as such we required a large furnace. As there was not a large enough furnace accessible to us, we created one ourselves from plywood lined with Aluminum foil. Two heat guns were used as the heat source and a thermocouple was used to ensure that the temperature of the furnace stays within the required range for this process.
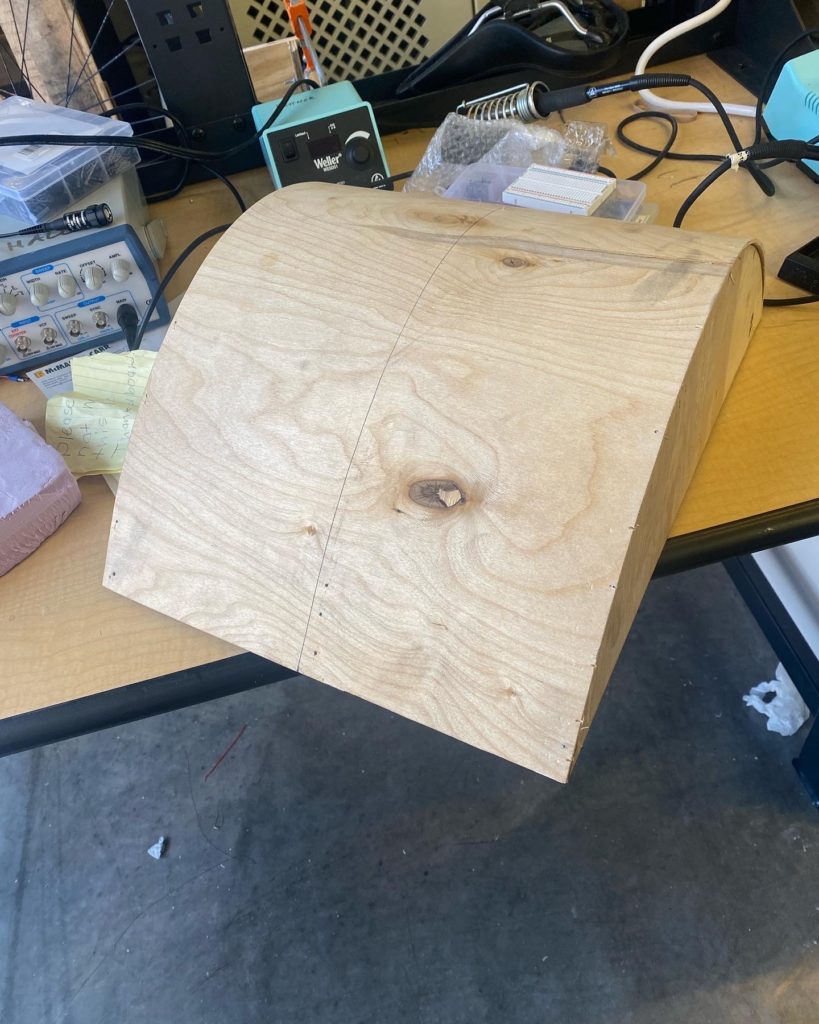
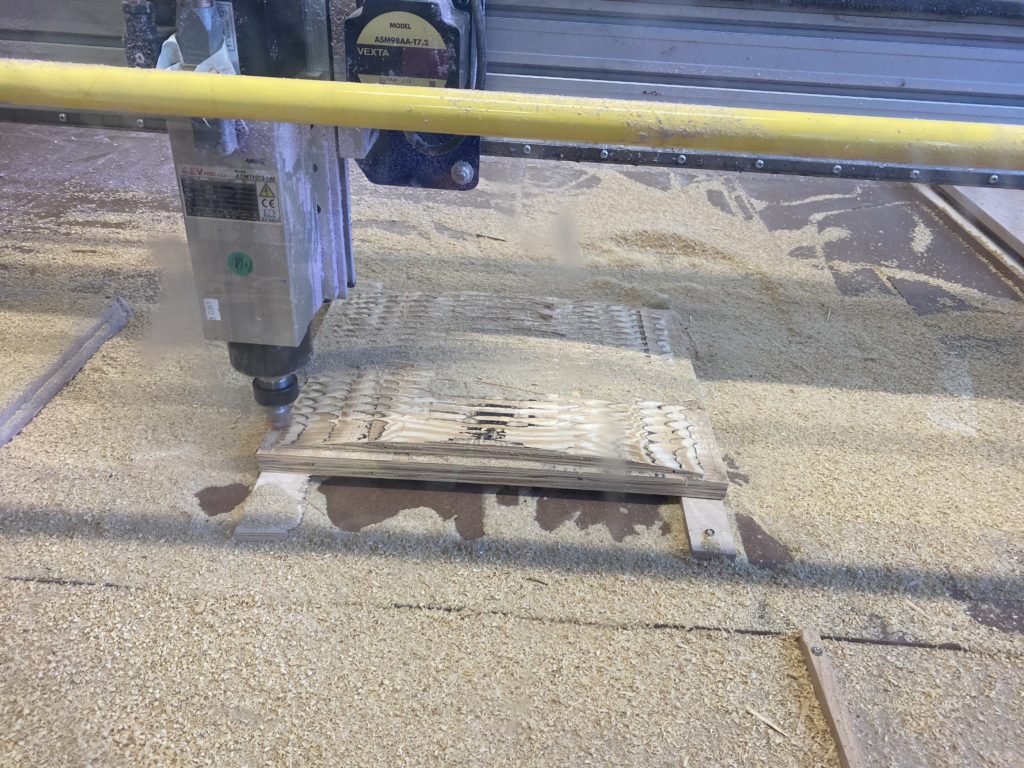
For the mold for the composite layup, the initial plan was to use the CNC machine to cut all required molds from foam. Foam is a cheap material that is very lightweight. This plan was however thwarted because foam burns in excess heat and as such, we switched our stock material to wood. Wood is also a cheap material that is easily shaped. The hood mold was cut from stacked up plywood using the CNC machine. But as for the beak, that stock would have been too heavy and as such this mold was created by laser cutting the side profiles of the mold and wrapping it with plywood. This created a hollowed-out mold that fulfilled the thermal requirements.
After testing our furnace setup and our prepreg composite. A five-layer composite layup was agreed upon as this was an ideal thickness of close to 0.03 in. With the help of Miss Christine Pratt, we were able to properly prepare the composite layup by
- applying wax as a releasing agent to the mold.
- Applying a breathing cloth over the layup and placing the entire setup in a vacuum sealable bag.
- applying alternating horizontal and vertical prepreg sheets carefully over the mold
- Placing the bag in the furnace and connecting the vacuum to the bag
After all steps were taken to setup, we turned the heat sources on so that the temperature in the furnace slowly gets to 154 degrees Celsius, the heat sources were switched on and off so that the furnace would not get too hot or lose too much heat. After an hour, the heat sources were turned off and the layup was set to cool slowly.
This was repeated for all the different molds created so that we have solid composites for all the segments of the front panel designs.
This method of mold creation was used as it is less expensive than alternate methods of say 3D printing such large composites. It was also the most practical as wood can withstand the temperatures needed for the curation of prepreg sheets.
Rear Panels
The rear panels were designed to be flat and as such the requirement of composite layup was not necessary as we were able to acquire flat carbon fiber sheets at 0.03in thickness. The rear panels were created by cutting the shape of each panel from Carbon fiber sheets using a Dremel tool with a tungsten Carbide blade. The outlines were created by laser cutting the sheets from cardboard as cardboard is an inexpensive material. These cardboard outlines were used to sketch the panels on the carbon fiber sheets before cutting them with the carbide blades.
Scaled down versions
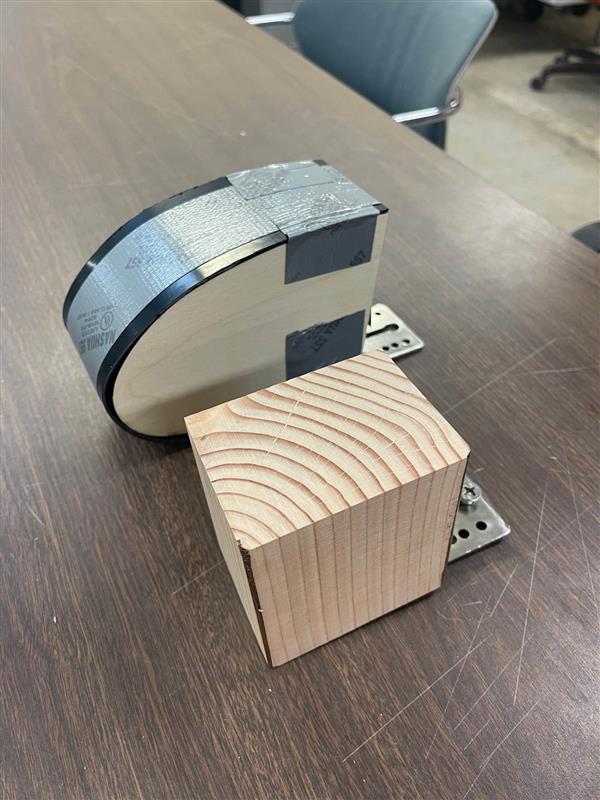
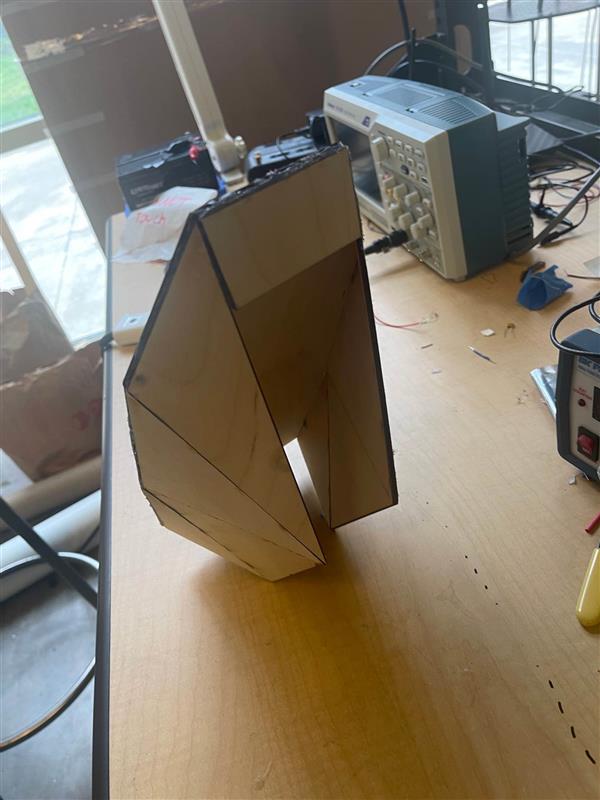
Scaled down versions of our designs were created for testing in the wind tunnel, the scale was at 5:1 ratio. For the front panel, it was created by laser cutting the side profile and wrapping it with a thin bendable plastic. For the rear panels, each individual panel was cut using the laser cutter and then they were all assembled with glue. Laser cutting was chosen as the method as they provide accurate cuts to provide a model as close to our design as possible. These were created from thin plywood as wood was available for free and the shape of the design was the only thing being considered. Wood is also able to withstand all the drag force applied without failure.
Cost of Manufacturing of System
As the raw material used for the manufacturing of the front molds were used based on materials that were already available, the cost on websites such as Fiberglas will be used as opposed to what was spent. The total cost of manufacture for the entire product was approximately $7694
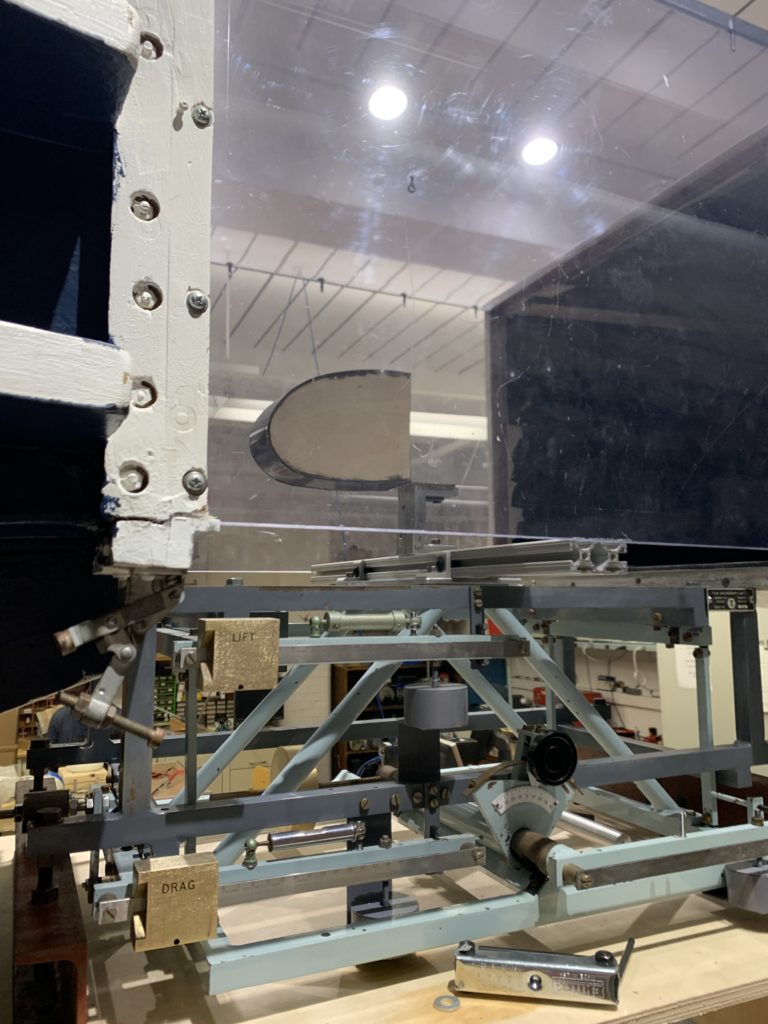
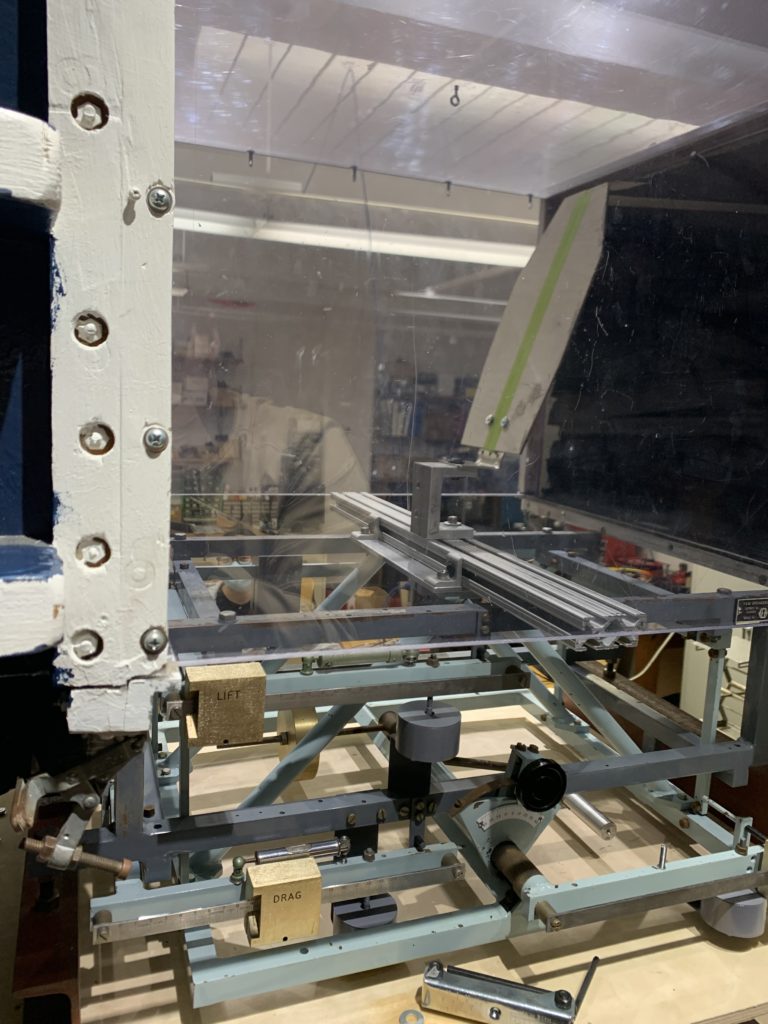
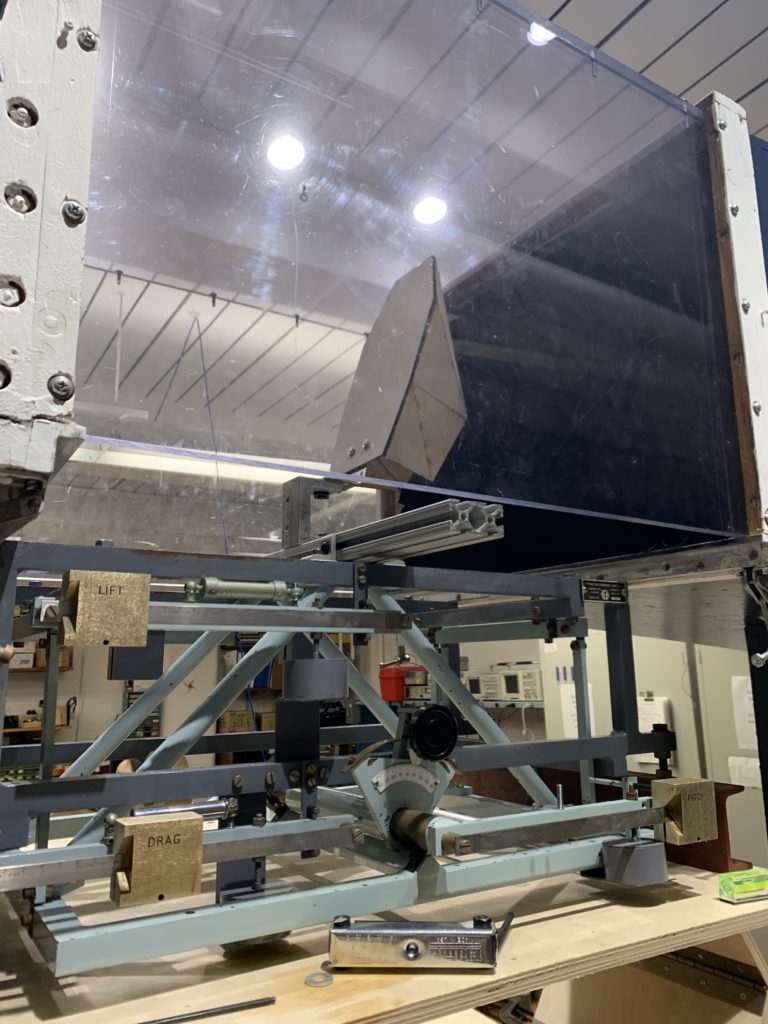
Testing
Wind-tunnel testing was conducted to verify the results from numerical method. The base design, rear panel design and front panel design were all scaled down in a 5 to 1 ratio to fit into the wind-tunnel. The wind-tunnel speed was set to be 35 miles per hour to match the Reynolds number of the testing and simulation and it also means the wind-tunnel power output was set to be 32% of the total power output according to the conversion chart of wind-tunnel in Fig. A7.
| Front Panel Design Drag Force | Rear Panel Design Drag Force | |
| Base Design (Fbase) | 0.6704 N | 7.439 N |
| New Design (Fnew) | 0.4987 N | 7.071 N |
| Drag Reduction% | 25.61% | 4.947% |