Results
1. TLC Results
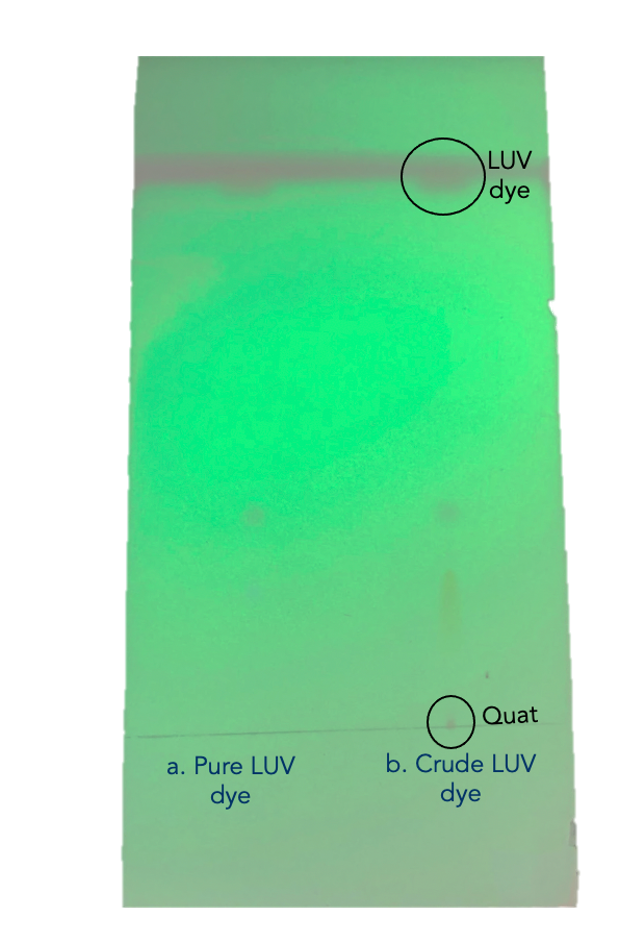
Two main factors were tested on TLC plates by measuring Rf values as a separation response between the LUV dye and its impurities: 1) the concentration of crude dye, 2) solvent used.
First, the concentration of crude dye was a main focus due to the high viscosity of the crude dye which increases the tailing effect in an adsorption system. This was seen in last year’s senior design team results and was optimized this year by diluting the dye with the solvent chosen for the mobile phase. Concentration experiments concluded that a concentration of 1:50 ~ 1:10 (crude dye:solvent) minimized tailing, and better displayed the impurities in the TLC plates.
Second, after testing various solvents as mobile phases, dichloromethane (DCM) demonstrated the ideal separation between the dye and the impurity on a silica TLC plate. It was suspected that Quat impurity would fix at the baseline and the dye would move with the solvent front, as shown in figure 3. Initial TLC results have shown a streaking/tailing effect in the TLC spots, which was addressed by the addition of a few drops of ammonium hydroxide to the developing solvent (DCM) to increase the basicity of silica TLC plates. DCM was further tested as a solvent in alumina (basic and neutral) TLC plates to test the absorbance of LUV dye’s impurities in other adsorbent materials.
2. Pipette Column Results
Using the pipette column experiment as a prototype was necessary to test the different adsorbent materials in a column chromatography rather than a planer chromatography (TLC). The prototype columns were built using a glass pipette as a column as shown in Figure 4. The experimental trial involved running columns packed with 1) silica, 2) alumina, 3) silica and alumina separated by a layer of sand. Consistent with TLC results, a concentration of 1:50 of dye to solvent was used to load the pipette columns.
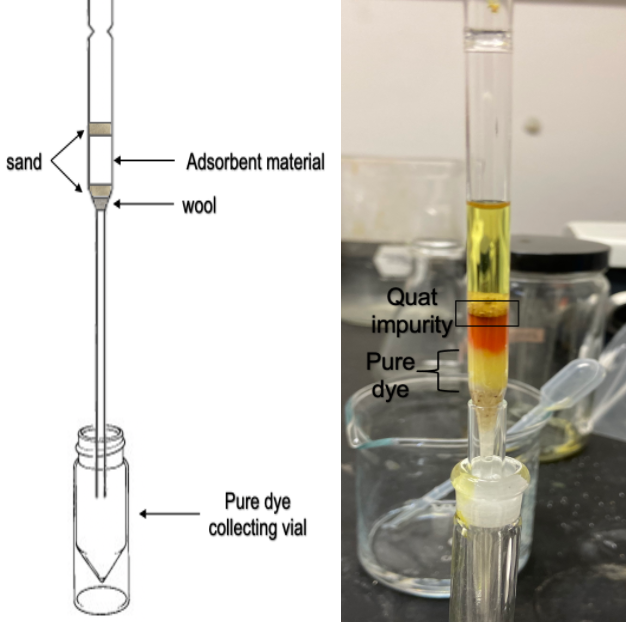
Visual examination of the prototype columns showed a red band formed at the top of the adsorbent material, indicating that Quat was successfully adsorbed to the column. The eluted samples from both silica and alumina pipette columns have undergone analytical methods (UV-Vis and GC-FID) to chemically characterize the purity of eluted solution.
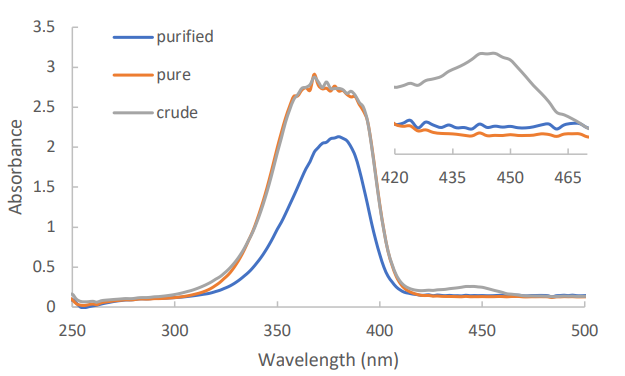
Figure 5 shows the absence of the Quat peak at approximately 445 nm in a dye sample purified using silica pipette column. Further UV-Vis and GC analysis was done on samples purified using alumina adsorbent. Concentration of dihexylamine impurity in all purified samples have been under the specification limits of <0.1% as shown in table 2. The quat concentration of both silica and silica+alumina was under the specification limit of 0.1 area%, except for the alumina sample. This is suspected to occur due to the higher Rf values of quat in an alumina adsorbent.
| Parameter | Crude LUV dye | Silica | Alumina | Silica+alumina |
| GC Assay | 97.7% | 99.4% | 99.8% | 99.7% |
| Sulfanominde | 0.7% | 0.5% | <0.1% | 0.1% |
| Dihexylamine | 0.4% | <0.1% | <0.1% | <0.1% |
| Any other peak | 0.007 | <0.1% | <0.1% | <0.1% |
| UV Assay | 92.0% | ND | ND | ND |
| Quatpropylamine | 3.40% | 0.0011% | 0.12% | 0.049% |
From the results above, silica was chosen as the best adsorbent as it resulted in impurity concentrations under the specification set by Kodak, and it was used to construct the bigger burette columns.
Using pipette columns allowed for the initial visualization of the movement of dye and impurities in the column. Most importantly, they allowed for the investigation of purity response of eluted purified dye using small amounts of the stationary and mobile phases, which contributed to minimizing the team’s budget costs.
3. Burette Column Results
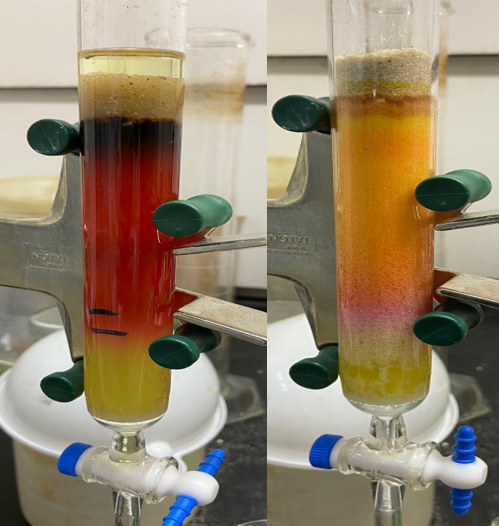
Based on the prototype column, it was determined that the yellow band is the pure LUV dye. The burette columns were then designed to prevent the impurities orange and red colored bands in the column from eluting out of the column as the column is being loaded with crude dye and mobile phase. This is done by determining the appropriate ratio of packed silica to the amount of loaded solution (mass of silica: volume of added solution) that minimizes unused bed space, and prevents impurities from eluting. Experiments involved fixing the mass of silica while increasing the amount of loaded crude solution and resulted in a ratio of 2.5g silica: 2mL 10w% crude in DCM.
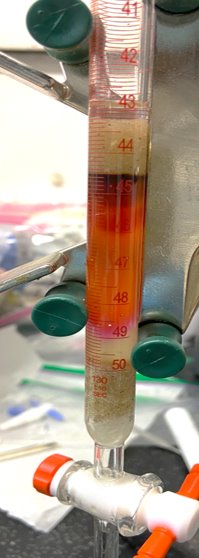
The column in figure 7 demonstrates the quat impurity forming a dark red bad and fixing at the top of the column. This band did not move down the column as DCM was added to push the dye out of the column, which is an ideal scenario in order to prevent the quat impurity from eluting.
It was suspected that the orange band corresponds to the colored streak shown the TLC results shown in figure 3. Similarly, the pink band in the column corresponds to the spot on top of the yellow streak in the TLC plate.
Because the main goal of the project was to upscale the column, it was necessary to perform an up-scale experiment to test the linearity of the yield. 16 mL of 10w% crude dye DCM solution was added to a larger column with 20 g of silica 60. Figure 8 shows the larger column constructed using the same ratio of silica to crude solution loaded determined in the small burette column. The pink/orange band did not elute with the combination and an additional 5 mL of crude dye solution was added, and the pink/orange did not elute still.
Because the identity of the orange and pink bands are unknown, the dried silica in the column was separated by color to analyze their chemical composition as part of the future work of this project.
| Column Type | msilica | mcrude, initial | mcrude, final | Yield % |
| Burette column | 2.5 | 0.253 | 0.174 | 69 |
| Larger burette | 20 | 2.025 | 1.478 | 73 |
The yield of the collected pure dye was approximately similar in both columns, which indicates proportionality of both columns. The yield in both columns is suspected to increase as more DCM is used to push the dye out of the column.
4. Scale-Up Specifications
The eluted purified dye from the previous large column experiment was sent to Kodak for analysis. Table 4 shows the chemical composition of the sample with all the impurity concentrations under specification. This indicates the purification method has successfully purified crude dye to meet Kodak’s requirements.
| Chemical | Unit of Measurement (UoM) |
| LUV dye | 99.8 Area% |
| Dihexylamine | <0.1 Area% |
| CAS 68-34-8 | 0.1 Area% |
| Any other peaks | <0.1 Area% |
| Quat-propylamine | Non-detectable <0.0008 w% |
From the previous large column experiment, it was found that at least 21 mL of 10w% crude dye could be purified using 20 g of silica with a yield of about 70%. Using an experimentally determined crude dye solution density (1.31 g/mL), it was found that about 10 g of silica was needed to yield 1 g of purified dye. Since Kodak would need to purify 2 kg/day. This means 20 kg of silica 60 would need to be consumed per day. Since the silica slurry density largely depends on how well the bed was packed, a column from 25 L to 100 L volume might be needed. It is suggested that Kodak first purchase/make a 25 L glass cylinder and test out how much silica slurry it could contain.
Furthermore, an estimated amount of 70 L of DCM solvent was needed to purify 2 kg of LUV dye. However, DCM could be recycled by distilling the solvent from the eluate purified dye solution. Therefore, the actually amount of DCM solvent needed depends on how Kodak would run the distillation process. In addition, Kodak could recycle the DCM each day.
To summarize, about 20 kg Geduran Si 60 (0.063- 0.200 mm), a 25 L glass column and less then 70 L of DCM was needed per day to produce 2 kg of purified LUV dye. Since both glass column and DCM could be reused for each cycle of process, the major cost for Kodak comes from the disposable silica gel. 400 kg of silica cost about 6500$ so $325 is needed per day and $163 is needed to produce 1 kg of purify LUV dye. This cost was significantly lower than the current cost of >1000$/kg using WFE. It is also recommended that Kodak pretreat the silica gel by mildly heating it to remove the potential moisture, which can limit the silica adsorption effiency.