Team Members
Faner Lin
Shuaidong Pan
Yi Yao
Qianyi Li
We are senior students majoring in Data Science.
Supervisors
Ajay Anand, Pedro Fernandez
Department of Data Science, UR
Customers
Robert Wray, Adam Swift, Christopher Dobson
Regional Transit Service (RTS)
Background
RTS is a regional transportation authority established by New York State with more than 900 employees. It is recognized as one of the best-ran transit systems in the nation. It serves customers in Monroe, Genesee, Livingston, Ontario, Orleans, Seneca, Wayne, and Wyoming counties. In this project, we intended to find the major reasons for preventable accidents caused by bus operators as they led to unnecessary injuries and damage.
First, descriptive and exploratory analysis is performed on all the data provided and driver-related variables and environmental-related variables. Then, frequent pattern mining is applied and conditional probabilities are calculated for the accident history of operators with high risk of accidents to extract accident patterns.
Project Goals
Identify root causes of preventable accidents, and generate effective actions to reduce future preventable accidents
Methodologies
1. Perform descriptive statistics and exploratory analysis on all the tables available.
2. Merge data tables and perform feature engineering, including comprehensive exploratory analysis
3. Identify driver-related variables and environmental-related variables that could be root issues for preventable accidents
Descriptions of Dataset
Accident Data
This dataset contains 20 fields and 1314 rows. It provides detailed information about the accident. The fields are accident date, operator ID, accident type code description, accident subtype code description, accident type, Baitfish code, file number, accident preventable/non-preventable, retraining, retraining date, bus number, vehicle makes, vehicle year, driver’s age, driver’s gender, roadway, roadway light conditions, roadway weather, roadway surface and accident location and accident neighborhood.
Schedule Data
This dataset contains 13 fields and 4580 rows. It provides detailed information about the operators’ schedules. The operators can choose two days a week as day-off. The operators with high seniority (join the company early) will have priority in choosing their schedules. The schedule changes every 3 months. There are four turns in a year with each turn starting on January, April, June, September. The dataset contains the effective date for the schedule, seniority date, operator ID, and information about when the operator would like to choose as their day-off for each operator. It also includes the work type for each operator for each turn. There is a total of four different types of work. They are regular, parttime, extra board, and relief.
It is worth noticing that not all the operators in the accident data appear in the schedule data. The schedule data only contains the schedule information for operators/drivers who drives the buses on the street. RTS also has technicians that move the buses in the RTS parking lot or drive the bus for maintenance and cleaning after the general operating hours. In this project, due to the difference in working schedule and job nature, we separate the operators as drivers and technicians and provide analysis and results for both of them.
Absence Data
This dataset contains 6 fields and 36883 rows. It provides detailed information about when the operators take an absence. There are seven kinds of absences. They are absent, worked day off, vacation, holidays, excused, medical, and late to work. The data contains the operator ID, type of absence and exact date and time for every absence.
Data Preprocessing
First, we will introduce our data preprocessing procedure. As stated in the above section, we have three main tables, since there is no obvious missing values in the major columns that we are exploring, so there is no need for filling out missing values. However, we have identified a few data inconsistencies, for instance, there are retrained columns (boolean value) and retrained date, some drivers have retrained date but the retrained columns are False, so we manually corrected those. Moreover, it is worth mentioning that there are 470 operator IDs in the accident table, but only 421 operator IDs in the schedule table. After communicating with RTS sponsors, we found that those missing operator IDs belong to the technicians who mainly worked near the garage.
Exploratory Analysis
Since our project mainly focuses on exploratory and statistical analysis and not on predictive analysis, we have performed a comprehensive exploratory analysis of different driver-related and environmental-related variables throughout different milestones and presentations, and a large number of figures and images are generated. It is inefficient and redundant for us to introduce and explain every single finding, so we selected the most important and significant ones.
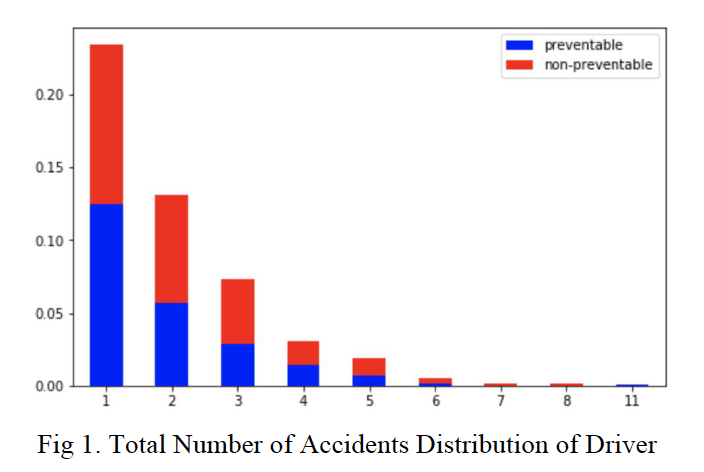
Number of Accidents Distribution for Drivers
We see from the distribution that most drivers have the total number of accidents less than 3. But there are also drivers have the number of accidents as high as 11. Drivers with recurrent accidents are the ones that we need to pay attention to.
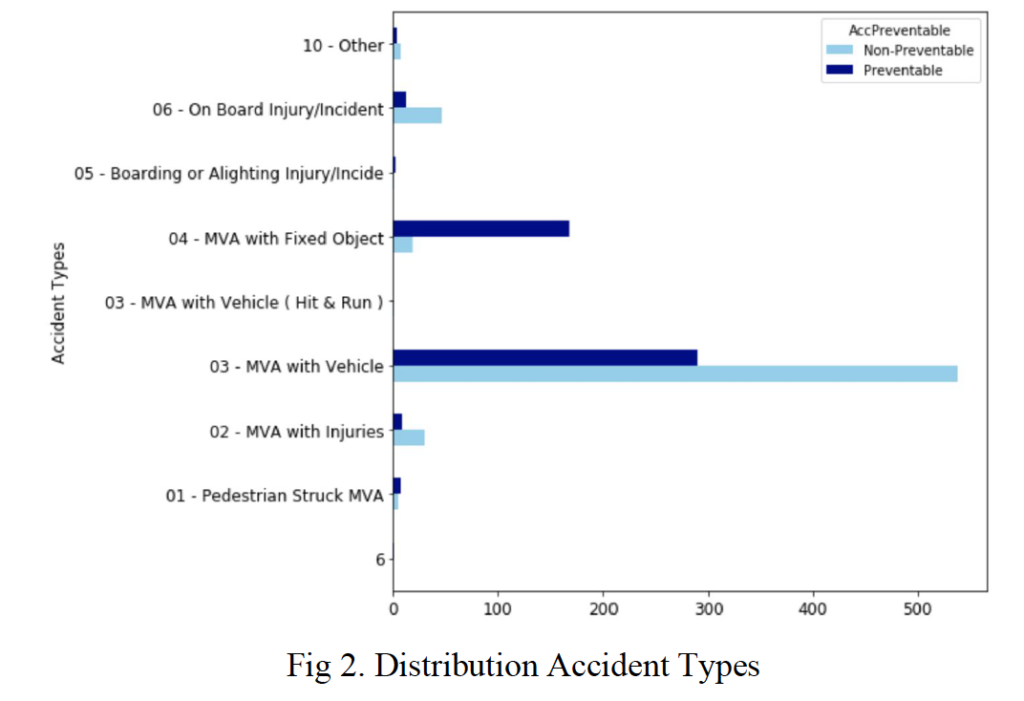
Distribution of Accident Types
We could see from the accident types distribution that most frequent accident types are accident with vehicle and accident with fixed objects. Moreover, the Accident with Fixed Object are mostly preventable accidents.
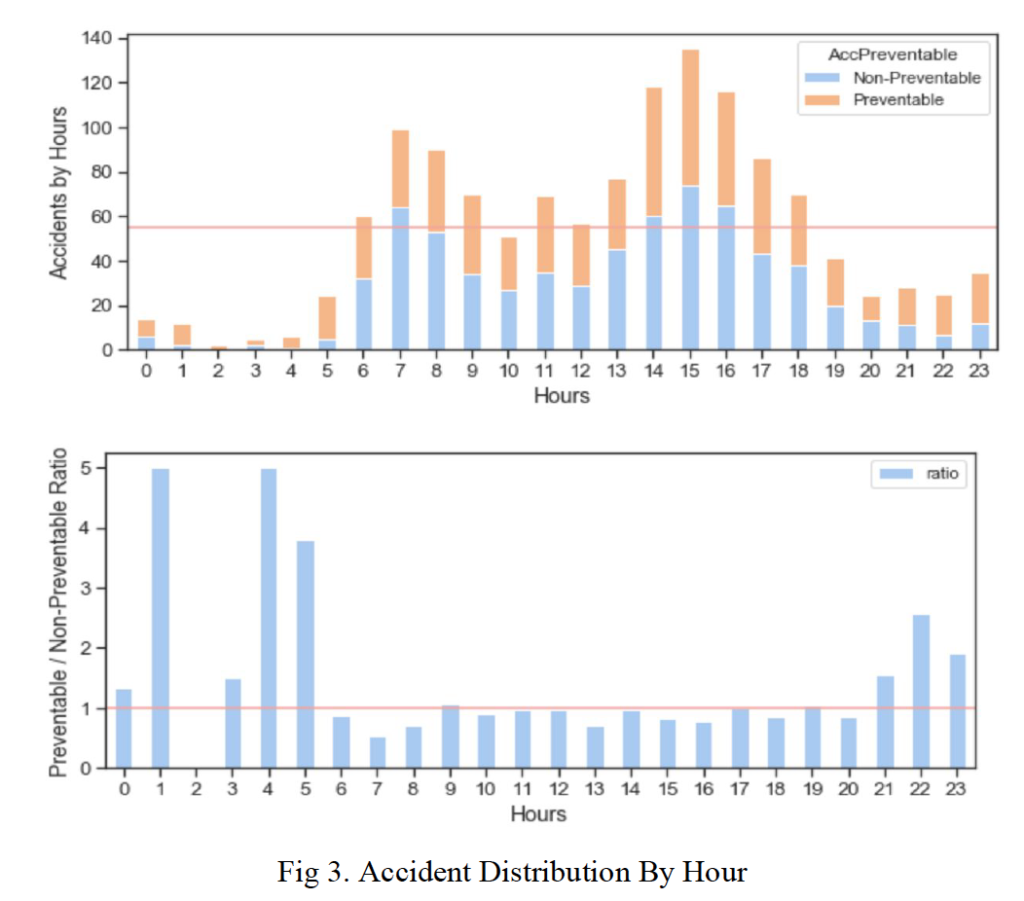
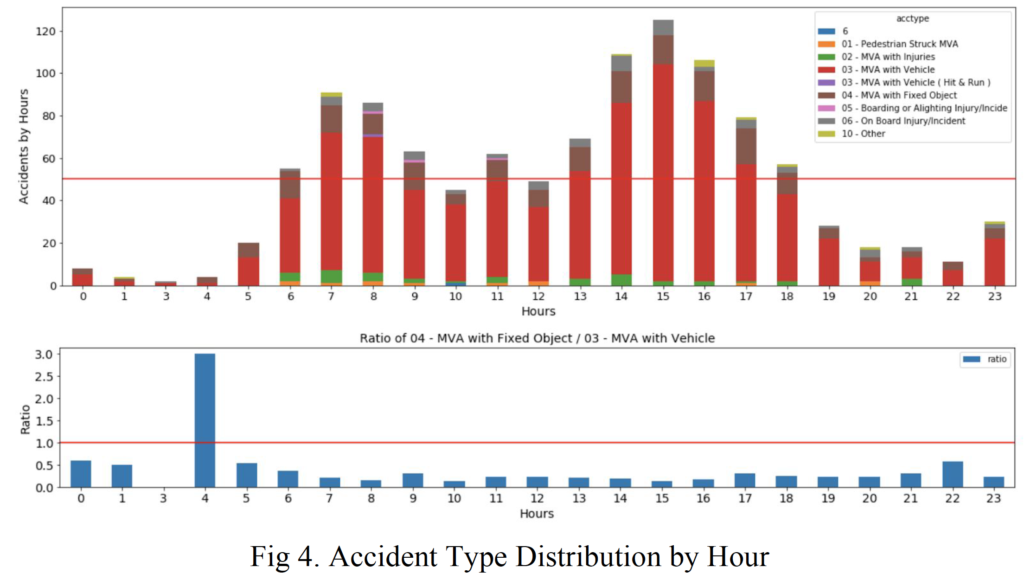
Hours and Preventable Accident
The first thing we want to explore is how the Preventable to Non-preventable Ratio changes across different hours. From Figure 3, we could see that there are three peaks where the ratio is unexpectedly high, which is at 1 AM, 4 AM, and 5 AM and after communicating with our sponsors, we obtained the information that 1 AM is when most of the buses pull in to the RTS garage and 5 AM is the time when most of the busses pull out. Also from the distribution of various accident types across different hours, we could see that the ratio of the accident with fixed object to the accident with vehicles is very high during 4 AM, so it is important that drivers pay more attention, especially when pulling out of the garage.
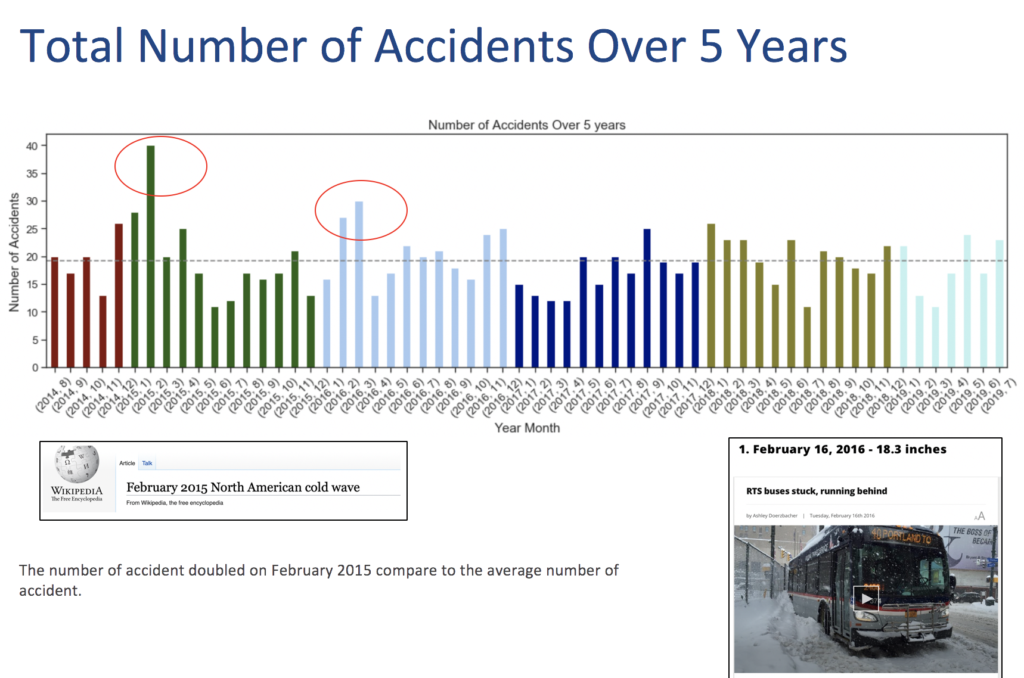
Number of Accidents Across 5 Years
Another important thing we explored is how the number of accidents changed across different months over 5 years period. After plotting out the number of accidents across 5 years, we found that there is an unusual peak in February 2015. After checking online for news in Rochester in February 2015, we found that it is the coldest month in Rochester ever, and the weather condition is not ideal for driving as well. After comparing the preventable and non-preventable accident rates in February 2015 and March 2016 with the overall preventable and non-preventable rate, we found that the ratio is higher in winter, especially for months that have extreme weather. Also since the number of non-preventable accidents also increases in those months, drivers should also pay attention to the nearby vehicles when driving.
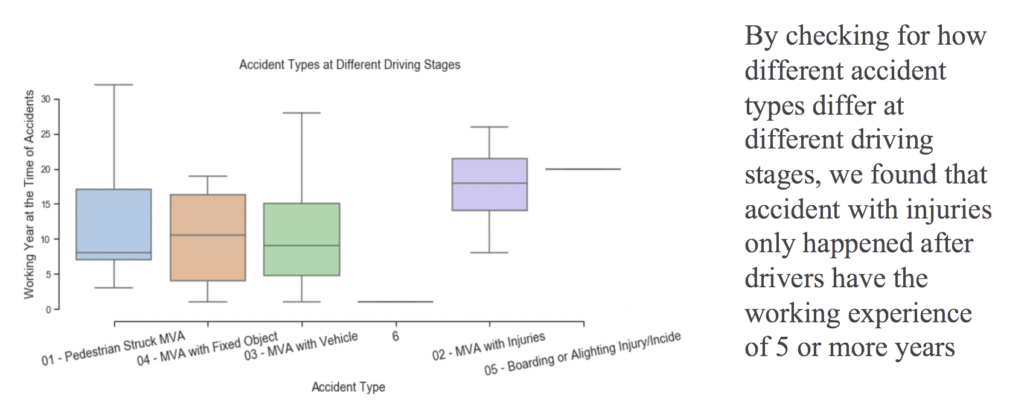
Accident Types at Different Driving Stages
As there are different accident types, we are curious whether different types of the accident would happen at different stages of drivers’ driving history. So we plotted the distribution of working years at the time of the accident for different accident types. Surprisingly, we found that accidents with injuries would only happen after five years of working for RTS, and this again tells us that more senior drivers do not necessarily drive more cautiously or have a smaller chance of accidents when driving.
Hierarchical Clustering
In order to look into the relationship between preventable accident and operators’ type, we look into our dataset. First, we defined a new measurement for preventable rate.
preventable rate = number of preventable accident / total accident
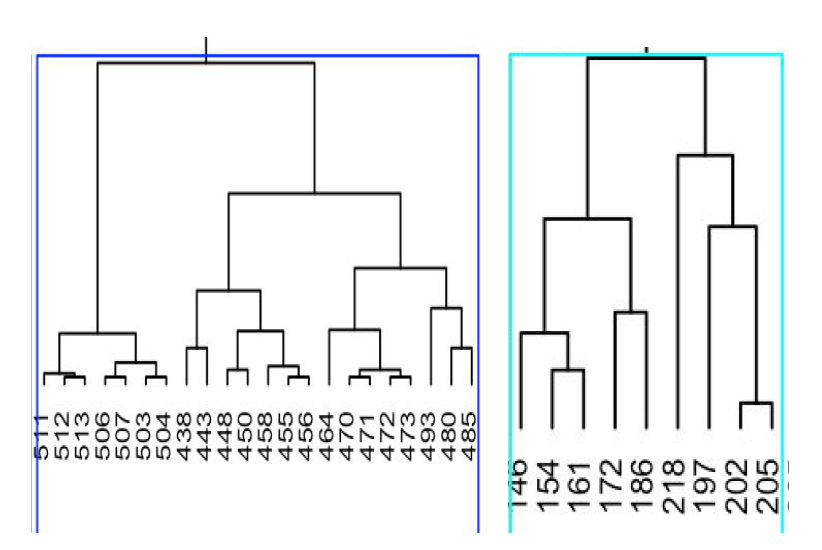
In order to make sure that we have captured the significance of the preventable rate, we include operators who have more than 3 accidents (including 3 accidents). By doing this will guarantee that the operators that we choose have enough accidents. Then we calculate the preventable rate and set a threshold of 0.5. In other words, the remaining operators are those who have at least 2 preventable accidents, and can be regarded as high risk drivers. After operators selection, we would like to dig deeper to find out what are the common patterns of these high risk drivers. A Hierarchical Clustering is applied to our operators, and in the figure below, the x axis is operator ID and the y axis is preventable rate. We have tried different number for cut off and find that for most of them the two clusters we listed on the left are always hold. Which means that these two clusters have a very strong inner similarity and can always be clustered as the same for different cut off. Then we draw a scatter plot and labeled the data points belong to these two clusters in different colors to have a better view. We find that these two cluster has a very high density.
After checking with the operator ID, we find out that drivers with an operator ID over 450 are those regarded as technicians who only drive in the transitional center or garage after drivers returned the buses. For the yellow cluster, we find that although their preventable accident rate is not as high as the technicians, their preventable rate is still not understandable as they are senior drivers (with a relatively small ID which indicates they have entered the industry very early). We then looked into the places to see that is there are some patterns in the accident locations. First, we applied a fuzzy match to identify two important locations: 60 St Paul Streat (Transit Center), and 1372 East Main Street (RTS), which are the RTS’s garage at. We then calculated the rate of accidents in the garage for both two clusters. We found that for the senior driver the accident in the garage rate is 0.611 and the accident in the garage rate for technicians is 0.907. Due to the high preventable accident rate happened in the garage, we confirmed with the RTS group that their garage is very narrow and sometimes hard to drive. As in our findings, we can see that the senior drivers are also being careless while driving in the garage.
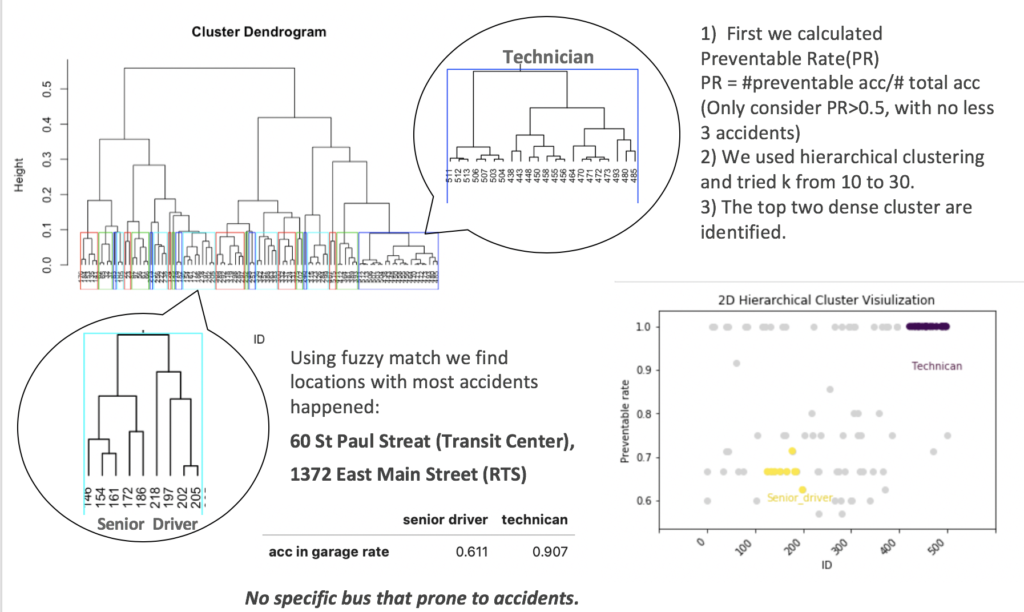
* Smaller ID value indicating a more senior/ experienced driver
Frequent Pattern Mining and Conditional Probability on Driver’s Accident History
In order to look at whether operators with one type of accident are also likely to have another type of accident, we performed frequent pattern mining and calculated conditional probabilities on the drivers’ and technicians’ accident history respectively.
Drivers’ Accident History
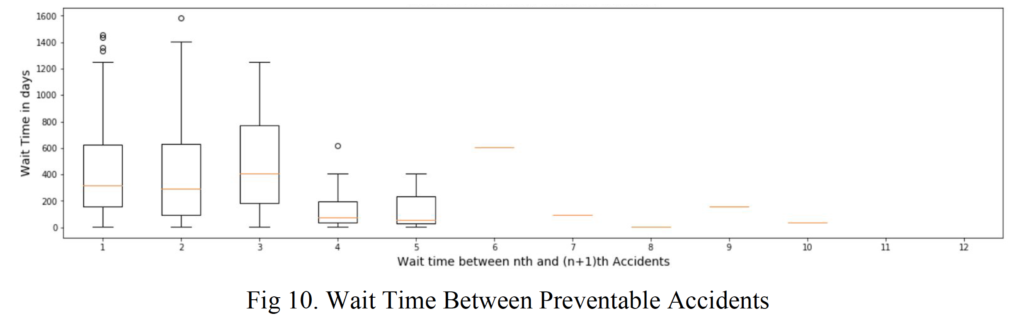
First, we filtered out the technicians and filtered out all the non-preventable accidents in the accident table, and we are left with 499 preventable accidents by 269 drivers. We also calculated the wait time between two consecutive preventable accidents for those drivers, since we want to verify our assumption that after drivers had one accident, they may drive more cautiously in the following period. Since there are 264 drivers with at least one accident, 122 drivers with at least two accidents, only 60 drivers with at least three accidents, and only 26 drivers with at least four accidents, the wait time distributions between fourth and fifth accidents and beyond are not significant, and we should only look at the first three wait time distributions. As we currently don’t see significant differences in the means of those three distributions, our assumption that drivers would drive more cautiously as more preventable accidents occurred does not stand.
Before looking at the frequent pattern mining result, we should look at the distribution of each accident types within our current accident table:
We could conclude that it is very often for drivers to have accidents with fixed objects and accidents with vehicles. Next, we performed frequent pattern mining and extracted the frequent itemsets and association rules from the 269 drivers. For frequent itemsets, we set a minimum support threshold of 100 and the following itemsets are generated:
○ 04 – MVA with Fixed Object: 168,
○ 03 – MVA with Vehicle, 04 – MVA with Fixed Object: 148,
○ 03 – MVA with Vehicle: 290,
○ 03 – MVA with Vehicle, 03 – MVA with Vehicle: 174
It is also very surprising that drivers who have accidents with vehicles are also very likely to have accidents with fixed objects, and drivers who have accidents with vehicles are also very likely to have another accident with vehicles.
For association rules, we set a probability threshold of 0.7, and the following association rule is being generated:
04 – MVA with Fixed Object:: 03 – MVA with Vehicle: 0.8809523809523809
From the association rule, we could again conclude that drivers who have accidents with fixed object is also very likely to have accidents with vehicle.
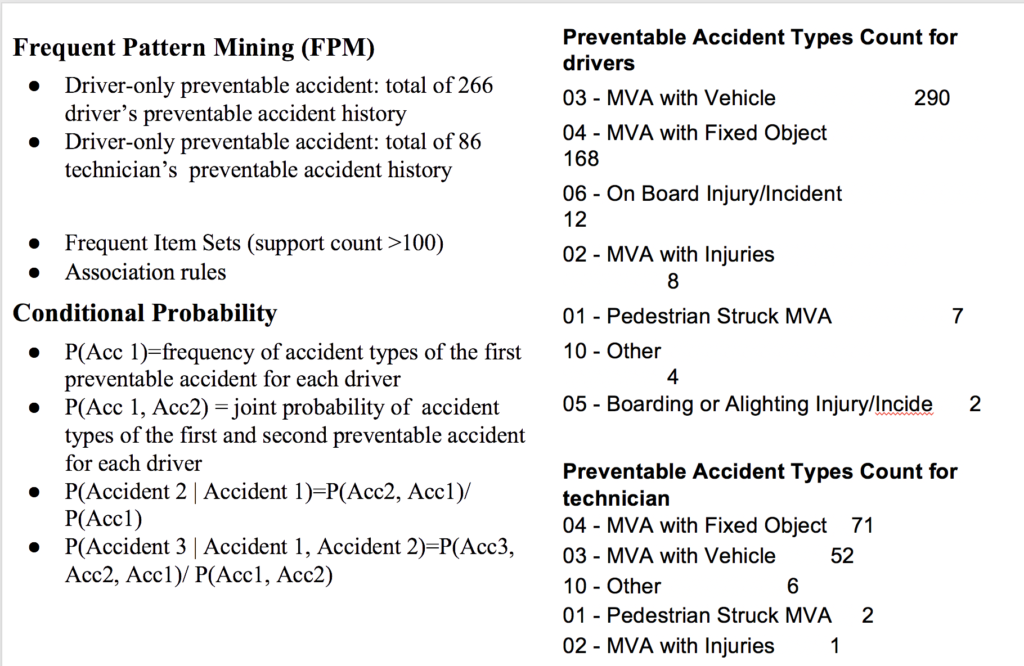
Since frequent pattern mining has certain limitations: it does not consider the order of each accident incidents, so we also calculated the conditional probability for preventable accidents for the first three accidents. The conditional probabilities are calculated using the following formulas:
● P(Acc 1)=probability of accident types of the first preventable accident for each driver
● P(Acc 1, Acc 2) = joint probability of accident types of the first and second preventable accident for each driver
● P(Acc 2 | Acc 1)=P(Acc 2, Acc 1)/ P(Acc1) = conditional probability of second preventable accident conditioned on first preventable accident
● P(Acc 3 | Acc 1, Acc 2)=P(Acc 3, Acc 2, Acc 1)/ P(Acc 1, Acc 2) = conditional probability of third preventable accident conditioned on first two preventable accidents
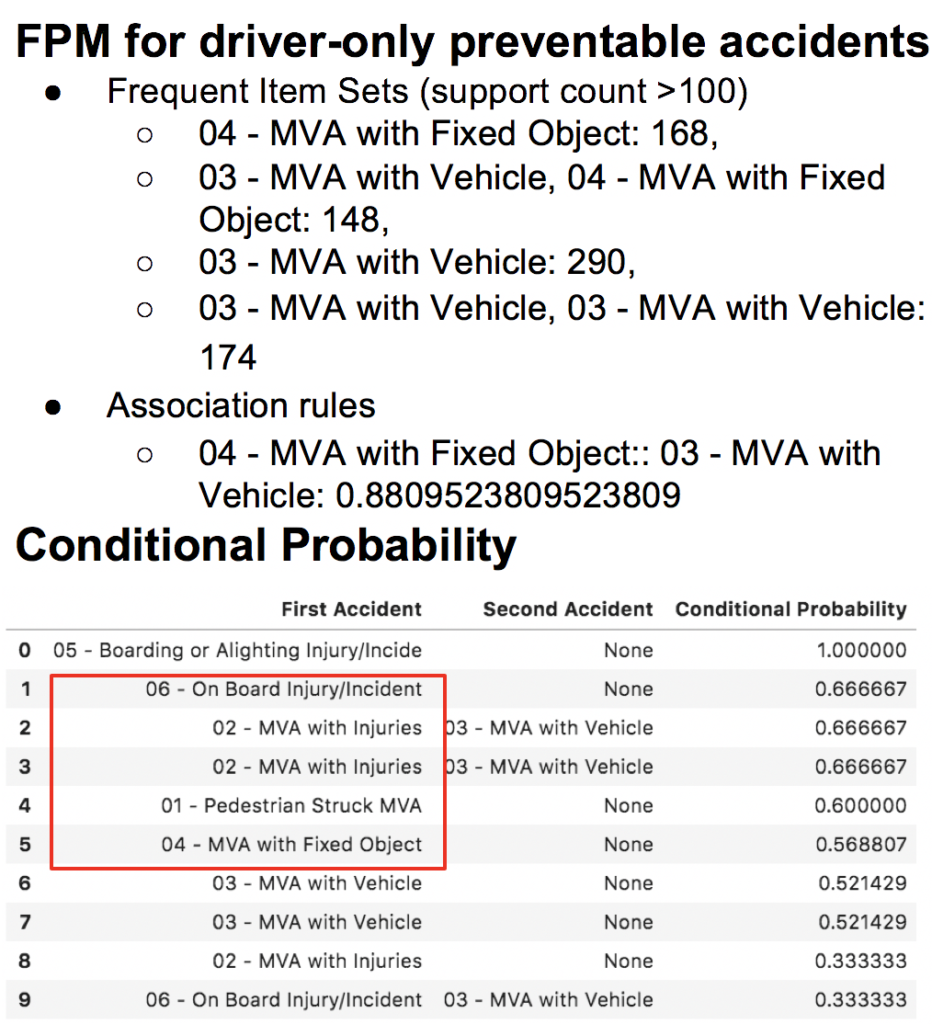
When we looked at the highest conditional probability, we saw that the pairs of 06- On Board Injury/Incident and None, 05- Boarding or Alighting Injury/ Incident and None, and 01 -Pedestrian Struck MVA and None have the very high conditional probability, it tells us that accident with injuries would have a huge impact on drivers’ attitude as they would drive much more cautiously in the future.
Technicians’ Accident History
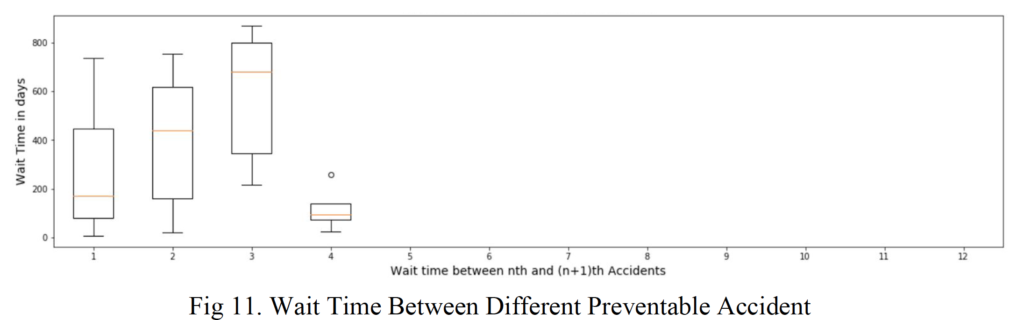
For technicians accident table, there is a total of 135 preventable accidents by a total of 88 technicians. Again, we looked at the wait time between two consecutive accidents and since there are 86 technicians with at least 1 accidents, 25 technicians with at least 2 accidents, and 12 technicians with at least 3 accidents, we again only looked at the first 3 preventable accidents.
We could see that there are differences in the means of each wait time distribution, so our conclusion is that for technicians if they had more preventable accidents, they will be more cautious when operating the vehicles. For frequent itemsets, we again used the minimum support count to 100, and we got the following frequent itemsets:
○ 0 3 – MVA with Vehicle: 52
○ 04 – MVA with Fixed Object: 71
No association rules are found even with a low probability threshold since we have a very small table with less than 200 accidents record.
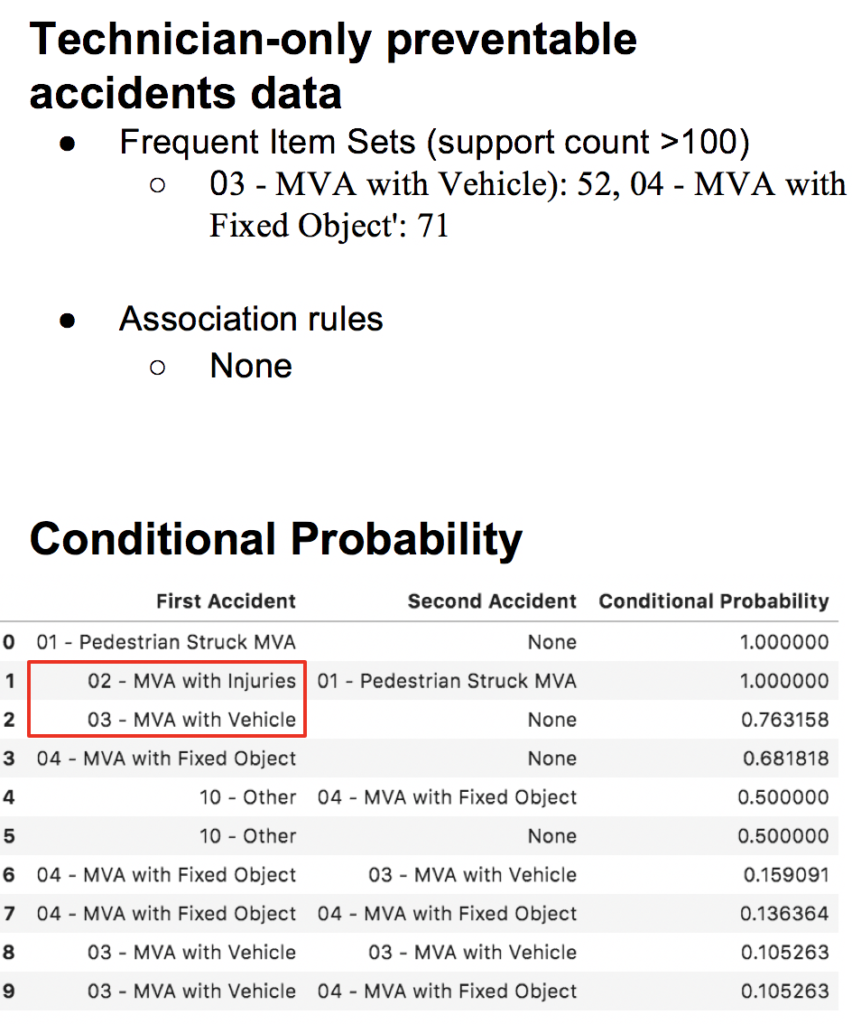
Next, we calculated the conditional probability, and we could see again that many technicians don’t have second accidents after having their first accidents. Moreover, the accident pairs containing accident types of pedestrian struck and injuries again have very high conditional probability, due to the small number of incidents and also our assumptions that serious accidents would have a huge impact on technicians operating habits and attitudes.
Insight & Conclusion
1. Short seniority drivers have higher chance of involving into both preventable and non-preventable accidents, especially on their first year
2. Overall, technicians have higher chances of involving in preventable accidents compare to drivers. Noticeable high preventable accident count after midnight till 5 am is related to technicians.
3. The interval between preventable accident increase as more preventable accidents occurred for the individual operator – accidents do make drivers more cautious
4. High chance of involving in accidents near RTS Transit Center (60 St. Paul) and RTS main office (1372 East Main St.)
5. (Motor Vehicle Accident) MVA with injuries (02) generally happens after 5 years of driving
6. Severe weather condition will result in skyrocketing accident count, mostly increase in preventable accident count
Suggestions for RTS
1. More rigorous and frequent training for new drivers (seniority <=1)
2. Lectures or training to increase awareness of safety for technicians
3. Provide specific training for drivers who drives RTS bus for more than 4 years to increase awareness and prevention for MVA with injuries (02) type of accident
4. High accident rate near RTS transit center and RTS main station may result from poor design of the parking lot, inefficient parking management system or insufficient training for technicians. It is advisable for the manager to investigate and locate the root for the problem, that might result in a significant decrease in preventable accident count and further decrease the maintenance cost
Acknowledgement
We truly appreciate all the help and guidance from our sponsors Bob and Adam from RTS and our capstone course instructors Prof. Anand and Prof. Fernandez.
References
Healy, K. (2019). Data visualization : a practical introduction . Princeton, New Jersey ;: Princeton University Press.
Alexandropoulos, Stamatios-Aggelos N., Sotiris B. Kotsiantis, and Michael N. Vrahatis. “Data Preprocessing in Predictive Data Mining.” Knowledge Engineering Review , vol. 34, 2019.
Porcu, Valentina. Python for Data Mining Quick Syntax Reference. Apress, Berkeley, CA, 2018, doi:10.1007/978-1-4842-4113-4.