Team
Qianqian Gu (Project Manager)
Wei Wu
Chen Yao
Hanyang Zhang
Mentor
Ajay Anand
Abstract
The Goergen Institute for Data Science (GIDS) masters admission office wants to better understand applicants’ decisions and the overall application cycle from 2015 to 2021. The goal of this project is to generate meaningful insights and helpful suggestions on future marketing and recruitment for the master’s program. With previous GIDS applicants’ data and the National Student Clearinghouse data, we conducted exploratory data analysis to reveal patterns underlying applicants’ behaviors from creating to submitting applications, while simultaneously training supervised classification models (i.e., logistics model, MLP, and random forest) to identify factors that influence applicants’ decisions on accepting/declining the offer. In the end, we find that students who take more time to complete their applications and have higher GRE scores are more likely to decline the offer. Additionally, the admission office should expect around 20% of created applications to be incomplete and be prepared for an influx of applications between the middle of December and early January.
Dataset Description
6-year GIDS Applicant Data (2015-2021)
- Over 3,700 rows
- Around 200 columns
- Demographic data (i.e., age, citizenship, sex, etc.)
- Academic data (i.e., GRE test score, GPA, etc.)
- Application timeline (i.e., application created time, etc.)
National Student Clearinghouse Data (2013-2018)
- It documented which school and program a person enrolled in
- Can be joined with the GIDS applicant data by unique slate reference number
Data Pre-processing
Since the 6-year GIDS applicant data is the essential dataset for the purpose of this project, the following procedures are conducted to process it before proceeding to the Exploratory Data Analysis (EDA) stage:
- Filtered out irrelevant variables, reducing the size of variables from 188 to 27 columns in the 2015-2021 GIDS applicant dataset
- Divided the original dataset into two sub-datasets: one with complete applications (2,853), and the other with incomplete applications (868)
For each sub-dataset:
- Excluded 2015 and 2016 data
- Dropped null and invalid records (e.g., data with spring entry terms, part-time students, and students applying for certificates, etc.)
- Added new variables (e.g., Priority_Deadline, Normal_Deadline, etc.)
- Derived new variables from existing data (e.g., Days_Taken_ to_Complete_Application, etc.)
In the end, the processed complete applications dataset contains 2,325 records and the processed incomplete applications dataset contains 694 records.
EDA Results

- There is an upward trend of the number of applicants, mainly consisting of foreign nationals.
- There is a decrease in the percentage of female applicants from 2018 to 2021.

- Term of 2018 had the most number of admitted students compare to other terms.
- Term of 2017 had the most number of denied applicants compared to other terms.

- Most students tend to decline, melt or have no response once they are admitted.
- Term 2021 had the most number of students who accepted the offers.

Top three countries where applicants come from: China, India, and the United States.

More admitted students who decline our offers seem to go to schools such as Columbia University, Carnegie Mellon University, and Cornell University.

More admitted students who didn’t get admitted to Rochester seem to go to schools such as Columbia University, Syracuse University, and the University of Southern California.

Most students heard about our program through Family/Friend, Internet search, and the University of Rochester’s reputation/word of mouth (higher percentage).

Since the University of Rochester is currently ranked as No.34 in U.S. news, it is likely that more rankings of students who declined our offers are in the range of 21 – 30.

- The Admit section tends to shrink in the later part of fall admission cycle for started time.
- There is an indication of more prepared time related to success

The Admit section also tends to shrink in the later part. This characteristic tends to become more apparent in recent years.

There is no obvious pattern of the portion of student decision vs. started time. But for the 2020-2021 cycle, there is no ‘no response’ decision.

There is no clear pattern based on the submission time, but for later submission time in a specific cycle, the decision tends to become more mixed. It’s perhaps attributed to the larger volume of applications.


- There is an overall increasing tread in the number of incomplete applications from 2017 to 2020.
- The number of Chinese students who didn’t finish their applications rocketed in 2020 (likely due to COVID-19).
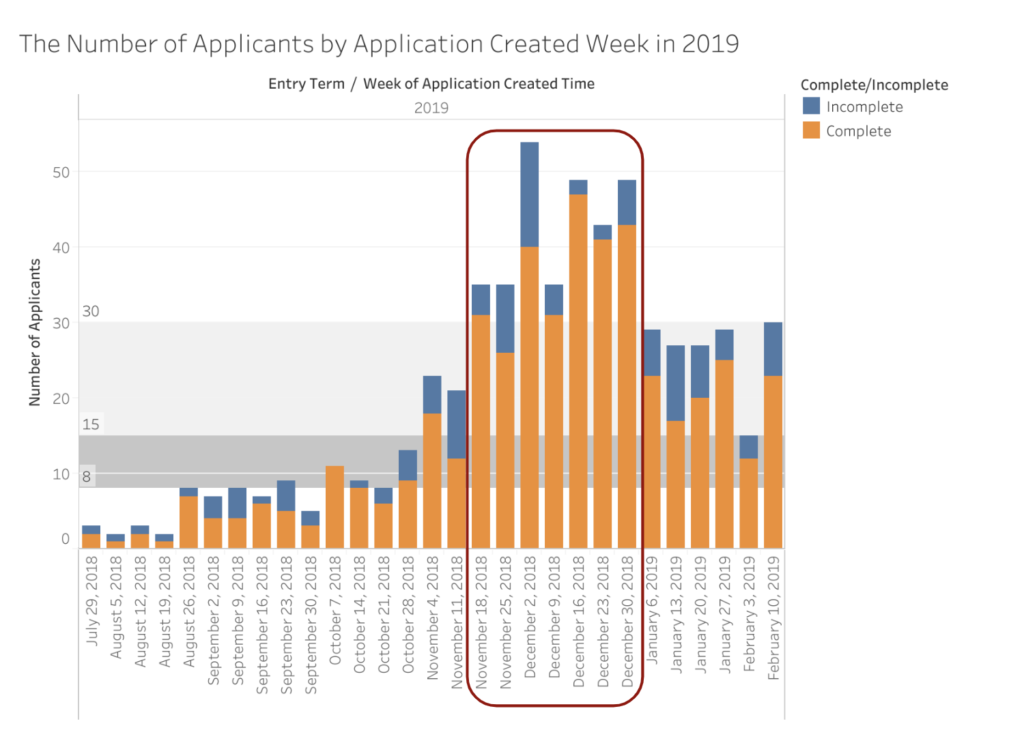
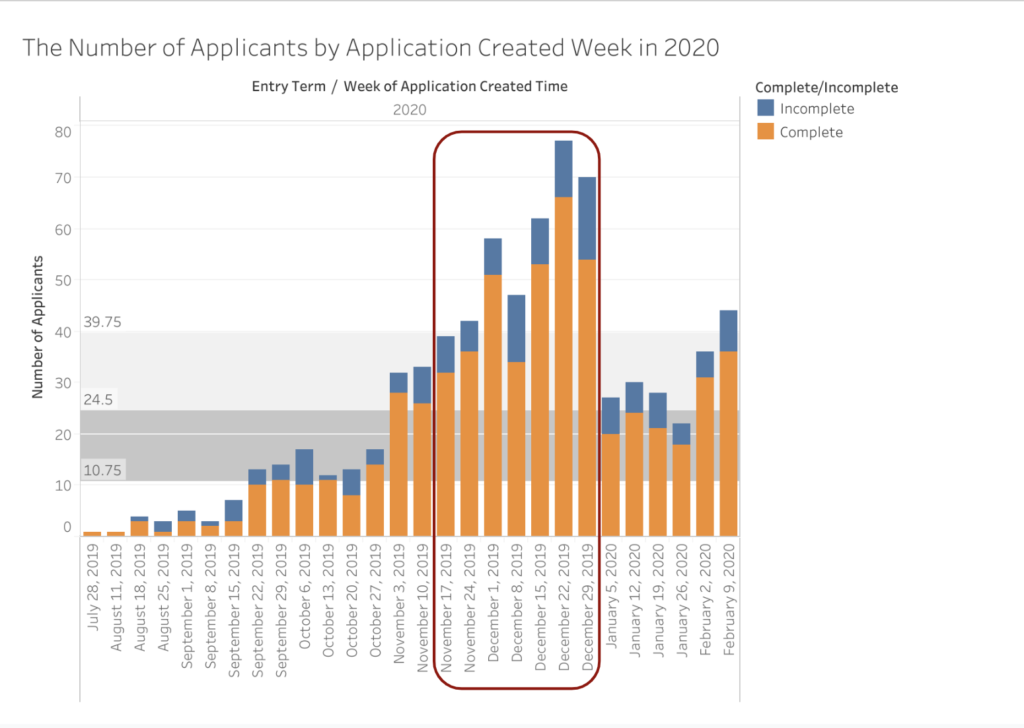
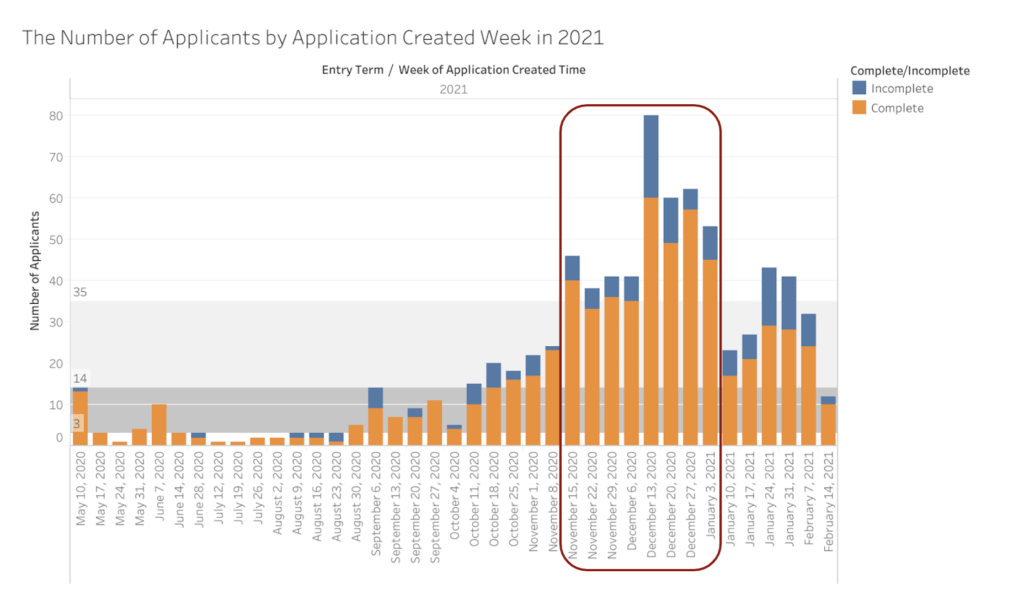
- On average, around 23% of applications were incomplete/not submitted, regardless of the application created week.
- Given the priority deadline (Jan 5) and the normal deadline (Feb 15) stay constant, the number of applications created usually reaches the peak between mid November and the end of December.
Key Insights/Takeaways
- Students who started applications early are more likely to get admitted.
- Students who took more time to complete their applications and had higher GRE scores are more likely to decline the offer.
- No obvious pattern between start time/submission time and student’s decision.
- No strong correlation between application created week and application completion status.
- When applicants submitted their applications, half of them didn’t have all required materials ready.
Acknowledgements
Special thanks to our sponsors (Ms. Altman and Ms. Briscoe) and Prof. Ajay!