Project Motivation
Wet etching is a commonly used technique for gold stripping in the semiconductor industry due to its low energy use and low equipment costs. This project explores the effects of an iodine based etchant on the etch rates of both electroplated and sputtered gold coated silicon wafers. The variables analyzed include concentration, temperature, time, and flow rate. Etch rate was shown to have a strong linear correlation with concentration, but slightly decreases with increasing time. The etch rate increased with both temperature and flow rate.
Team Members:

Ian Gillis
Mohammed Omar
Leonid Solodov
Emily Spence
Project Sponsor

Mentors
Meta Mentor: Michaela Wentz
UR ChE Mentors: Professor Alex Shestopalov, Professor Mark Juba
Project Background
Background Overview
- Virtual reality has emerged as a promising technology for next generation digital displays.
- An important component of virtual reality are micro LEDs (µLED), which are used in digital displays.
- Patterning wafers with microstructures is crucial for µLED manufacturing, but presents an industry challenge because of their small size. Gold etching using wet etch techniques is a favorable approach to manufacturing microstructures.
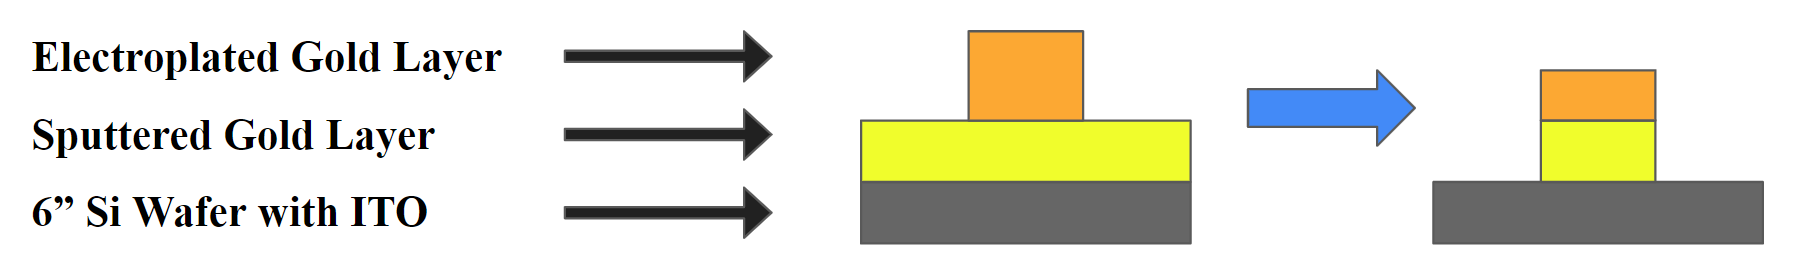
- The patterns are composed of a sputtered gold layer by chemical vapor deposition and an electroplated gold layer by electrochemical deposition.
- Wet etching uses a reactive solution to evenly remove material from a surface.
- This is a popular method because it has low energy and equipment costs.
Customer Requirements
Process conditions must:
- Not exceed received concentration of etchant.
- Remain below 50℃.
- Not exceed 20 minutes.
- Recirculate the etchant.
- Etch rate needs to be less than 2 nm/s (limitation of test system in Ireland).
Project must:
- Analyze effect of temperature, time, flow rate, and concentration on the etch rate of sputtered and electroplated gold.
- Characterize an etching process that etches 90 nm of sputtered gold and no more than 150 nm of electroplated gold.
Technical Approach
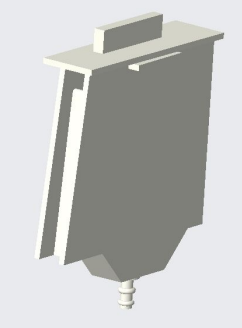
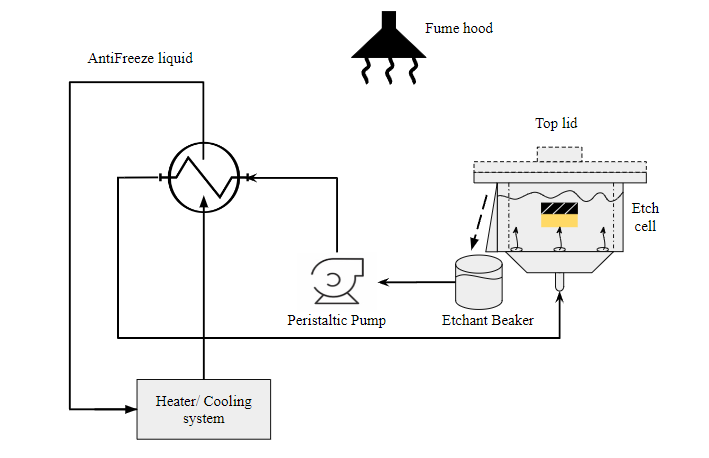
Flow System Design
The etch cell design allows etchant to be pumped through the bottom of the cell and overflow out of a channel in the lid. The etch cell and flow system were designed to be scalable to the recirculation system used at Meta’s wafer fabrication lab.

Design of Experiment
We ran trials varying time, concentration, flow rate and temperature.
Methods and Metrology
Kapton tape is placed on the wafer sample is submerged in the etchant and the trial is run, then the sample is cleaned and the tape is removed. The Kapton tape is impermeable to the etchant so it allows the section under it to remain unetched while the rest of the sample is being etched. This produces a step that can be measured from the unetched to the etched portion in order to find the etch rate. These measurements are taken on an optical interferometer.

Results
Trial Results


Conclusions and Recommendations
Conclusions
- Positive and linear (mostly) correlation between concentration and etch rate.
- Both flow rate and temperature increase etch rate.
- Etch rate slows down with greater etch time (contamination?).
- Results suggest that concentration may be the most reliable control parameter.
Recommendations
- Use a measurement tool such as a 4-point probe that can measure thickness over an entire wafer rather than just a small portion
- The gold thickness was found to differ fairly significantly across a wafer
- Further analysis of deposition type differences
- UR Nano vs RIT vs Meta sputtered wafers use different types of physical deposition
- Complete more repeat trials to confirm whether or not there is a difference between electroplated and sputtered deposition methods
- Optimize etch conditions with patterned wafers
- Consider modifying the flow cell design to try to keep flow uniform over the whole wafer
- Thickness was bigger on the top of the wafer, likely because fluid velocity was greater at the bottom
Acknowledgements
Sponsors: Michaela Wentz and Meta
Mentors: Prof. Shestopalov and Professor Juba
Instructors and advisors: Prof. Lawton, Prof. Kelley, Clair Cunningham, Mason Garlatti and Eliya Tashbib
Other thanks to: Robin Jia, Patrick Raffaelle, Elvin Zhao, Prof. Tenhaeff and Dr. Madejski