The goal of this project is to design an accelerated testing system for gaskets in the India Mark II hand pump
Dan Allara, Oion Akif, Paul Irving, Tessa Ludwick
Mentor: Rachel Monfredo, Lecturer

Sponsor: James Harrington 
Sponsors: Matthew Dawes,
Bob Bechtold
“The Ugandan Water Project exists to see Uganda as a nation liberated from the bondage of water-borne disease and poverty as communities leverage the transformative power of clean water to empower all people to live the lives they were created for.”1
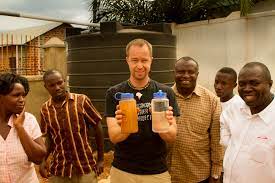


~ Give Water and Give Life ~
The UWP provides clean water for communities in Uganda by installing India Mark II Hand pumps into boreholes. However, the current pump gasket lifetime of one year severely increases the maintenance of the pumps which threatens the sustainability of the population’s essential need for drinking water. It is desired that gaskets last five years and Harbec, a local manufacturing facility specializing in novel polymers, has the ability to potentially create these new gaskets to offer significant durability improvements. This senior design project is concerned with designing an accelerated testing system to test the durability of the new gaskets while mimicking field conditions in Uganda to characterize gasket deterioration.
Background and Requirements:
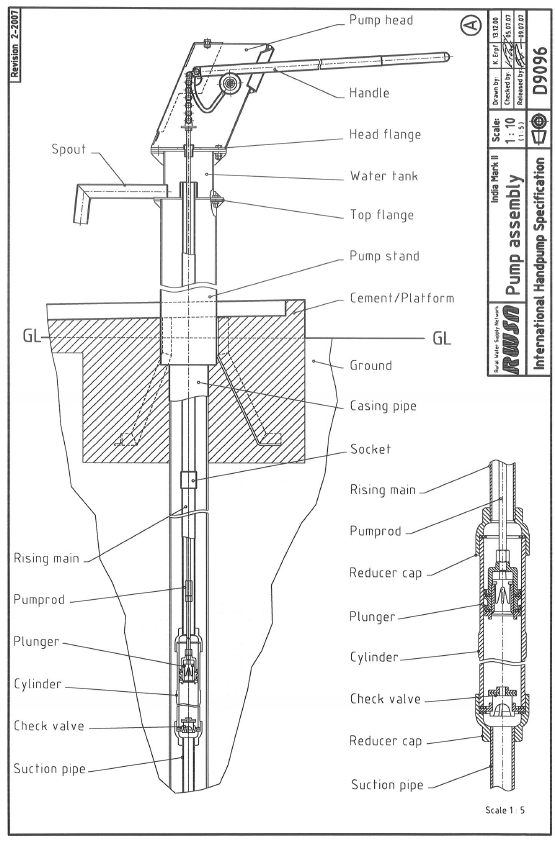
The India Mark II hand pump is used to supply water to millions of people worldwide. A diagram of the pump is shown in the figure below. The gaskets are located deep underground (~150 ft) which makes them very difficult to replace. Thus, it is desired that new gaskets be designed that are capable of lasting longer.
Last year, a senior design team proposed using thermoplastic polyurethane (TPU) gaskets instead of rubber gaskets to increase gasket lifetime. These gaskets were installed in Uganda and have lasted more than a year. It is desired that the new gaskets last around 5 years. In order to test the gaskets in a shorter amount of time, an accelerated gasket testing was desired. This stand would be capable of running the pump 24/7 at an increased rate.
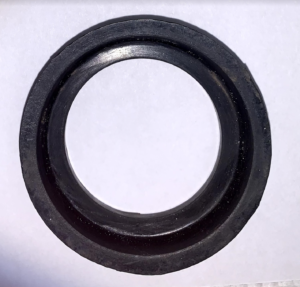
New Rubber 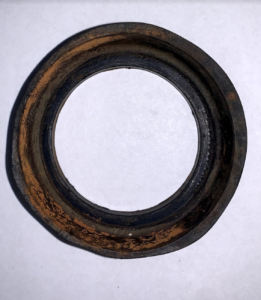
Used Rubber 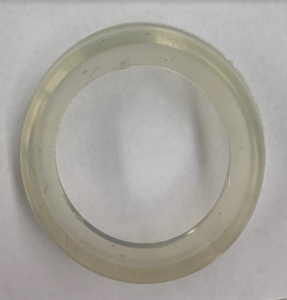
New TPU
Causes of gasket wear:
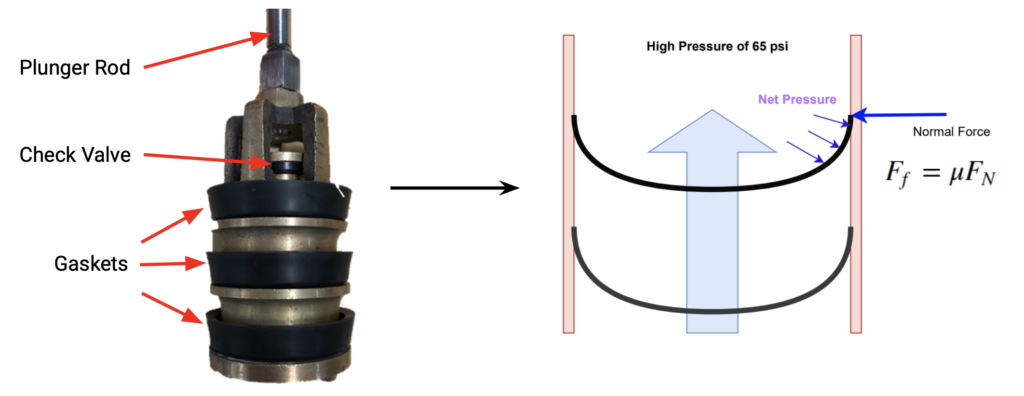
The gaskets are cup-shaped so that on the upstroke, the back pressure pushes the gaskets outward to the walls of the pump to make a watertight seal. High pressure will increase friction and lead to gasket wear. Due to lifting water from a depth of 150 ft, the pressure above the gaskets is significant (about 65 psi). Gasket deterioration is further exemplified due to the presence of suspended sediment in the water. This sediment can act as sandpaper between the gasket and the pump wall. The third crucial factor is temperature, which has a significant effect on the gasket’s physical properties. The low groundwater temperature of 10ºC tends to make materials more stiff and brittle.
Technical Approach:
As the gasket gradually increases in wear, the capacity of the India Mark II to lift water decreases. Therefore, gasket performance can be evaluated by measuring how flow rate changes over time. A process flow diagram of the design is shown in the figure below.
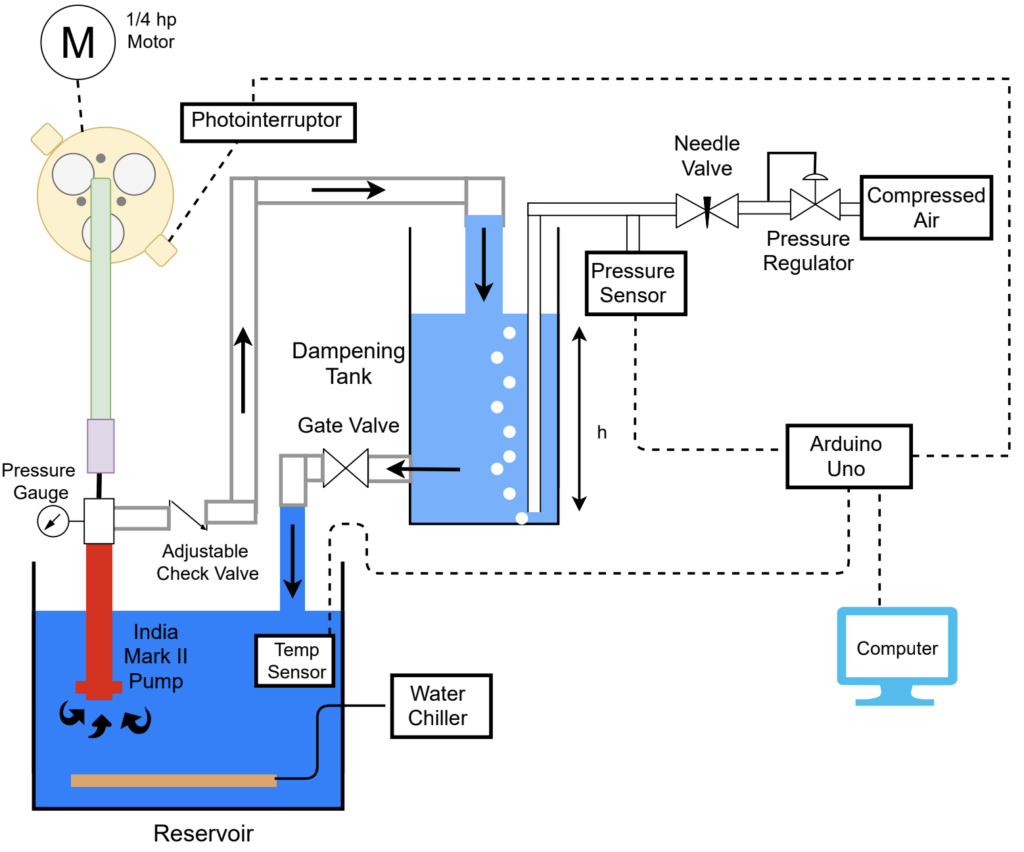
The pump driving mechanism was designed by a mechanical engineering team. It consists of a 1/4 hp motor that is connected to a flywheel. Rotation of the flywheel drives the pump-rod up and down which pumps the India Mark II pump.
Water is cooled to 10ºC in the reservoir tank before being pumped by the India Mark II through a check valve. The check valve can be adjusted to increase back-pressure to around 65 psi on the upstroke.
Water is then carried through piping before draining into a dampening tank. The dampening tank is mechanically isolated from the pump driving mechanism to prevent vibrations from affecting flow rate measurements. The dampening tank’s purpose is to turn the square wave output from the India Mark II pump into a constant flow rate. The tank was sized to have a large cross-sectional area to enable this dampening effect. Flow rate out of the India Mark II pump is related to fluid height in the dampening tank. By measuring how fluid height changes over time, changes in flow rate can be monitored. A pressure transducer with a bubbler system is utilized to obtain tank height data.
Data is collected and outputted to a computer using an Arduino Uno. Data collected includes dampening tank fluid height, pump stroke rate, and temperature in the reservoir tank.
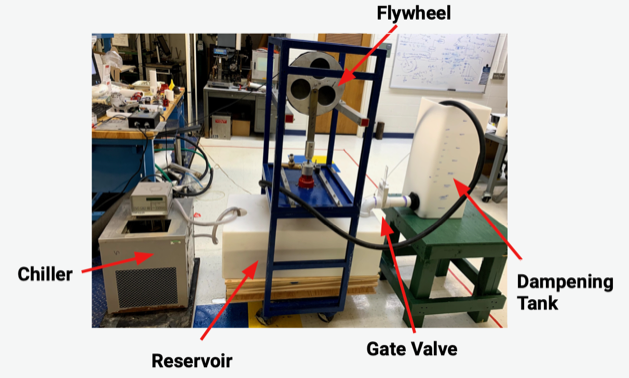
A figure of the laboratory set up is shown below.
Flow Rate Analysis:
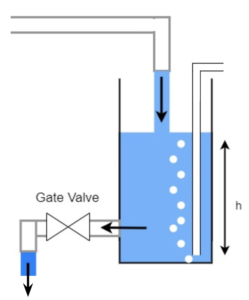
The flow rate out of the India Mark II hand pump resembles a square wave. This oscillatory flow is difficult to measure directly. An auxiliary tank is used to dampen the square wave input while also detecting flow rate changes.
Flow rate can be measured using through a correlation to tank height shown in the following equation:
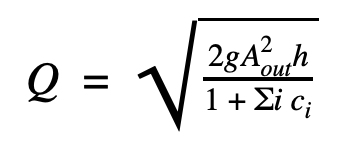
In the above equation Q represents flowrate, g is acceleration due to gravity, Aout is the area of the outlet, h is the height and frictional losses from the pipe are represented by ![]() ici
ici
Tank height is related to hydrostatic pressure as shown in the following equation: ΔP = ????????Δ????. Due to these relationships, flow rate can be monitored over time by measuring pressure in the bottom of the dampening tank over time.
Pressure Measurement System:
As described above, fluid height can be measured by measuring hydrostatic pressure in the bottom of the tank. The implemented design to measure hydrostatic pressure is shown in the figure below.
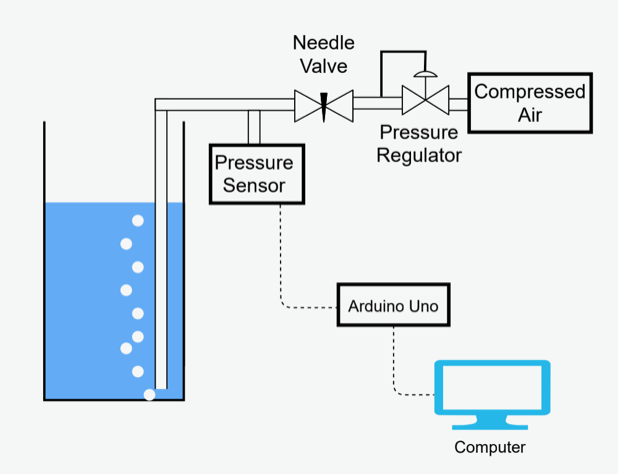
A pressure transducer measures the difference in pressure between the silicone tubing and atmospheric pressure. To ensure that pressure in the silicone tubing is equal to pressure at the bottom of the dampening tank, a needle valve attached to a regulated compressed air supply is adjusted until a slow stream of bubbles exits from the end of the tube in the bottom of the dampening tank. This ensures that the tubing will always be filled with air regardless of any temperature changes.
Chiller Analysis:
A block flow diagram for energy flow in the system is shown below.
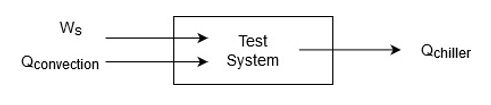
An energy balance on the whole system yields the equations shown below:
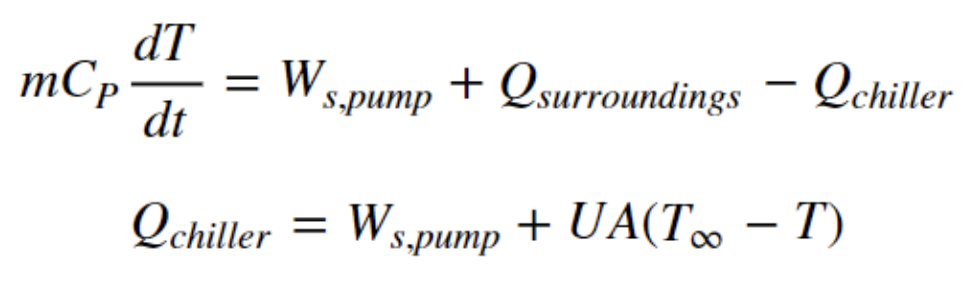
The variables in the equation above are as follows m is mass, Cp is specific heat, Ws,pump is shaft work, and Q is a measure of energy.As shown, the chiller must be capable of removing the energy that enters the system as shaft work and the heat gained from the surroundings.
Results:
Flow Rate Measurements:
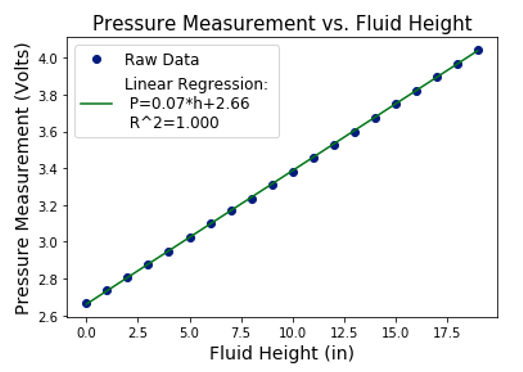
Several experiments were performed to validate the flow measurement design. The first experiment consisted of correlating fluid height in the dampening tank to the reading from the pressure sensor. The data is shown below. A strong linear relationship was observed as expected based on the hydrostatic pressure equation above.
Next, tank height and flow rate were correlated for various gate valve positions. Wider gate valve positions correspond to higher flow rates based on the flow rate equation above. The valve position was set to various values. At each position, flow rate was varied and the corresponding steady-state fluid height was measured.
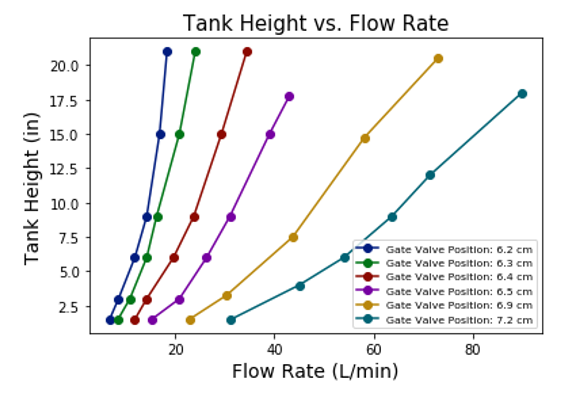
When the gaskets are evaluated, gate valve position will remain constant throughout the lifetime of the gasket. As shown in the figure above, at constant gate valve position, a decrease in flow rate corresponds to a decrease in tank height.
Chiller System Validation:
Harbec has access to a 3.5 kW chiller to cool the water to 10 ºC. Validating the cooling capacity of this chiller was necessary to ensure water would be cooled to the correct temperature. Using the system energy balances above, it was known that the shaft work due to the pump driving mechanism would be, at most, 187 W.
The heat transfer coefficient of the system was unknown. This was estimated by cooling the reservoir tank with a 450 W chiller that was easily accessible on campus. At steady-state and in the absence of shaft work due to pumping, this chiller cooled the water to 5 ºC. The heat transfer coefficient was then calculated to be 19.2 W/m2 ºC. Using this heat transfer coefficient, the total cooling capacity for the system to run with the 187 W motor is 707 W which is easily attainable with a 3.5 kW chiller. These calculations are shown below.

Data Acquisition System:
A diagram representing the data acquisition system is shown in the figure below.

Pressure, temperature, and stroke rate data are obtained from various sensors. The Arduino Uno acquires the data, stores it on an SD card, and uploads it to the computer. Data is saved on the computer and is displayed in real-time to the user. Sensors were calibrated to display fluid height, temperature in Celsius, and stroke rate in strokes/second.
Additionally, an alarm logic system is implemented to inform an operator if pressure, temperature, or stroke rate are outside of the expected ranges.
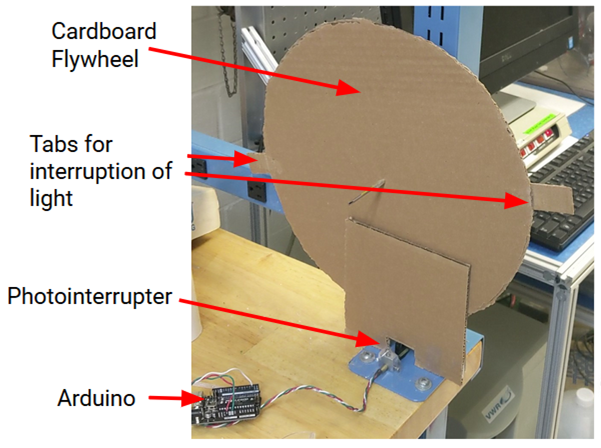
Due to the mechanical pump driving mechanism not being complete, validation of stroke rate sensor output was performed using a cardboard prototype shown in the figure below.
Conclusions/Impact
The methods described will allow for characterization of gaskets in the India Mark II pump. Flow rate changes can be monitored by recording tank height changes in the dampening tank over time. Temperature can be maintained at 10ºC using a 3.5 kW chiller provided by Harbec. Stroke rate will be monitored to ensure it remains constant during gasket testing. These validated systems will be combined with the mechanical pump driving mechanism as a final product that will be deliverable to Harbec.
Future Work:
Sediment Characterization:
Sediments have a great impact on the degradation of the gaskets through friction between the gaskets and the wall of the pump. Water samples were collected from Uganda in different countries and at various depths. A Scanning Electron Microscope (SEM) was used to analyze the soil samples to characterize the variability in particle size.
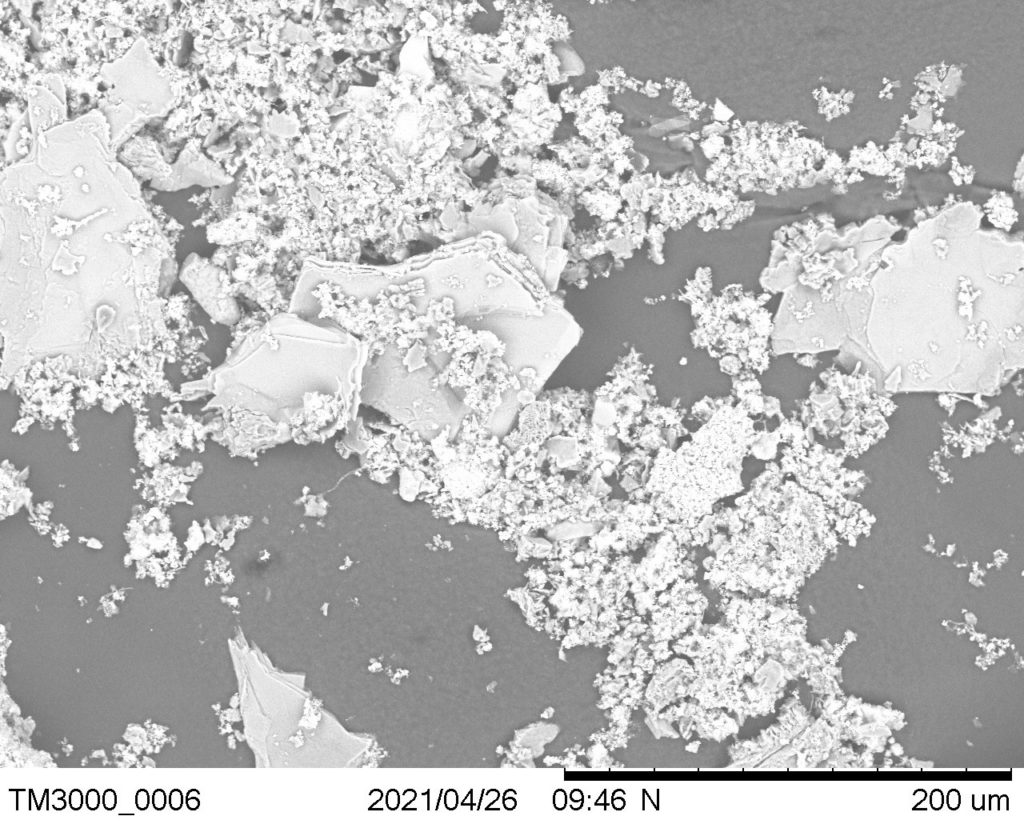
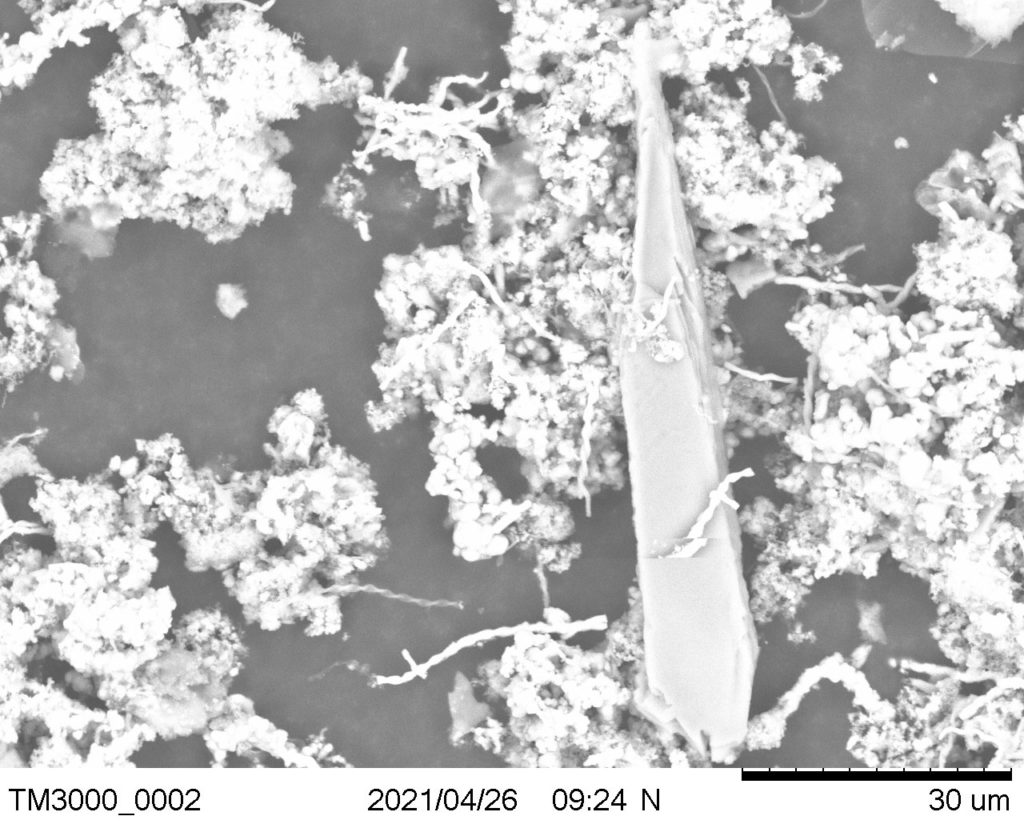
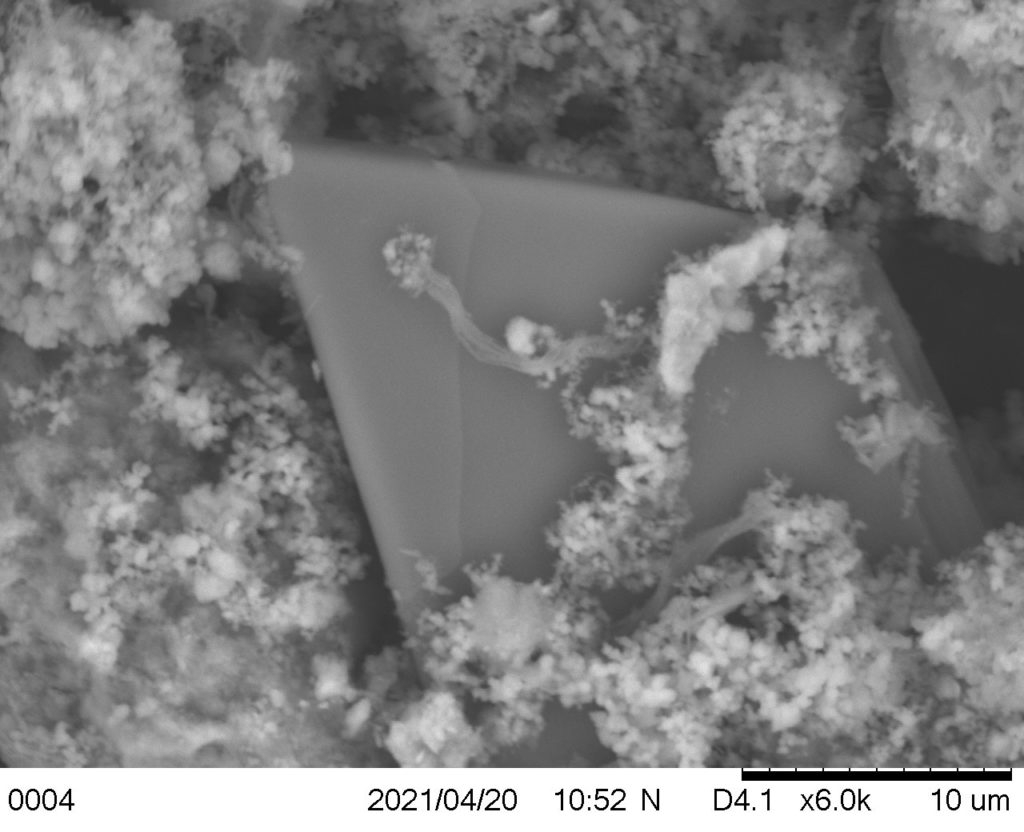
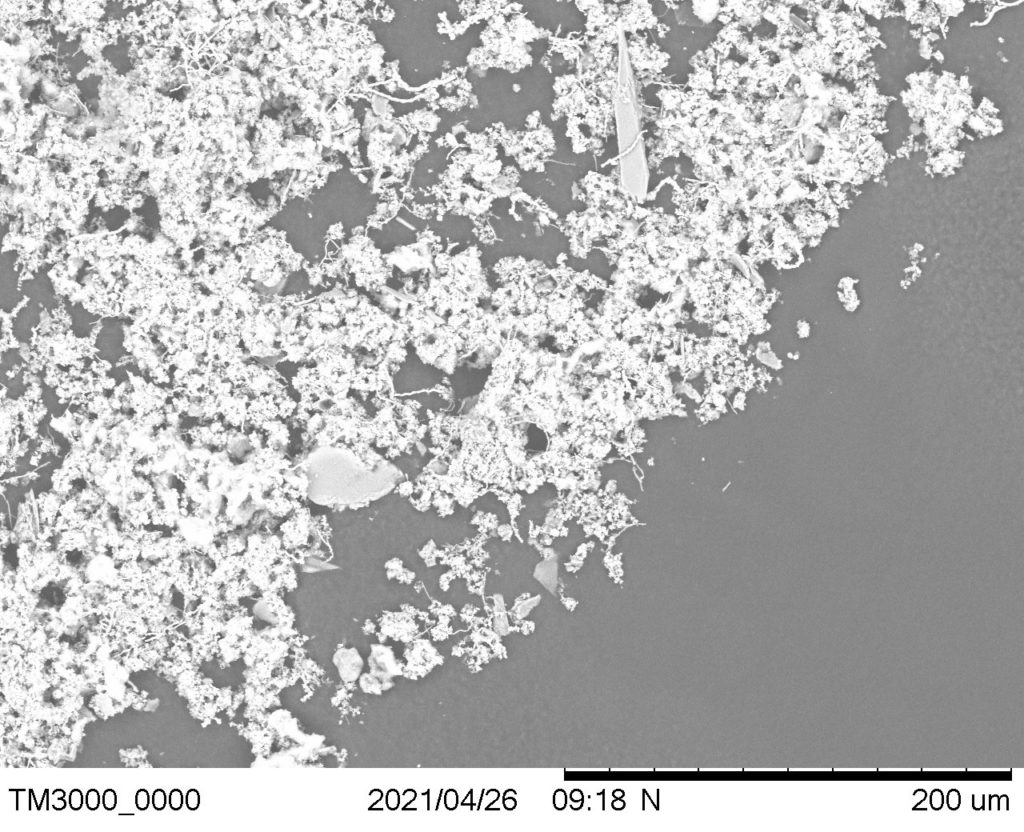
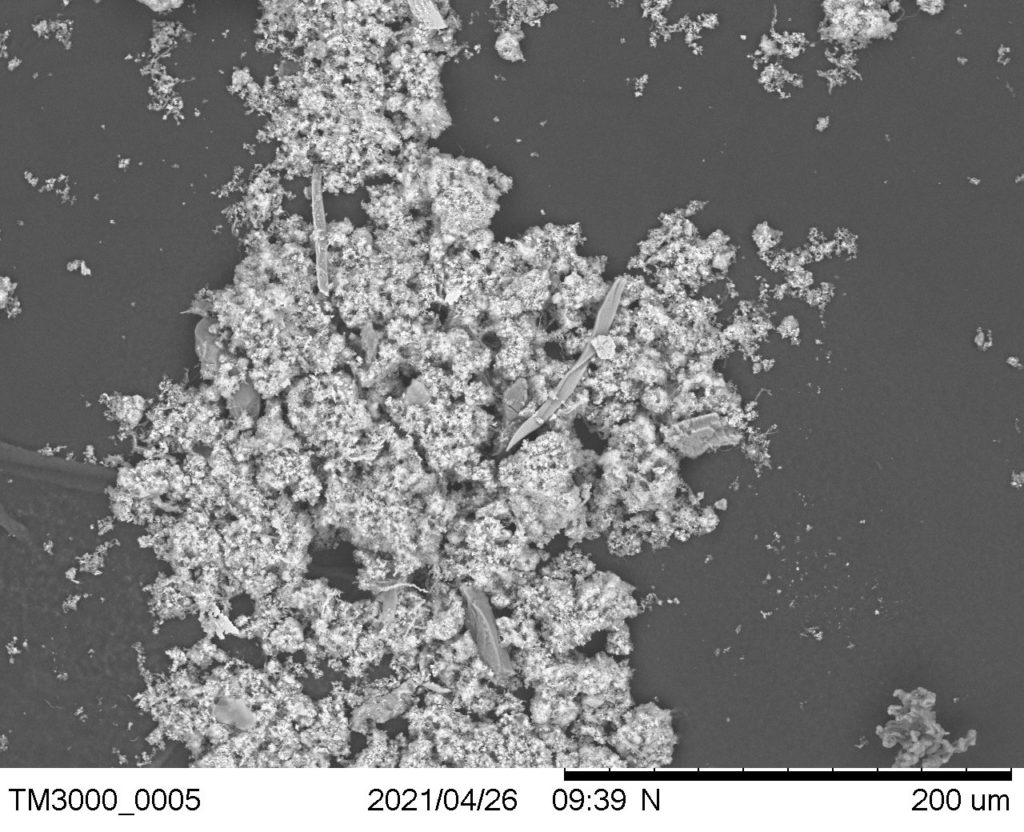
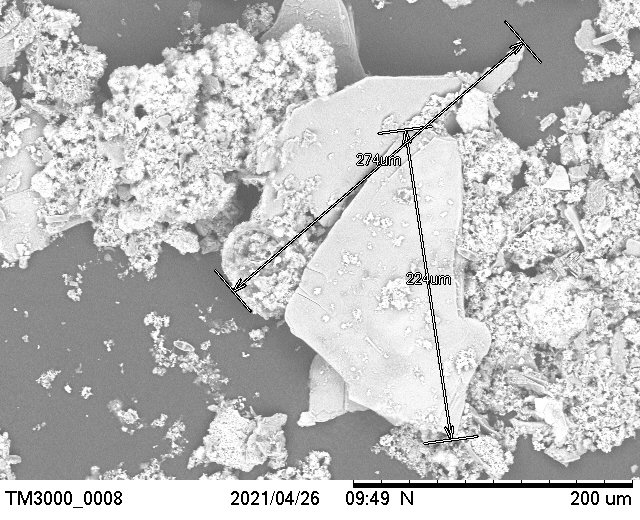
The findings concluded that the bigger particles correlated to a deeper depth. A wide range of particle sizes were found varying from clay to fine grained sand.
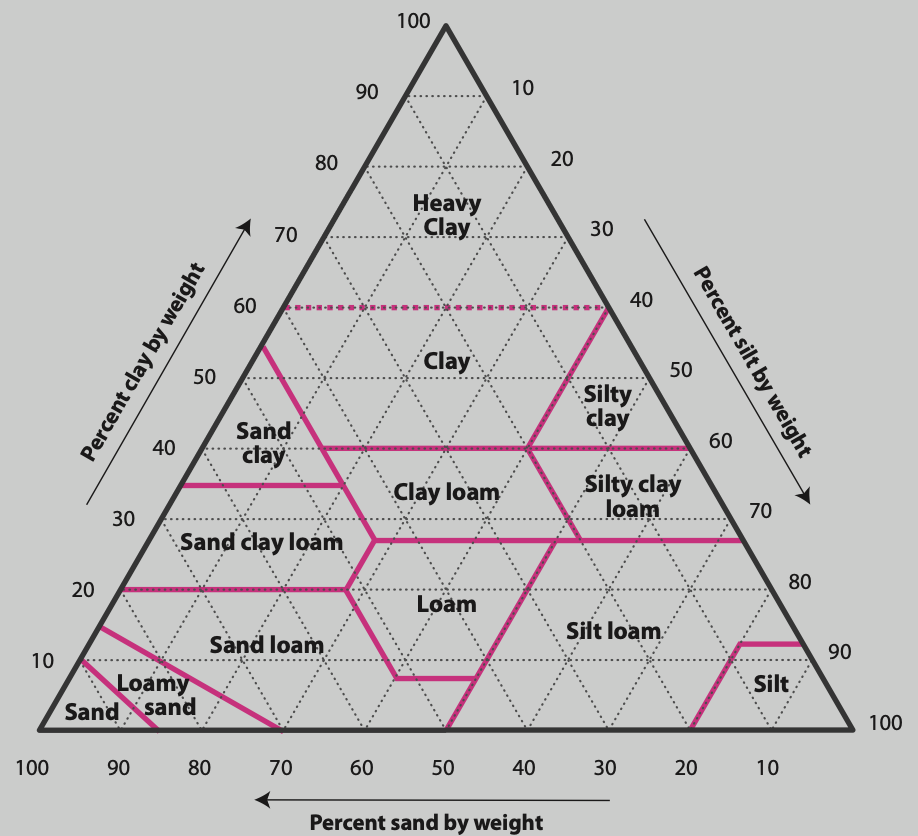
A soil texture triangle can be used to analyze the soil composition but further work will be needed to accurately replicate the mixture of sand, clay, and silt in the soil to add to the testing system. This will ensure the exact particles contribute to gasket deterioration.
Test Stand Installation:
Additional work needs to be done to install the system at Harbec. This includes wiring a 220 V outlet to support a Harbec chiller, assessing OSHA safety regulations, working with the IT department to set up a text-message alarm system, ensuring proper air exchange in the room, and installing a live webcam.
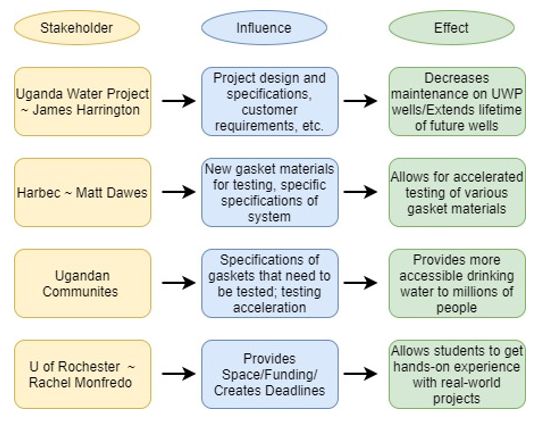
Stakeholder Analysis:
The stakeholder analysis for the project is shown in the figure below.
Acknowledgments:
We would especially like to thank Rachel Monfredo, Doug Kelley, Mark Juba, Jeff Leffler, Jim Alkins, John Lovito, James Harrington, and Matt Dawes for helping guide us through this project to make it happen!
References
[1] “Give Water. Give Life.” Ugandan Water Project, ugandanwaterproject.com/.
[2] “Soil Textures.” SoilSensor.com, 24 Sept. 2018, soilsensor.com/articles/soil-textures/.
[3] Kelley, Fred D, University of Rochester Chemical Engineering Department, 1 May 2021.