Project Background
Water system design requires an estimate of water pressure throughout the system. The pressure is often termed “head”, which refers to the vertical height of a column of water that would generate that pressure. Water pump specs will often detail the head, with a pump with 150′ of head able to pump water straight up 150′. Knowledge of the system head enables a designer to pick equipment with proper specifications and model system performance.
Unfortunately, system head can be complicated to model. Height, pipe diameter and length, and much more factor into the estimate. As such, collecting relatively accurate data on the relative heights of points in a system is important.
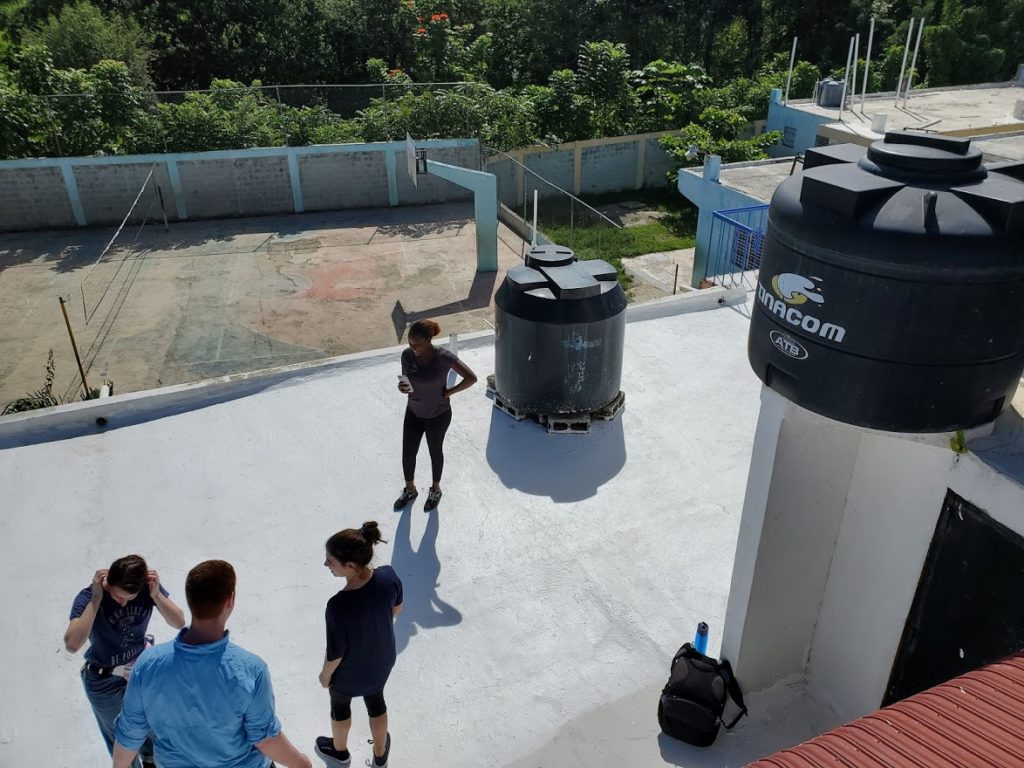
The University of Rochester Chapter of Engineers Without Borders implemented a water chlorination system at a K-8 school in Don Juan, Dominican Republic. The water system includes multiple buildings of various heights, and pumps water from a cistern into water tanks stored on the roofs. The six tanks are all at different elevations, and surveying data of the school does not exist. To make matters worse, the school is on a slope, so building height does not equate to relative height of the tanks.
Current methods for relative altitude surveying have significant drawbacks. Laser rangefinders require line-of-sight between points. Surveying GPS units are expensive or inaccurate. Water levels are cumbersome to travel with and use.
The surveying altimeter is a cheap, portable, and easy-to-use method of determining the relative height differences between points of interest.
Design Overview
For our design, we started with looking at what data we might need in order to accomplish low-cost vertical surveying. By knowing what data we wanted, it informed our sensor choices, which led to a physical layout on a PCB design. This is what led to our final form factor.
In our initial proposal, we landed on two main sensor types that we would need. The first was a GPS, and the second was a pressure sensor/altimeter. In addition to this, we needed a microcontroller to orchestrate everything, a battery management system to handle power, and an SD card reader to store the data. This led us to have 4 IC modules around the same size, along with a low-cost Arduino. Additionally, we added an LCD display to show the user the current status. Once we had verified that all of the selected modules would work together with their various communication protocols, we set to work testing the system on a breadboard and working towards a PCB design. This was done in parallel due to the significant lead time in ordering a custom PCB.
Once we had the system assembled on a PCB, we started work on building a software system to allow us to get the data that we needed. Additionally, we started work on an enclosure for the system to house the system I/O. During this process, we discovered the issues surrounding the reliability of the GPS data we receive from the small, low-cost module we selected. We had originally hoped to use the GPS data to correct for drift in the altimeter, however, after testing different data processing techniques with little success and consulting professors, we decided to take a different route.
The next idea was to use one device as a base station, which would enable us to measure the drift with one stationary device and offset it later. However, we needed to be sure that both sensors drifted in the same way. Next, we worked towards collecting data from the altimeter by creating a test setup that could be run over long periods. By performing tests over the course of an entire day, we determined that while each sensor drifts, they generally drift in the same way. This allowed us to not use the GPS at all. Lastly, we reconfigured the software to enable easy setup and deployment of the devices, and even switch which one is the base station with no configuration. We also continue to improve the software around offloading and processing the data.
For context, altitude in meters above sea level can be determined from a pressure measurement in hPa by:
Altitude = 44330*(1-(Pressure/1013.25)^0.1903)
Results
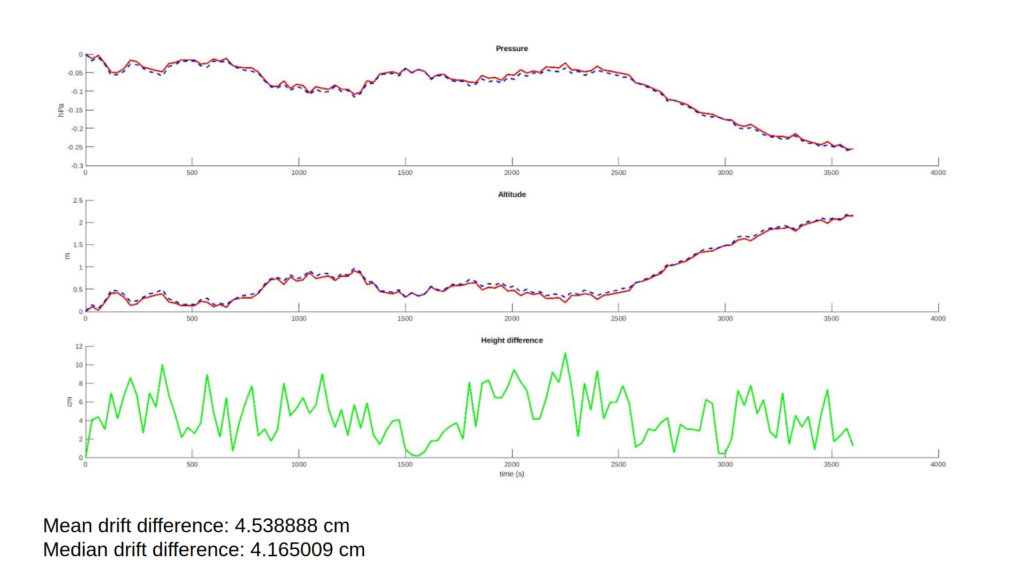
The pressure drift measured by two devices was determined to be quite similar across one hour, the intended operation time. The mean and median in drift difference between two modules ranged from ~2cm – ~11cm over the course of one hour across 11 trial runs. For each trial, the pressure was logged on each device every second, with devices not moved during data logging.
Once the drift was determined to be suitably consistent between modules, the use case was tested.
A five minute long sample data collection experiment was conducted measuring the height change between landings on outdoor stairs. One module was left at a single height, while the other was moved to points of interest. Corrected and uncorrected height in meters is shown below.
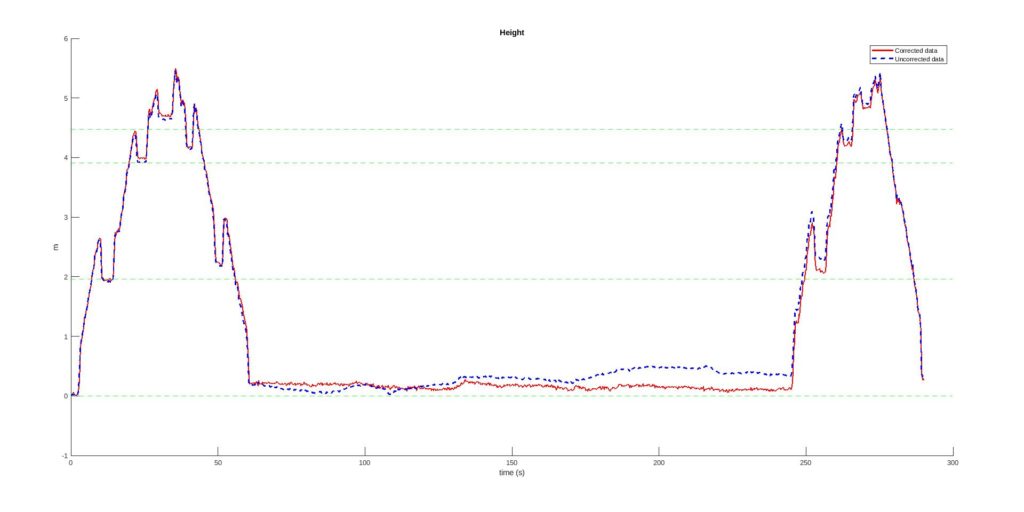
The corrected data’s improved accuracy over time is evident. The height in this trial drifted upwards, and was corrected by the base station’s readings back towards the expected measurements significantly after a mere 2 minutes.
Hardware
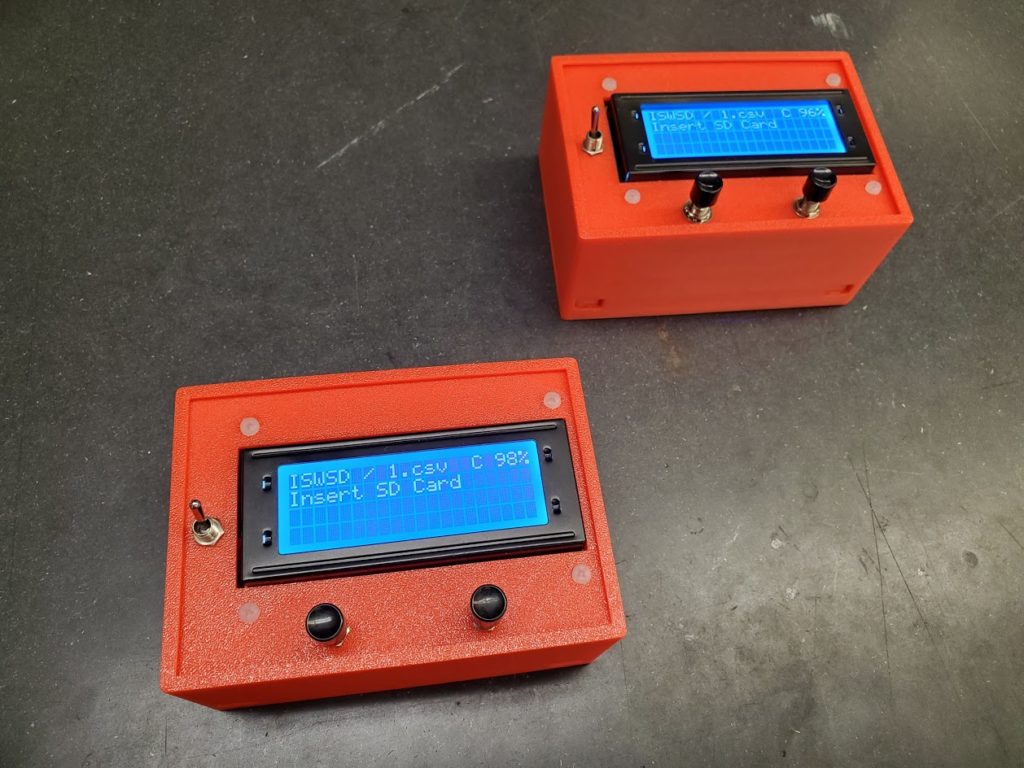
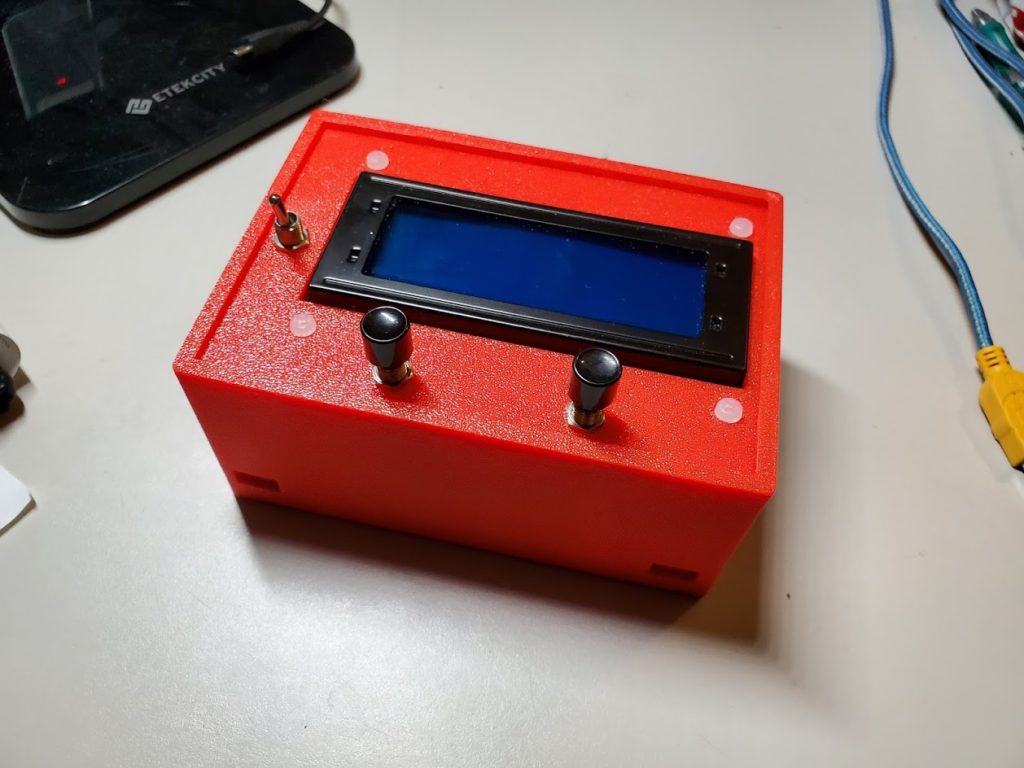
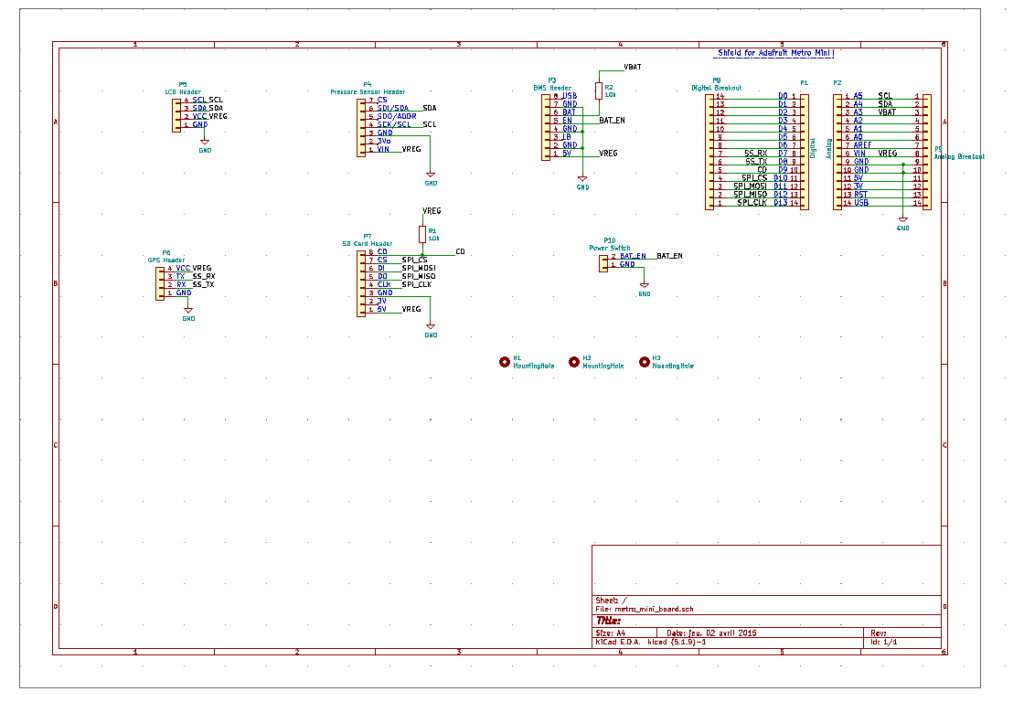
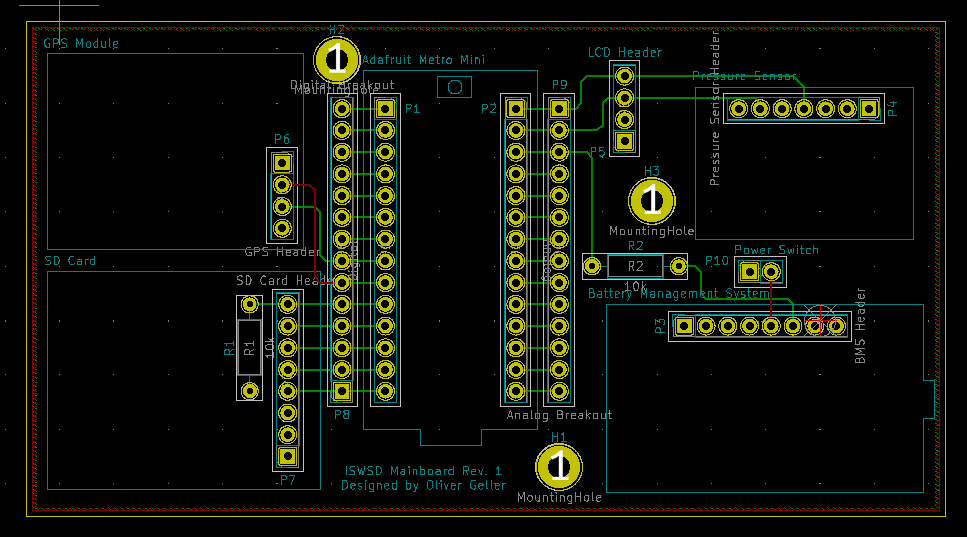
The hardware consists of a group of IC modules soldered to a PCB, which is itself mounted in a 3D printed casing. Buttons and a power switch were installed on the case for user input.
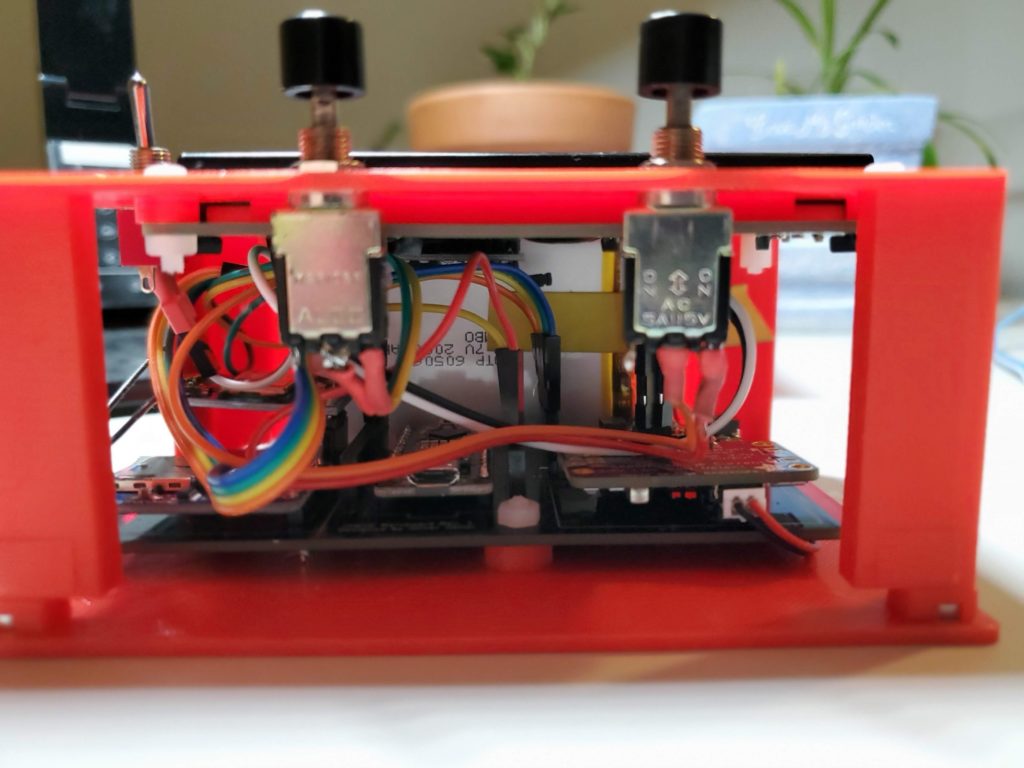
The small Arduino METRO Mini is the microcontroller that executes the firmware and communicates with other IC modules. A barometric pressure sensor, the DPS310, was used to read the pressure in hPa.
A 20×4 backlight LCD with I2C interface displayed the current state of the device to the user, and an SD card reader was used for data logging. Each SD card has the current pressure written to a file at a frequency of 4Hz, with important points of interest flagged in the file.
Finally a battery management system, with a rechargeable 3.7V LiPo battery powered each module.
- Adafruit METRO Mini 328 – $12.50
- Adafruit DPS310 – $6.95
- Adafruit MicroSD card breakout board+ – $7.50
- Sunfounder IIC I2C TWI Serial 2004 20×4 LCD – $14.99
- PowerBoost 500 Charger 5V LiPo – $14.95
- Lithium Ion Polymer Battery – 3.7v 2500mAh – $14.95
- Custom PCB – $5
- Total: $76.84/module (not including case, buttons, wires, etc)
Software
The Arduino firmware was written in C++ using the Arduino IDE and Arduino libraries. The firmware overall operates using a state machine to keep track of the device’s state. This is done using an enum to manage the different state types, and a global structure to hold information about the current state, previous state, and other information that needs to be kept between states. Additionally, there are two switch cases in the main loop that look at the current state of the enum. One handles the current state actions like displaying to the screen, etc., and the other handles state transitions.
The software uses various libraries provided by Arduino and Adafruit to communicate and manage the different modules. There is a library for the SD card, LCD display, and pressure sensor module. The only module without a library is the battery management system.
One of the states is used to ensure that the two devices are started at the same time and the next state starts a 4Hz interrupt timer, which then gets and logs data. Additionally, the state machine can signal to the interrupt timer that a button was pressed, which indicates the user wants to flag a point. This provides both continuous data and specific points that the user wants to look at later.
The code and any relevant documentation for the modules can be found on our GitHub page here: https://github.com/aeleos/ISWSD
Second Generation
We designed initially to have the surveying device be a single module, not a pair. Issues with barometric drift as a result of environmental changes in weather forced the adoption of a two-module unit. A potential second generation surveying unit could be designed with multiple modules in mind from the beginning.
Such a design could implement a module with an Arduino long-range radio transmitter as a base station, which stays stationary and transmits the pressure that it reads. Then multiple modules with corresponding receivers could be taken to points of interest, and when logging data, record the pressure difference observed by the base station to be used in drift correction. Such a change would require changes to both the hardware and software that preclude us from developing it this semester.
Team
- Andrew Balogh
- Oliver Geller
- Professor Jack Mottley – Advisor
- Professor Daniel Phinney – Advisor