
Team
- Cruz Garcia
- Chelsea Rodriguez
- Charlotte Spaulding
Mentor
Brandon Zimmerman
Abstract
The Clear Eye Exam allows for users to take an eye exam from their home and obtain an eye prescription. This lets people have an eye doctor’s appointment without the hassle of traveling and booking an appointment.
Our team worked on adding to what this package can offer by setting up a frame fitting feature. This allows users to see how frames will look on them similar to a social media filter as well as get measurements needed to get well fitting frames.
Vision
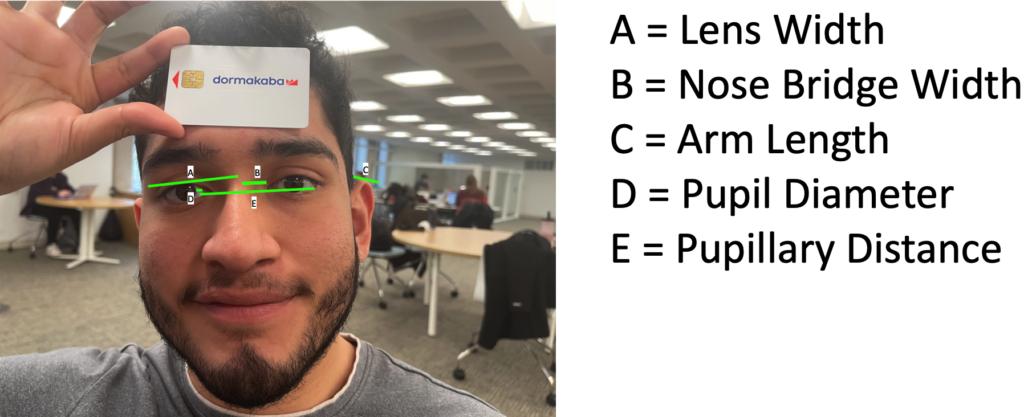
The desired product is a software package capable of determining the aberrations present in the user’s vision thereby also determining the eyeglasses prescription required to correct the user’s vision. In addition it will measure the physical landmarks of the user’s face via the computer’s camera to determine the overall lens-frame fit. The “overall lens-frame fit” refers to a range of possible frame dimensions that would fit the user. Physical landmark measurements include lens width, nose-bridge width, frame-arm length, pupillary distance, and pupil diameter. Lens width is the distance from the nose bridge to the outside edge of the lens-frame. Pupillary distance refers to the distance between both pupils measured from center to center. With these measurements, we want to create a Virtual Eyecare Platform capable of measuring the prescription and fit of eyeglasses for users.
Observations
We collected data from 25 individuals, manually measuring their lens width, nose bridge width, pupil diameter, pupillary distance, and arm length. Additionally, we took an image of each individual holding a standard-sized card that was then used as a reference in the code. This allowed us to compare the manual and code measurements, all of which are of the same type, except for arm length, which we compared to facial width by calculating the ratio between the two measurements.
After collecting the necessary data, the subsequent step was to conduct a comprehensive analysis by calculating the differences between the code-calculated, and measured distances. For facial width and arm length, we calculated the ratio between the two measurements. The resulting differences were then used to calculate the average and standard deviation.
After this, we then plotted code generated measurements versus our manual measurements. This allowed us to generate a line of best fit and see the correlation between the data sets.
Future Directions
Data Analysis
The linear regression has shown the link between the manually measured and code calculated data. The average and standard deviation of the difference between the calculated and measured data gives a good idea of how much the code needs to be adjusted by.
While this has been a good start for the data analysis, further steps should be taken to get a better understanding of where the measurement code is at:
- K-fold Cross Validation Linear Regression: A k-fold cross validation with 5 folds allows a fit to be created that can be more fit than a standard linear regression, but is not overfit. If something were overfit, it would like like a line graph of the data points, which would not be useful for further analysis.
- Logistic Regression: This is used for classification and prediction analytics.
- Support Vector Regression: This is a supervised learning algorithm that is used to predict discrete values.
Frame Fitting and Measurement Code
The frame fitting and measurement code is off to a great start. We have been able to capture a live video that can output facial measurements important for frame fitting. Along with this we have attempted a basic frame overlay.
The next step would be to take what has been started and improve it into the final product, with a better frame overlay for users to try on frames.