
Team
- Rachel Chan
- Zihao Li
- Sinabu Pumulo
Mentor
Brandon Zimmerman
Abstract
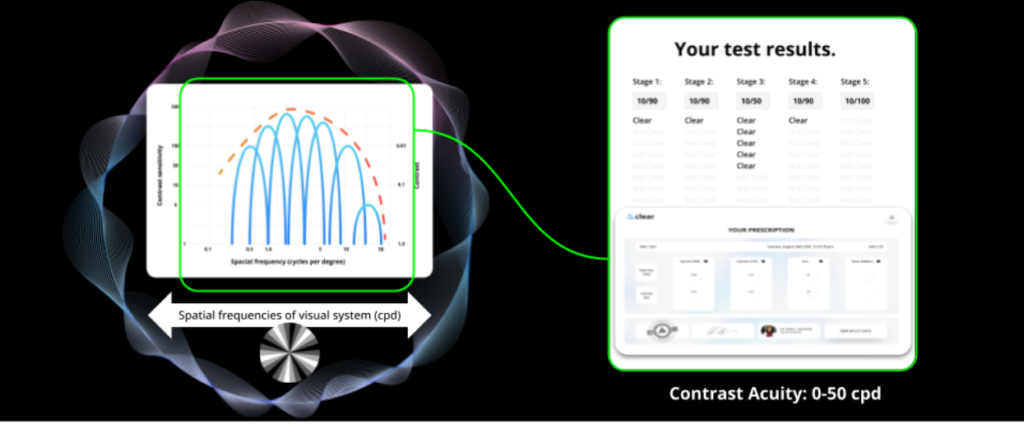
The Clear Eye Test is a virtual eye prescription platform that measures refractive error of the eye with a test that can be taken with just a computer, bypassing the need for traditional optometry visits. It aims to:
1) improve the ease and accessibility of eye care
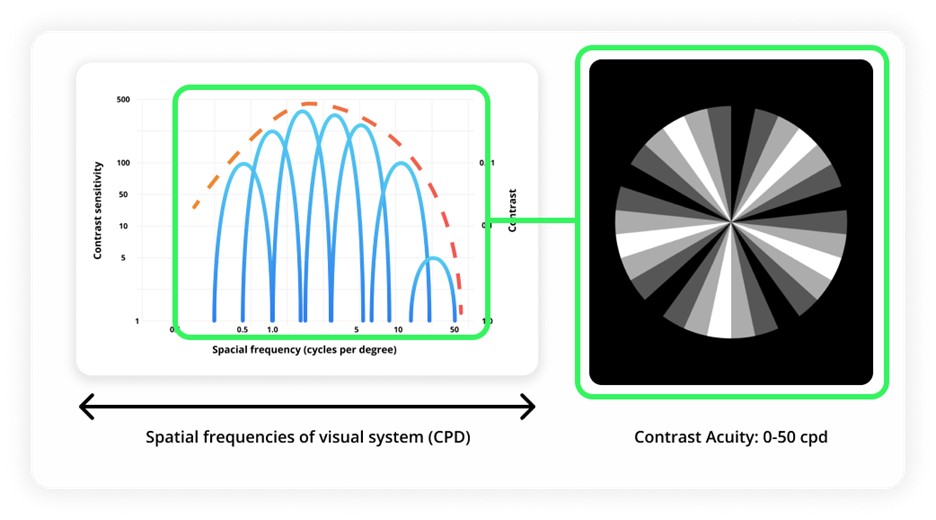
2) provide more personalized prescriptions based on contrast sensitivity
Our team worked on developing algorithms to improve the accuracy of the current platform. We also invited participants to take the test on-site to expand our data size and study the effects of variables—such as room/screen brightness and viewing angle—in a controlled testing condition, with the objective being achievement of clinical accuracy.
Vision
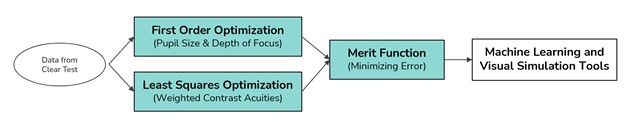
The goal of this project is to optimize the results from the Clear Eye Test using physical optics. These will serve as better informed inputs for the machine learning and visual simulation pipeline in the current platform.
Main factors that affect the initial prescription results include the pupil size, spatial frequency of optotype, and the definition of visual acuity. Taking these into consideration, we aimed to develop an optimization model that can improve the raw prescription estimate using only visual acuity information. To achieve this, the current database is studied and calibrated against clinical 20/20 prescriptions.
Observations
First Order Optimization
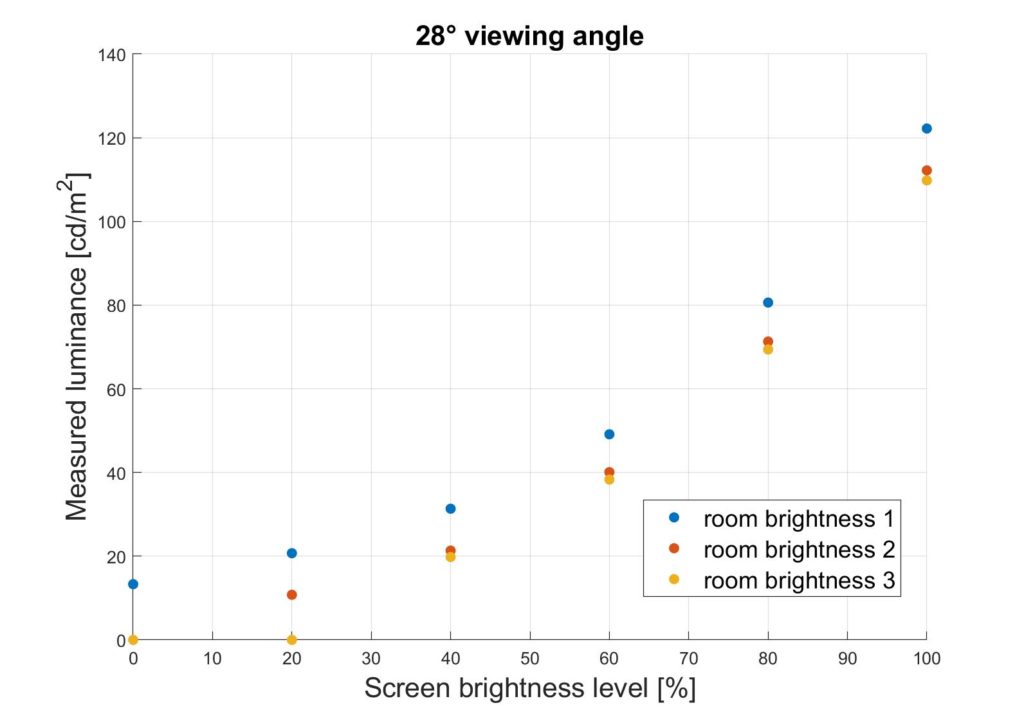
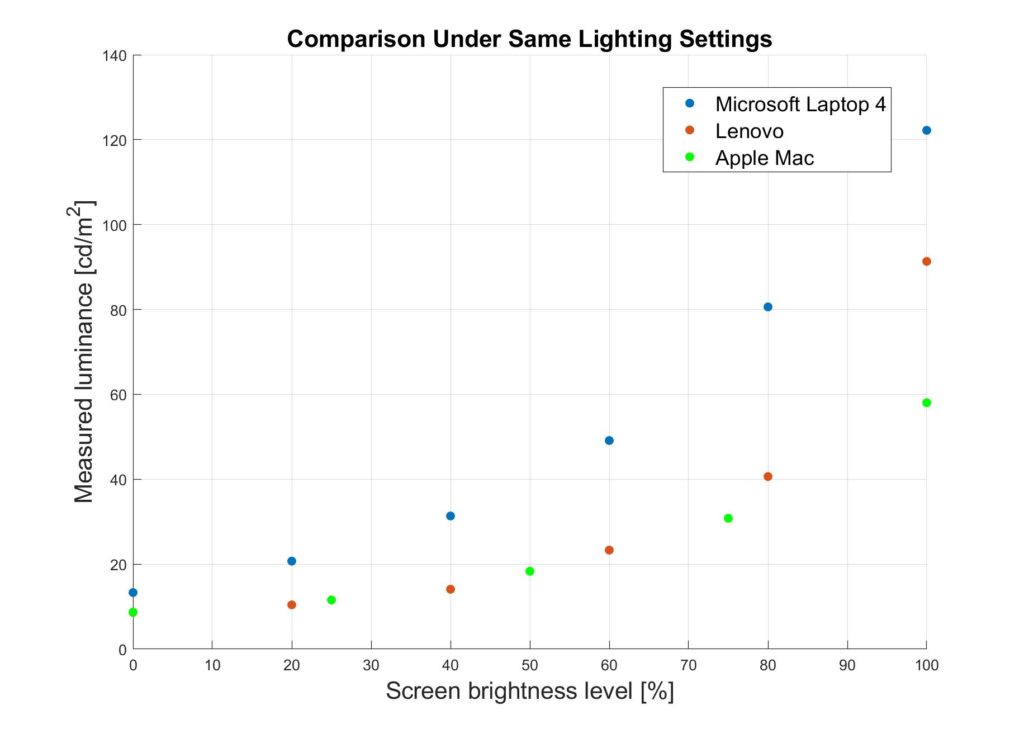
A first order optimization was used to deduce the pupil diameter, which affects the aberrations of the eye, depth of focus, and precision of the initial prescription estimation. This is affected by environmental lighting, monitor brightness, and physiological factors. A preliminary study on the relationship between luminance and pupil diameter was also explored to account for the device-agnostic testing condition.
We found a pre-established mathematical model to express the between pupil diameter of the human eye and the luminance level.
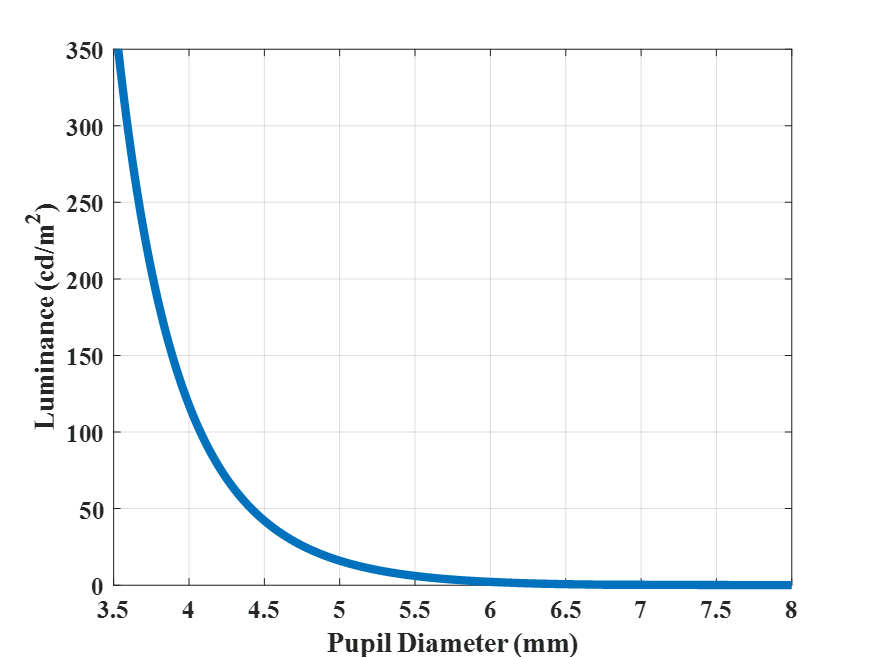
We modelled the trend of luminance incident on the eye at different combinations of room and monitor brightness with a spectroradiometer.
Least Squares Fit
A least squares optimization routine was used to develop an experimental model that best fit the prescription data using a theoretical relationship between acuity and refractive error. An assumption was made that the visual acuity reading can be decomposed into levels of contrast sensitivity.
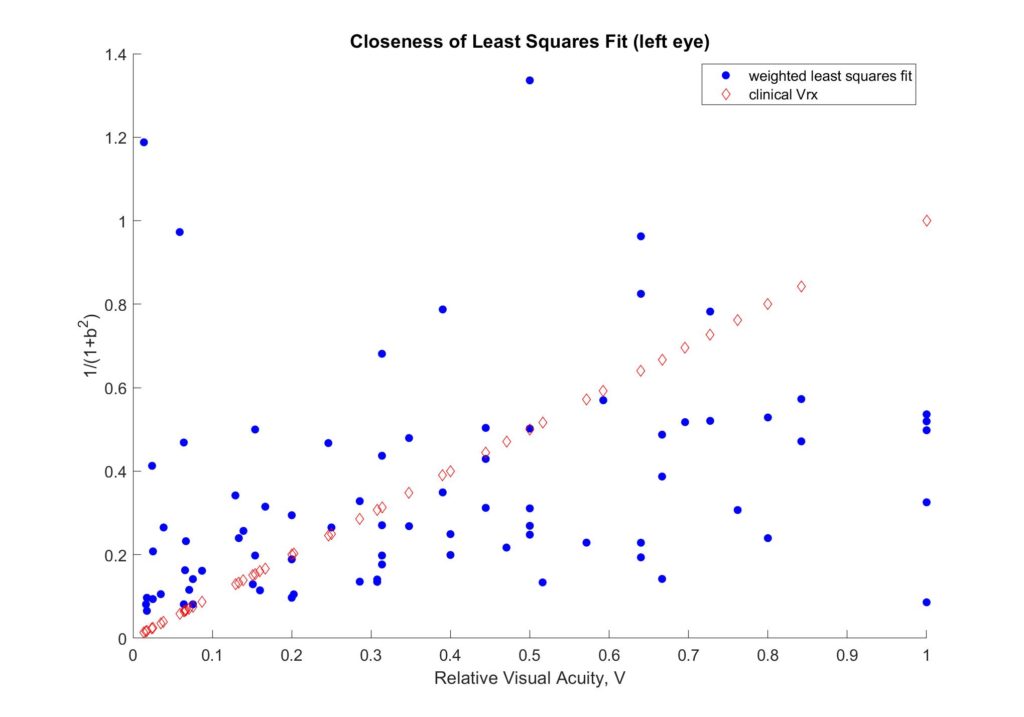
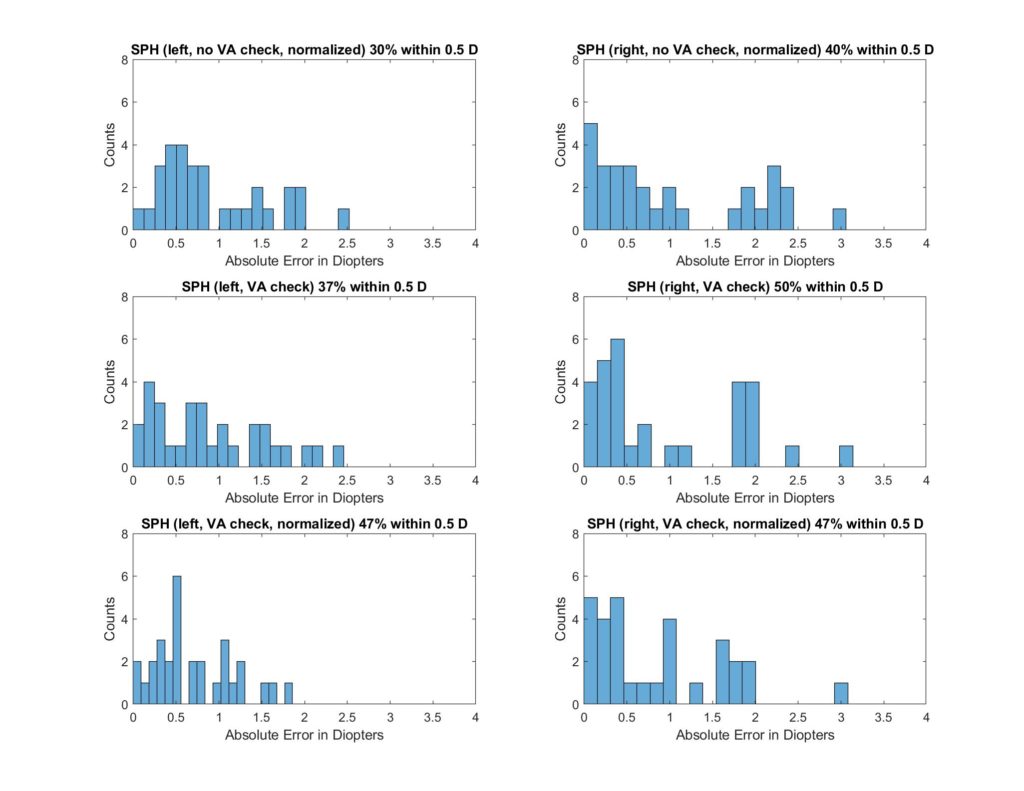
Different approaches were explored to fine-tune the initial assumption. Some limitations that we encountered were visual threshold below which error increases significantly and small training data size. The least squares method is vulnerable to outliers in the data as it will skew the results to compensate for them. The former problem was addressed by preprocessing of the data, and the latter can be ameliorated with more data points. Visual acuity checks were also used to improve the model. The following diagram shows an example of the evolution of accuracy throughout the optimization. The goal is to increase the percentage of SPH and CYL results that are within 0.5 D of clinical prescriptions.
Merit Function
A merit function incorporated the optimized values–which account for user-dependent variations and used trends from clinical data calibration–to select from a range of best prescriptions for each user.
For each nominal value of the blur quantity, b, a theoretical prescription function is generated. Each data point is then compared to its respective data point from the experimental prescription function to generate an error value. The error values produce an array that can be plotted against the b, giving an error distribution. This error distribution determines the minimum error and, hence, the ideal prescription for the user.

The accuracy of the prescription picker was then examined for each eye from a database.

| Left | 60.4% |
| Right | 53.1% |
This is the first phase of the project, and incorporation of the other two optimizations has promise to increase this accuracy.
Future Directions
The optimization routines will be synergized for an improved prescription estimate and integrated into the current Clear platform. The merit function by itself can achieve an accuracy of < 0.5 D up to 64% of the time. The least squares fit has also proven to optimize prescription selection by up to 13%.
Through the initial attempts at developing an optimization pipeline to improve the accuracy of the prescription estimate, we noted few important trends that should be further studied.
- Increase data size: the convergence of the least-squares optimization is heavily dependent on the characteristics in the training data set. Running it across the whole population might be too general to extract any useful trends. For reliable conclusions to be made, further attempts on optimizing for different demographics (e.g., age, severity of refractive error, etc.) could yield promising trends.
- Incorporate eye models: we noted the assumption that the refractive error comes solely from the cornea, which is only part of the picture, as there can be variation from depth of focus, axial length, and accommodation. This could possibly bring up the maximum accuracy that we can reach with these methods.
- Optimize by axis of astigmatism: it was noted throughout the development process that the cylinder values do not respond as well to the blur quantity for refractive error. Further work can be done on improving the contrast optotypes for astigmatism and to separate the users based on their axis of astigmatism.
- Explore new contrast sensitivity models: the current method is based on an established relationship between refractive error and visual acuity, but there might be an improved model that includes the role of contrast sensitivity.