

Group Members
Meah Ahmed, Carolyn Kochek, Priscila Passerotti Vaciski B, Lindsey Rudtner

Mentor
Dr. Ross Maddox, PhD, Departments of Biomedical Engineering and Neuroscience at University of Rochester Medical Center
Customer
Dr. Jonathan Stone, MD, Departments of Neurosurgery, Neurology & Biomedical Engineering and the Director of Surgical Innovation at the University of Rochester Medical Center
ABSTRACT
Our team implemented the design of an intraoperative nerve monitoring system that detects and prevents damage to the upper extremity’s peripheral nerves when a patient’s upper body is malpositioned for surgeries longer than 6 hours. Prior to anesthesia administration, the device first monitors a patient’s ‘baseline’ ensemble average of somatosensory evoked potential (SSEP) signal from the upper extremity’s peripheral nerves. Changes in later SSEP recording’s average latency, average amplitude, or a general absence of waveforms are theorized to be signatures of decreased upper-extremity peripheral nerve function and early-onset peripheral nerve injury. Our main goals were to ensure the device is tailored to an individual patient’s baseline recordings, quick in its set up time (<5 minutes), self-contained within an ergonomic apparatus, and consists of a user-friendly interface. This device should work for all adult patients and is meant to be used independently without the assistance of a 3rd party (i.e., an intraoperative neurogenic monitoring team). The exception for which this device is not intended to work are for patients who suffer from prior somatosensory nerve pathologies (i.e., paraplegia or neuropathy).
PHYSIOLOGICAL BACKGROUND
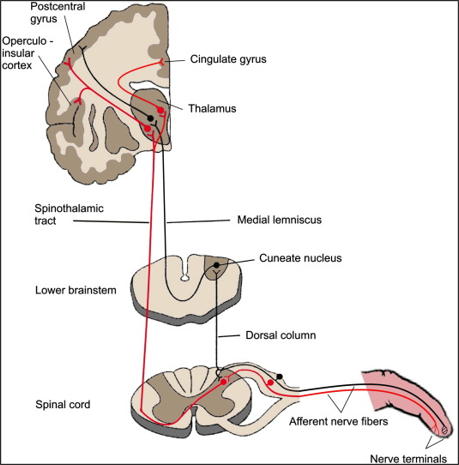
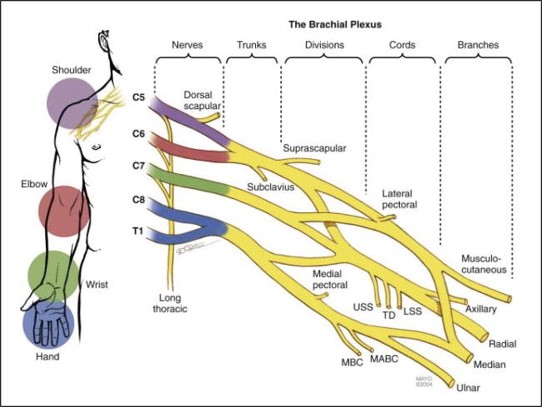
After sensory stimuli at a limb, afferent nerve fibers send electrical signals from peripheral nerves to the brain. This pathway can be seen as shown in figure 1a. In order to isolate pathology in specific parts of this pathway, readings from SSEPs focus on landmark nerve locations such as 1) peripheral nerves (where stimulation usually occurs), 2) brachial plexus 3) dorsal root entry zones at various spinal cord levels, 4) cuneate fasciculus, 5) dorsal column, 6) cuneate nucleus of the brain stem, 7) spinothalamic tract, 8) thalamus, 9) thalamocortical radiations, and 10) the primary sensory cortex. Our implementation focuses on SSEPs of the brachial plexus; the 5 terminal branches of the brachial plexus are the musculocutaneous, median, ulnar, axillary, and radial nerves. The anatomical structure of the brachial plexus can be seen in figure 1b. The brachial plexus is a network of nerves that innervates the shoulder, arm, and hand, by supplying afferent or sensory nerve fibers from the skin, as well as efferent or motor nerve fibers to the muscles, and there’s a brachial plexus on each side of the body. By detecting anomalies of SSEPs in the brachial plexus, peripheral nerve injuries of the upper extremity can thus be detected.
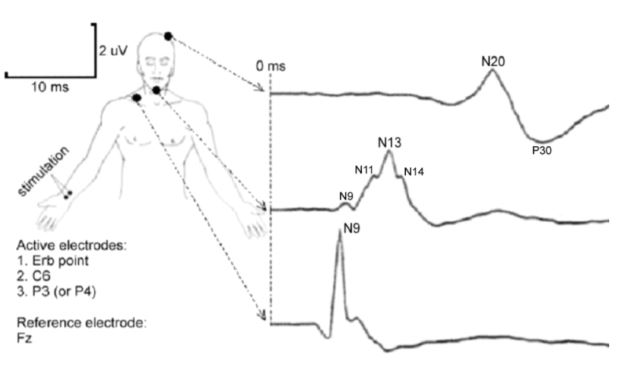
SSEPs of the upper body follows a common schematic based on clinical standards [3]. Electrophysiological stimulation consisting of pulsatile square wave electrical stimulations (100-200µs duration) with a stimulation frequency of <100Hz and stimulation current of <20mA is often used to propagate SSEPs. To measure SSEPs of the upper body, common nerve locations are the brachial plexus (Erb’s point of the upper extremity), C6 (spinal innervation for wrist extension), and P3 (or P4) parietal region of the brain (following the 10-20 EEG system). These regions are subdivided as the peripheral, subcortical, and cortical landmark regions for SSEPs, respectively. Such a schematic can be seen as shown in figure 2 below.
Peripheral nerve transection or ‘nerve crush’ produces distal degeneration of axons and their myelin sheaths, a process called ‘Wallerian’ degeneration [4]. Peripheral nerves have both exogenous and endogenous blood-supply systems, so during intraneural hypoperfusion (ischemic insult), inadequate blood flow supply to innervations commences. This results in a hypoxic intraneural environment that drives Wallerian degeneration. Furthermore, intrafascicular edema also commences, which is defined by edema collection of the vascular bundle (exogenous and endogenous blood supply within innervated microvasculature). An increase in edema also results in increased intraneural pressure, further driving mechanical nerve compression. Nerve compression, in particular, can cause mechanical deformation, or interruption of perfusion (ischemic insult), and subsequent injury to the peripheral nerve. A typical example of compression-related injury is ulnar neuropathy in patients with a supinated arm on a rigid arm-board, or “Saturday night palsy” (radial nerve injury resulting from falling asleep with one’s arm hanging over the armrest of a chair), manifesting as wrist drop, hand and finger numbness, and inability to straighten the fingers due to prolonged compression of the radial nerve. In the case of our device, we are using SSEPs to detect perioperative peripheral nerve injury (PPNI). Nerve compression injury represents 12% of general anesthesia malpractice claims since 1990, and nerve injuries of the upper extremities make up ⅔ of such claims [4]. The clinical outcomes of PPNI are chronic neuropathic pain, motor deficits, or paralysis. Patients with the highest risk of PPNI are those who go through cardiac surgery, neurosurgery, orthopedics, and general surgery (generally lasting > 6 hours) [4]. Furthermore, patients with hypertension, diabetes, and smoking history are also at high risk for PPNI [4].
DEVICE DESIGN GOALS – CUSTOMER USE SCNEARIO
- Develop a device that can detect nerve damage due to surgical malpositioning.
- Focus on the brachial plexus and ulnar/radial/median nerve damage.
- Patient-specific monitoring based on unique patient baseline measurements.
- Reduce the need for intraoperative neurogenic monitoring (IONM) team and 3rd party technicians needed to interpret the data.
- Universal application to any surgery longer than 6 hours.
- Equitable accessibility.
Seen in figure 3 below is the customer-use scenario of our device to fit the primary needs and wants of our device.

IMPLEMENTED CIRCUITS – SYSTEMS LEVEL DESIGN
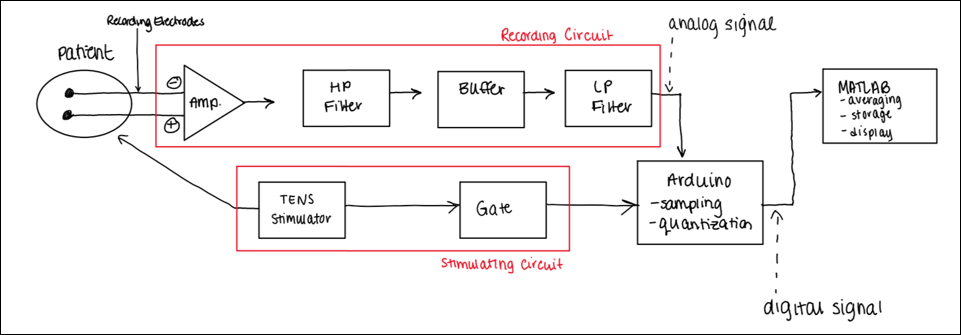
Our design consists of a transcutaneous electrical nerve stimulator (TENS) to stimulate the median nerve, a recording circuit to measure SSEPs from the upper extremity (i.e., brachial plexus), and a MATLAB GUI interface (software) to analyze and visualize changes in SSEP signals. The recording circuit consists of an Arduino microcontroller to trigger stimulation onset, receive analog SSEP recordings (in I2C quantization) for each epoch of electrophysiological stimulation, and transport the recorded signals to MATLAB (software) via serial port communication in a computer. Ag/AgCl bipolar surface electrodes were employed for recording; needle electrodes were avoided due to their high impedances, risks of unintended nerve insult, and long setup times. An SSEP signal is propagated by an electrophysiological stimulus, and an almost instantaneous recording (60-80 ms after stimulation) becomes possible [5]. Stimulation allows for increased sensation, and thus the sensory nerves fire via the somatosensory pathway seen in figure 1a.
The Recording Circuit
For the recording circuit, the propagated SSEPs were amplified via an instrumentation amplifier (10x gain). The signal was then processed through a first-order active high-pass filter with a cut-off frequency of 70Hz, and unity gain (remove DC noise). The output signal was processed through an active high-impedance buffer and processed through a first-order active low-pass filter with a cut-off frequency of 3000 Hz and gain of 100x (remove myogenic activity). The analog signal was processed through the microcontroller.
The Stimulation Circuit
For the stimulation circuit, the TENS stimulator was controlled by the microcontroller using an electromechanical relay. This allowed us to control the stimulator using binary ON/OFF switches via MATLAB’s serial port communications. The TENS also interfaced a comparator operational amplifier to detect stimulation triggers (square wave pulses of 2Hz and 100μs duration) for which epochs of SSEPs were collected. For each square wave pulse that was sent from the TENS to the microcontroller, an ‘onset’ of stimulation was detected for which recording was propagated; an ‘onset stimulation triggering’ schematic was configured for which, as soon as a trigger was detected, analog samples defining one epoch of an SSEP signal was recorded by the microcontroller. The subsystems defined by the recording and stimulation circuits can be seen as shown in figure 4a.
The Software
Our software is composed of two parts: a data collection module, and a data processing module. Our data collection module consists of the Arduino microcontroller that collects data at its maximum sampling frequency (9600 Hz, which is 2x greater than the highest frequency of interest to meet Nyquist’s sampling theorem). The microcontroller’s software is composed in its native C++ language to configure its analog and digital pins for data communication between the microcontroller and the serial port. Data that is communicated to the serial port is analyzed by MATLAB, which is our primary software of interest. Our program in MATLAB specifies when the microcontroller should start collecting data (and initiate nerve stimulation) and send it back to the program for post-processing analysis. Following data collection of SSEP epochs, the data is averaged and plotted on our user-interface module.
The number of SSEP epochs that are collected and averaged for plotting and display is defined as the ‘ensemble average’. If, for example, 250 SSEP epochs are averaged, √250 (or 15.81) is the factor for which the signal-to-noise ratio is improved. For example, if the signal-to-noise ratio is 0.1, after the ensemble average, the signal-to-noise ratio becomes 1.58.
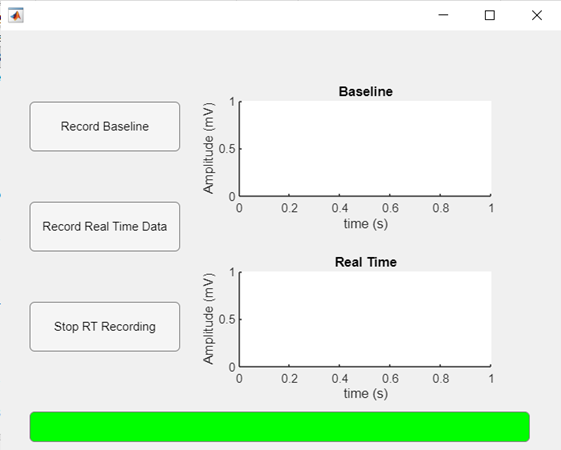
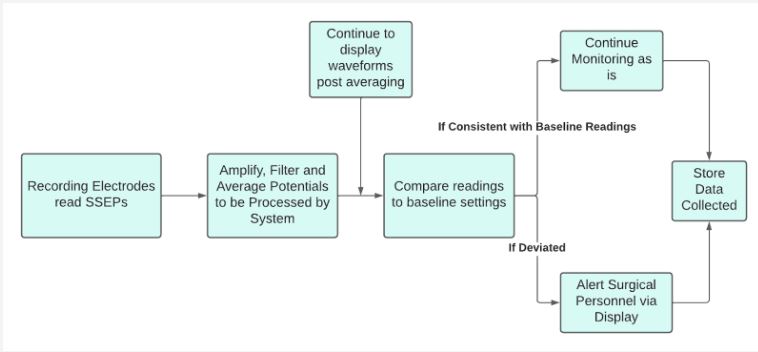
MATLAB also compares the real-time measurements with the baseline data to determine if PPNI is present through anomalies on SSEPs. Our user interface module, which can be seen as shown in figure 4b, features a baseline and real-time measurement window. The physician would first acquire the baseline data (prior to administration of anesthesia and surgery), whose ensemble average would then be plotted for reference. Then, the physician would start the real-time data recording, which would be run during the whole duration of the surgical procedure. The real-time plot would be updated as each new recording is obtained, and any abnormal waveforms would be visualized. The real-time data would be compared to the baseline data, and if any abnormalities are detected (drop-in amplitude or latency), a bar at the lower end of the screen would turn red and the words “NERVE COMPRESSION DETECTED” would appear, indicating the patient should be repositioned. At the end of the surgery, the physician would be able to stop the recording and remove the device from the patient. This pseudoalgorithm’s schematic can be seen as shown in figure 4c.
RESULTS AND EVALUATION
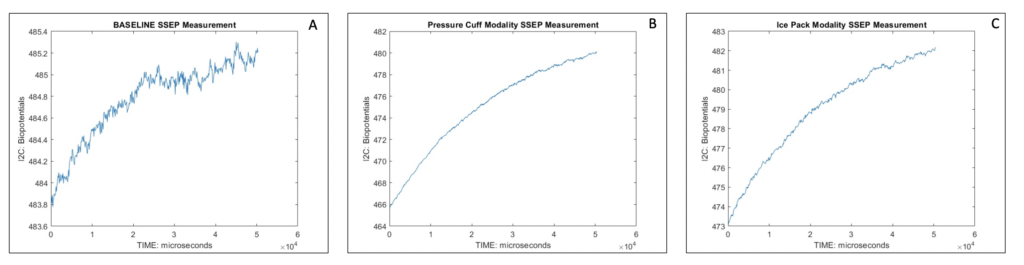
In order to test the device, 5 separate sets of data were collected via MATLAB’s output ensemble average of SSEP readings. Each set consisted of recording SSEPs at the brachial plexus with three different modalities. For each set, first, an ensemble average of the baseline SSEP data was collected; the baseline SSEP reading was defined as a patient who is relaxed, neurologically healthy, and in a state prior to administration of anesthetic agents. Then, an ensemble average of the ‘pressure cuff’ modality SSEP data was collected, as well as of the ‘ice pack modality’; the subject was told to wear a pressure cuff on the arm where stimulation occurs and expand the cuff to its maximum capacity, or wear an icepack on the arm, until sensations of “numbness and tingling” commenced. These modalities simulated intraoperative surgical malposition and subsequent perioperative peripheral nerve injury. For each of the 15 SSEP signals produced, the rms() function in MATLAB was used to output the quadratic mean of the signals. A one-way ANOVA for each of the 5 signals, across the 3 groups, resulted in a rejection of the null hypothesis and acceptance of the alternative hypothesis that at least one of the modalities (baseline, ice-pack, or pressure cuff) had a mean rms that was different from the other (P<0.05). Illustrated in figure 5 below, a sample set of the SSEP signals.
FUTURE DIRECTIONS
In the future, there are multiple changes that would make for better results. The first is that we would need an instrumentation amplifier with a higher common-mode rejection ratio (at least 80dB for 10,000:1). Our current instrumentation amplifier cannot handle the noise reduction of the excessive myogenic activity and the large stimulus artifact that is present.
Additionally, we would change the analog to digital converter (ADC) that was used in the circuit. Our current ADC has the desired sampling rate speed, but only has an 8-bit resolution. We would need an ADC with at least a 12-bit resolution. For example, let’s say, the resolution of our ADC circuit is 12-bit and the reference voltage is ± 5 V. In this case, the sampling range will be (5 + 5) volt / 212 = 2 mV/bit, which indicates that the circuit will detect the amplitude changes ≥ 2 mV. Since an amplitude value of 0.1 µV in an evoked potential recording can reach a value of 10 mV after undergoing 100,000x amplification, an ADC circuit of 12-bit can easily detect that signal and convert it to a digital value. However, if we use an 8-bit ADC circuit, because the sampling range of this would be (5 + 5) volt / 28 = 39 mV/bit, a 0.1 µV change in the evoked potential wave or amplitude will not be detected, and thus will be eliminated. A minimum of 12-bit voltage resolution is a standard for SSEP instrumentation
Due to not grounding the subject, there is a huge artifact making it difficult to read SSEP evoked potentials. If provided with more time, which was largely impeded due to COVID-19’s chip-shortage and online learning modalities, we would use plate or band electrodes to ground our subject to the circuit following TENS stimulation. In addition, if we were aware of the exact frequencies at which the noise that causes the artifact was occurring, we could have also implemented an additional filter. In surgical operating rooms, they employ the use of a built-in automatic artifact rejection procedure to reduce this noise.