Team Nimbus Members:
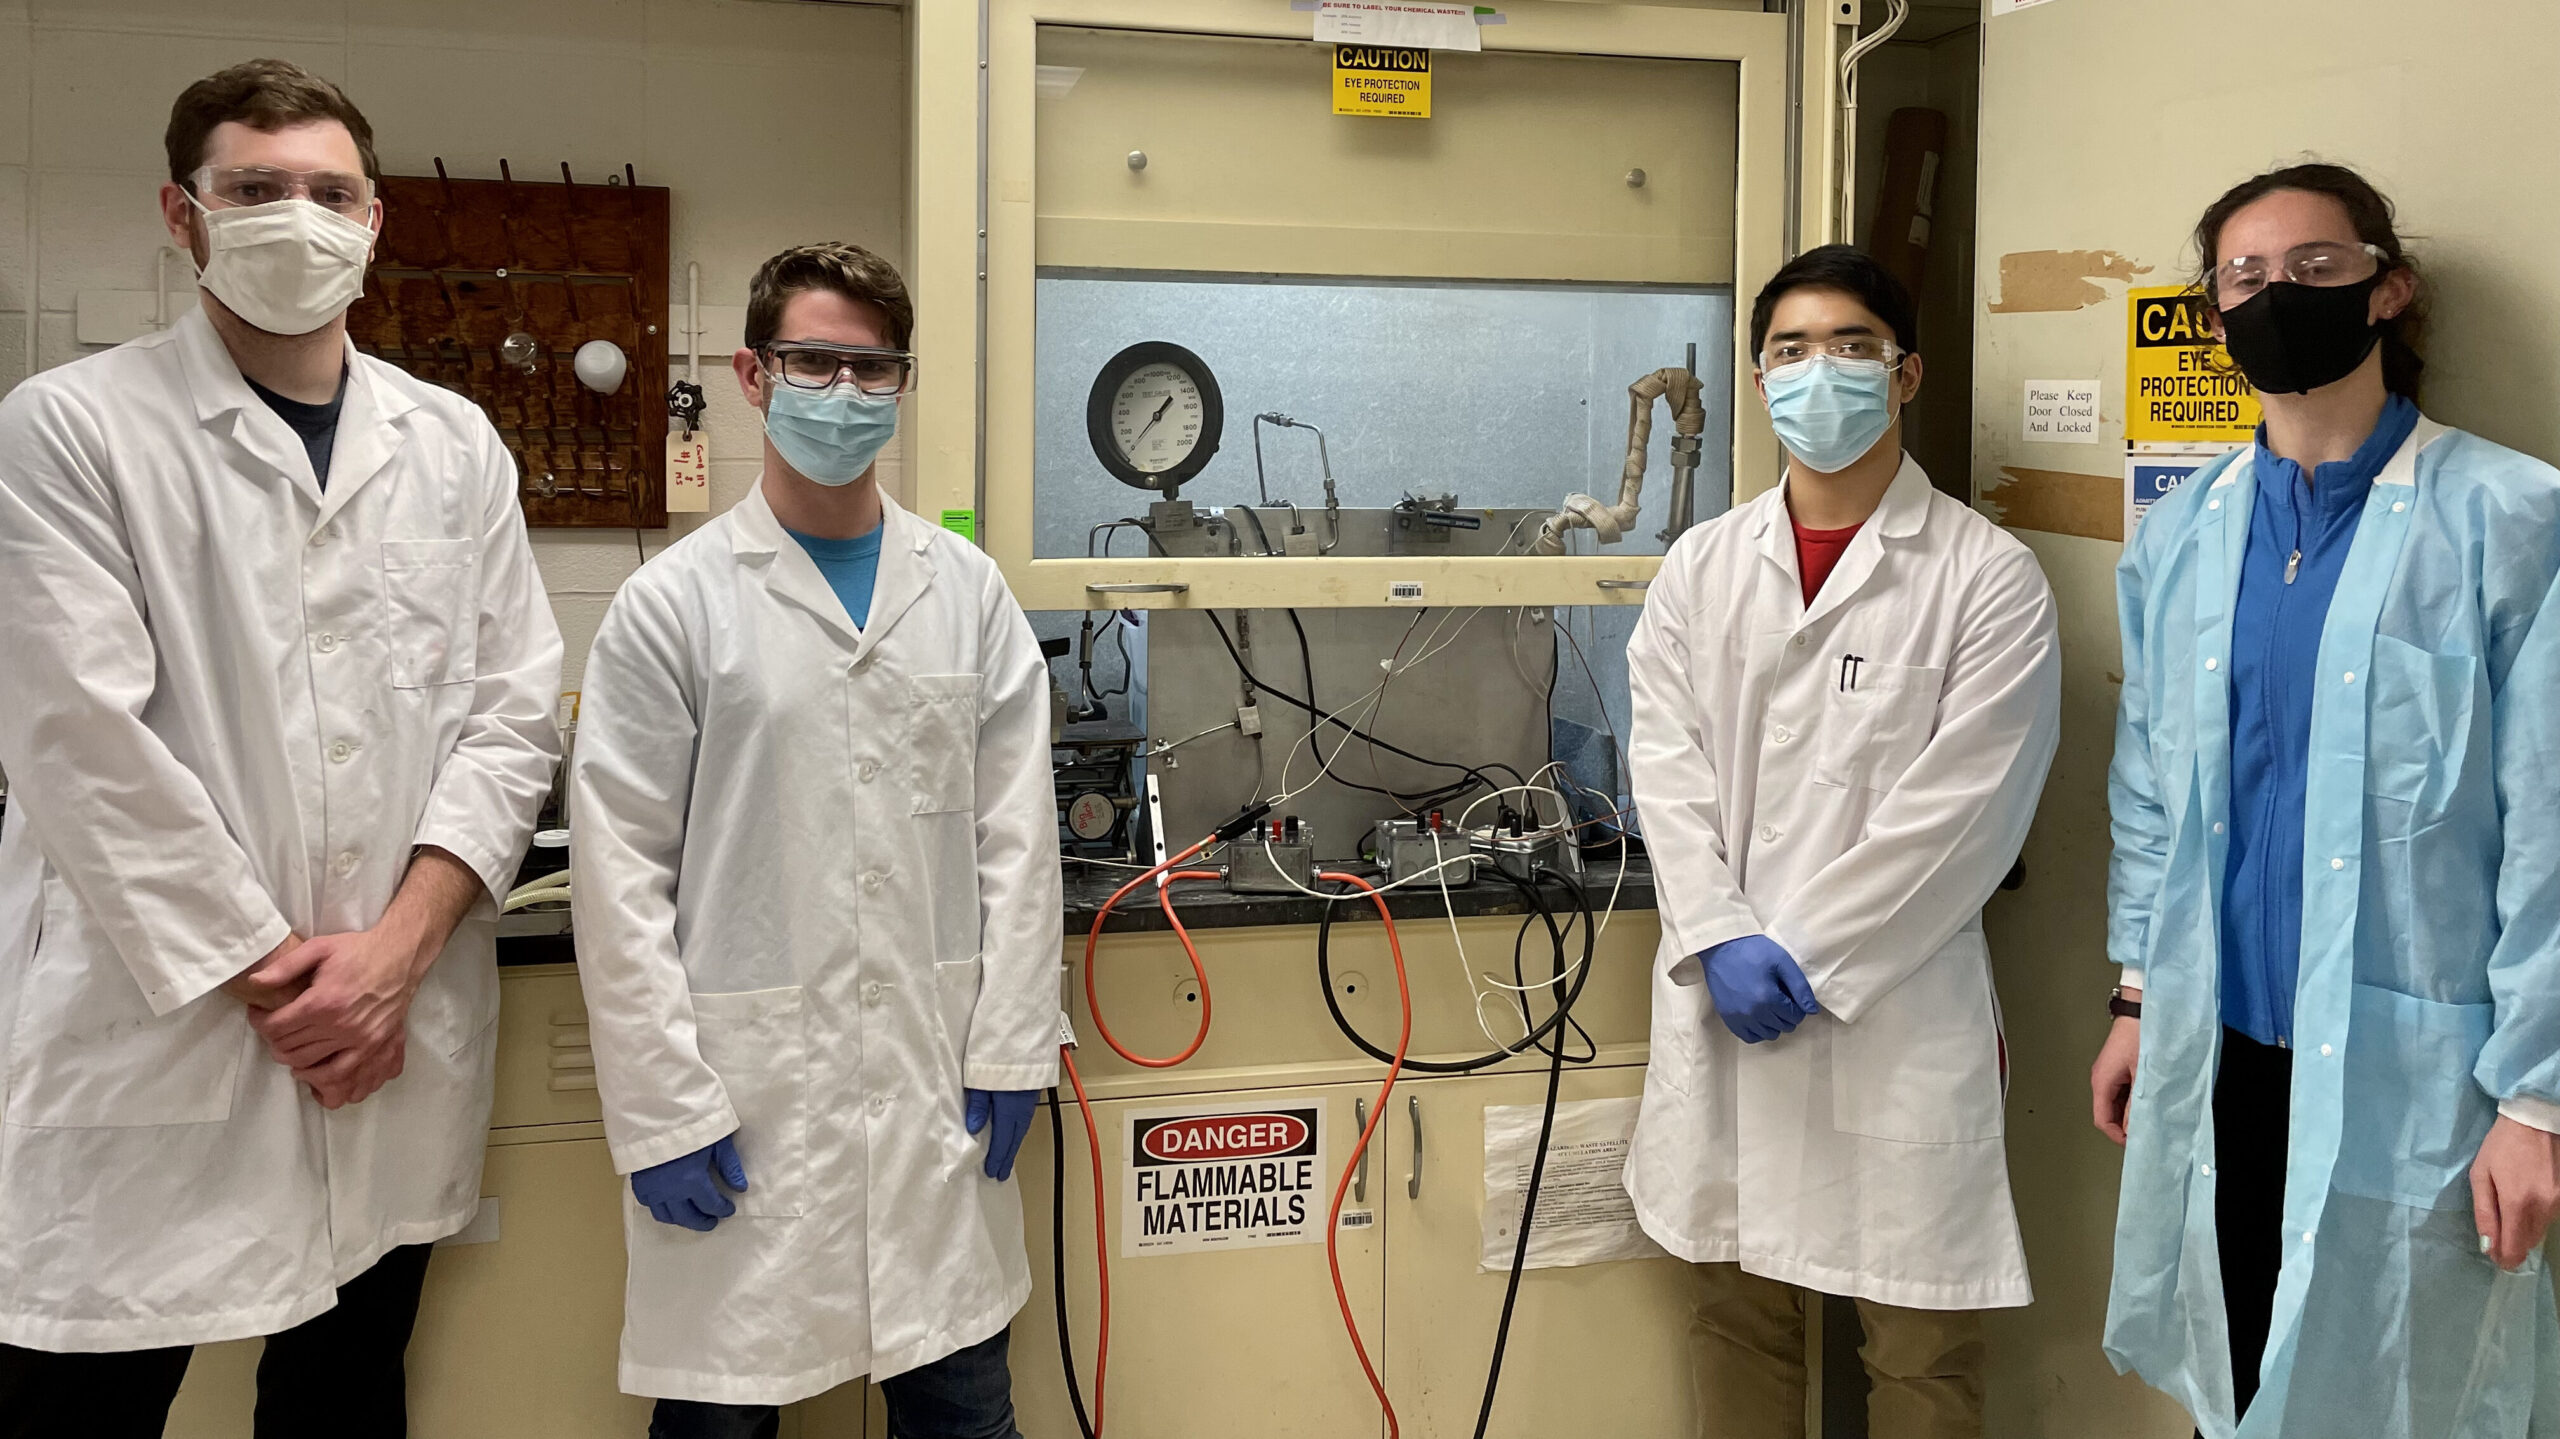
Allie DeRubertis, Colin Ikei, Bryan Schellberg, Mark Volkin
Faculty Mentors:
Prof. Melodie Lawton and Prof. Doug Kelley
Project Sponsor:
Chris Wolfe (Xerox)
Xerox is developing a process which uses viscous polydimethylsiloxane (PDMS) to shape other molecules. Heptane is used to swell the PDMS and release the desired product for collection, producing a 7:1 heptane to PDMS waste stream. If the components can be separated efficiently, they can be recycled back into the process allowing for large financial savings and a reduced environmental impact.
This project focused on developing a process capable of separating and collecting these components to >99% purity using solvent evaporation followed by supercritical CO2 extraction.
Project Background
Xerox’s main target is to restore the PDMS viscosity to as close to the pure material as possible (10,000 cSt). Further, they would like a means of quantitatively measuring the heptane concentration. An additional soft target is for the process to cost no more than $3-3.50/kg of PDMS.
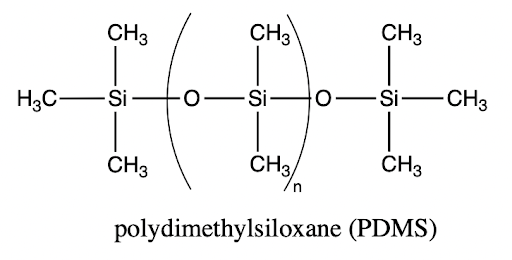
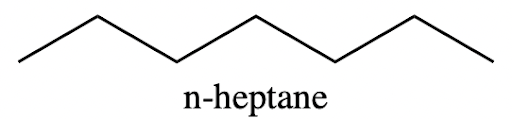
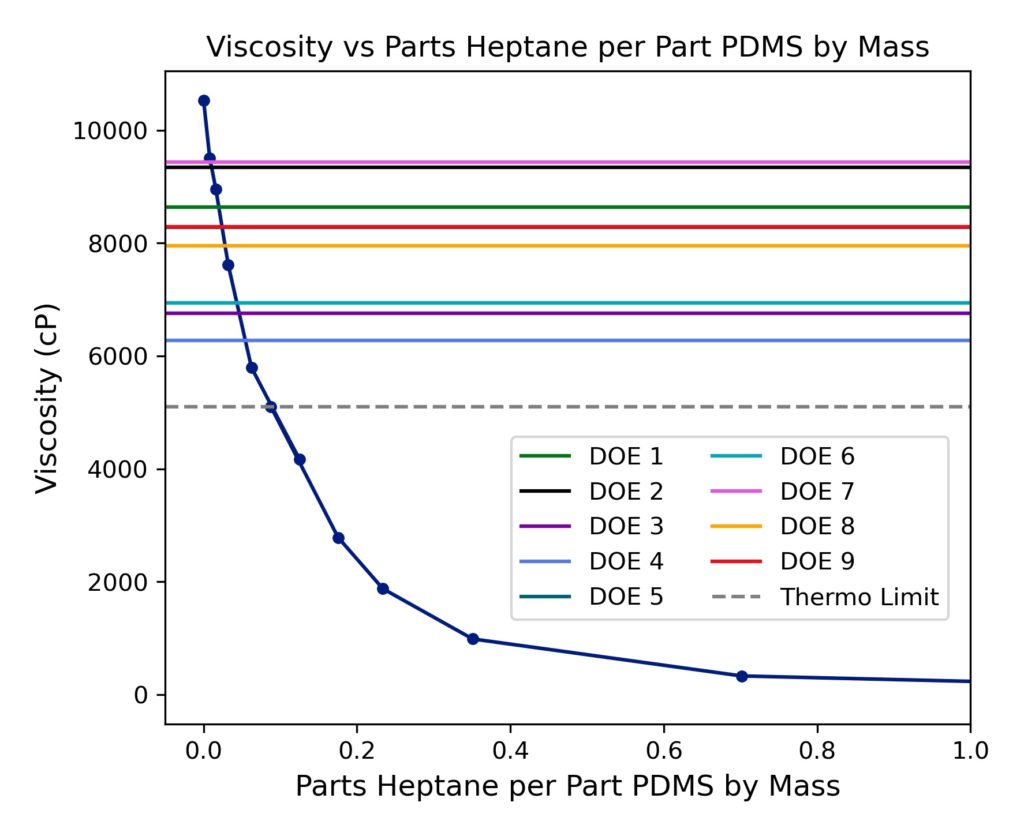
PDMS is a siloxane polymer, whereas heptane is a simple short hydrocarbon molecule. The chemical structures of both are shown in Figures 1 and 2. PDMS is extremely viscous, more so than molasses. Heptane is much thinner, less viscous than water. When the two are mixed, the viscosity of the PDMS decreases dramatically with small amounts of heptane. A graphical representation of the mixture viscosity across different amounts of heptane is shown below. Pure PDMS has a viscosity of ~10,500 cP.
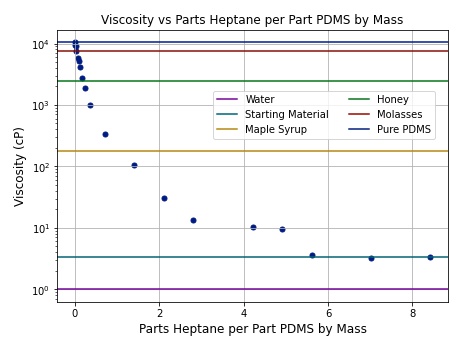
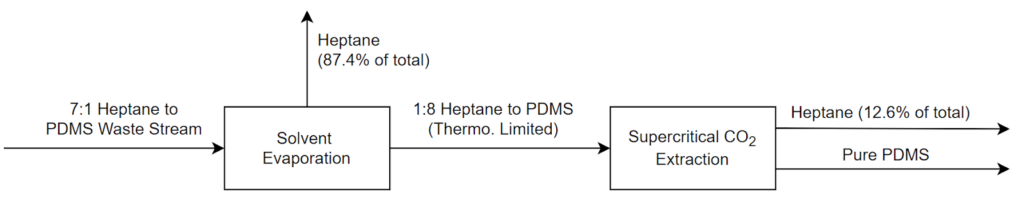
The team decided to focus on two different approaches: solvent evaporation and supercritical CO2 extraction. For solvent evaporation, the waste material was simply heated to drive out most of the heptane leaving enriched PDMS behind. The second approach involved supercritical CO2 as a solvent to carry out the heptane, again leaving PDMS behind. The two approaches also could be combined in an effort to minimize costs and maximize purity and viscosity as outlined in a simplified flow diagram below. To evaluate the purity of samples, the viscosity curve shown previously in Figure 3 was compared to measured sample viscosity after experimentation.
Technical Approaches
Solvent Evaporation
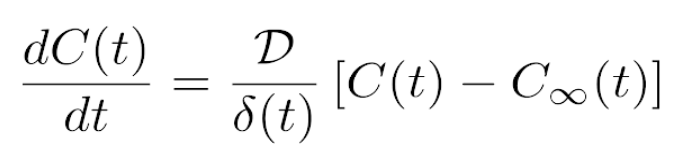
It was hypothesized that the heptane could be evaporated in an efficient manner by casting it on a thin film and applying heat. The evaporation process was believed to be diffusion-limited, so thin films were chosen to maximize solvent removal. Equation 1 shows the relation between drying rate (on the left side of the equation) and the diffusion coefficient, film thickness, solvent concentration in the film, and solvent concentration in the surrounding environment. The concentration of heptane in the environment is negligible, so the term C∞(t) may be set equal to zero. This equation describes a diffusion-limited process and does not account for thermodynamic effects, which are described in Equation 2.
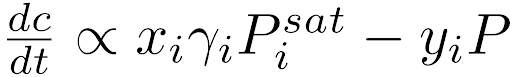
Equation 2 (right): Thermodynamic expression for evaporation showing the relation between drying rate, liquid/vapor mole fractions (xi/yi), activity coefficient (γi), component partial pressure (Pi), and pressure (P).
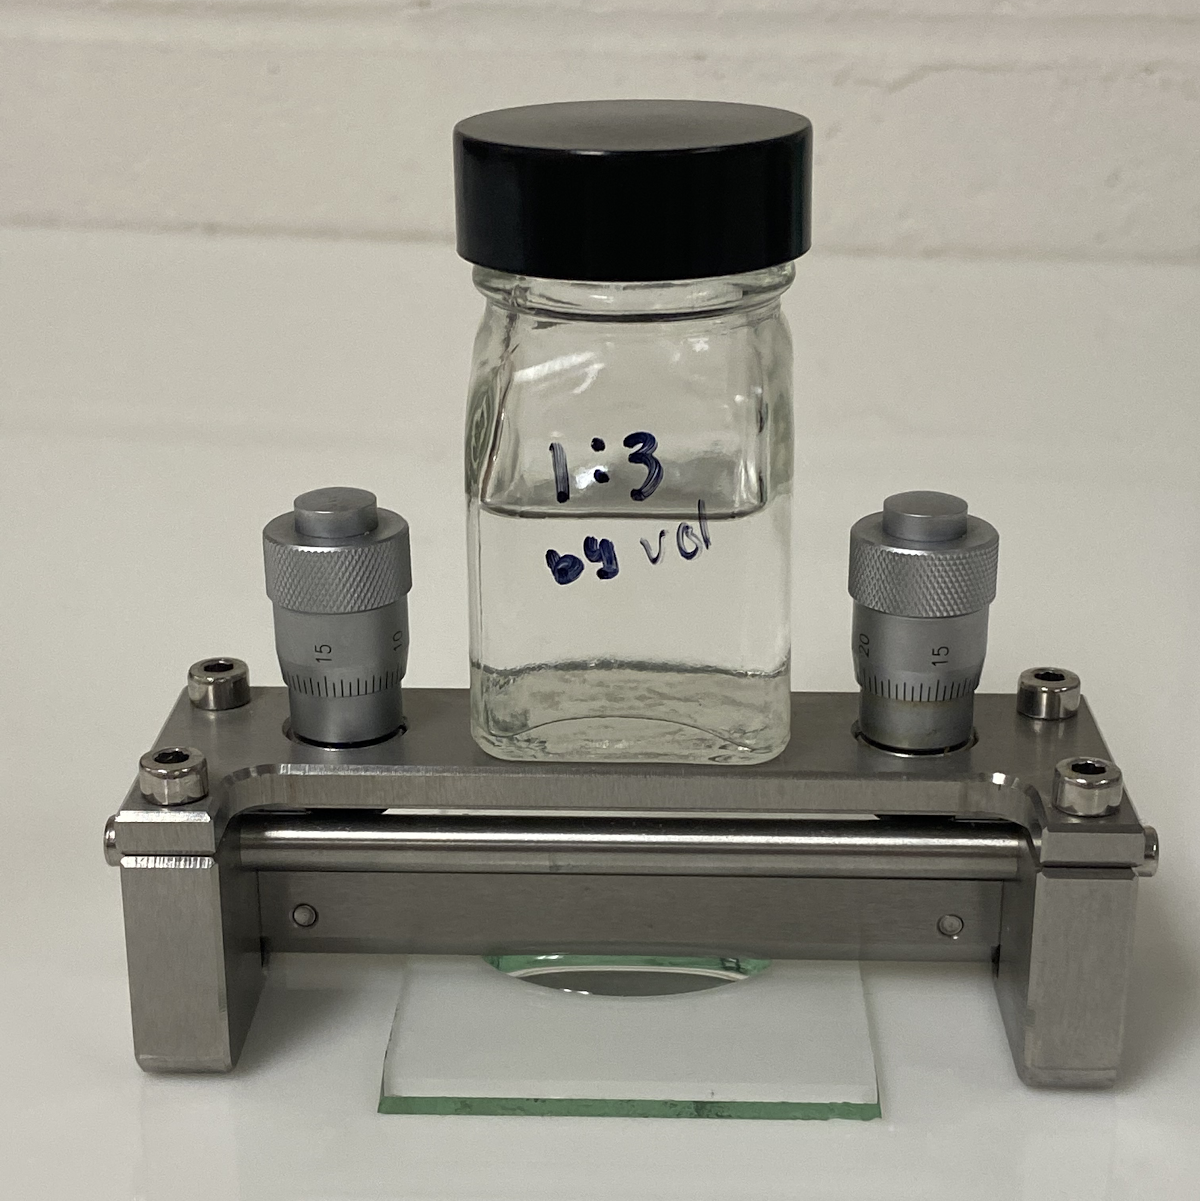
A small amount of sample was placed on a glass slide using a syringe and then a doctor blade, which is used to create a sample of a given thickness, was passed over it as shown in Figure 5. The slide was then placed on a pre-heated hot plate. An image of the setup is shown below:
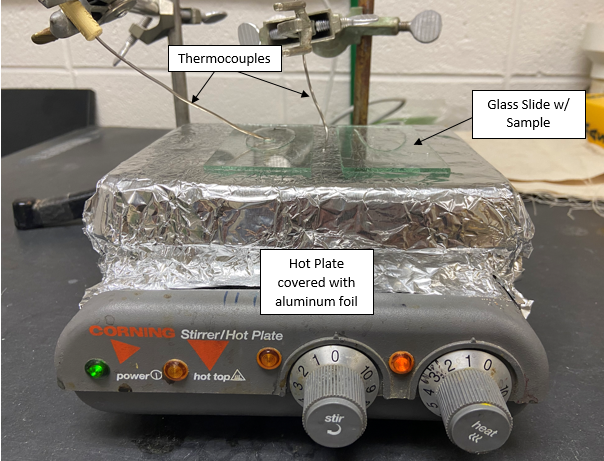
A wide range of temperatures from 120°C to 260°C and film thicknesses of 0.2 mm and 0.4mm were studied to optimize the process. Bulk evaporation, where a larger volume of sample was placed in a beaker, stirred, and heated, was also studied.
Supercritical Extraction
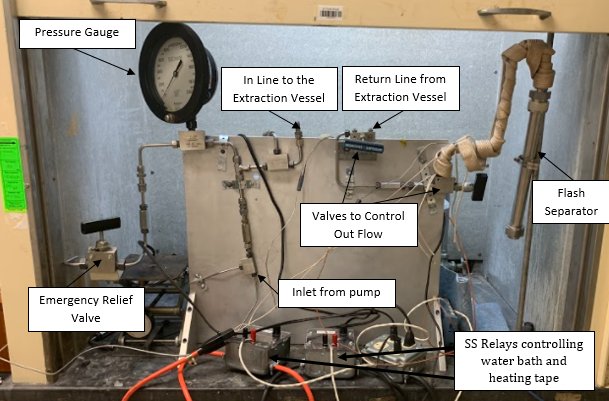
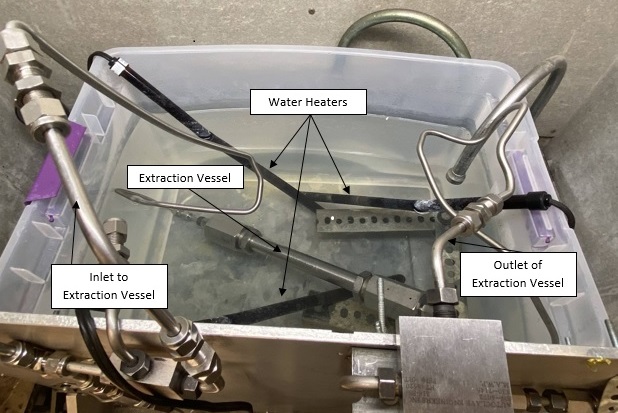
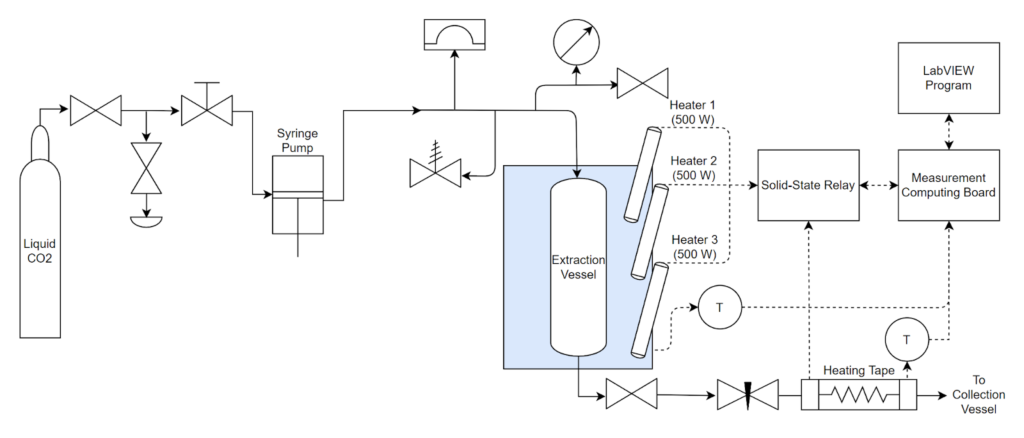
Carbon dioxide’s effectiveness as a solvent can be controlled by the pressure and temperature. At supercritical conditions, it is a great solvent for heptane; however, it cannot dissolve PDMS. This selectivity allows for removal of the heptane by bringing the system to supercritical conditions (>1070 psi, >31°C) and then slowly releasing the pressure and flushing the CO2 out. Ideally, CO2 will carry out the heptane with it as it leaves the system and the PDMS will remain in the loaded vessel. Images of the setup that was built in Gavett 145 are shown below in Figures 8 and 9. The entire setup is contained in a fume hood except for the CO2 tank and syringe pump which are not shown. Figure 9 shows a process flow diagram for the system.
Results
Solvent Evaporation
The solvent evaporation approach revealed a thermodynamic limit at around 96% heptane removal which is equivalent to a ratio of 1 part heptane to 8 parts PDMS by mass. Similar to a mixture of water and ethanol, there is a maximum purity that can be achieved by evaporation or distillation. In thermodynamics, this phenomenom is referred to as an azeotrope, where both components of a mixture are retained in the liquid phase.
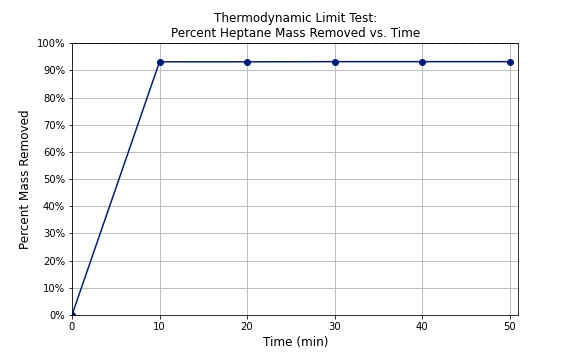
Thinner films and higher temperatures were able to increase the solvent evaporation rate, but were not able to surpass the limit. This result is consistent with our predictions because higher temperatures and thinner films generally improve drying processes. While this approach was simple and rapid, the end result does not satisfy customer needs and therefore additional or alternative methods are necessary to go beyond these limitations.
Supercritical Extraction
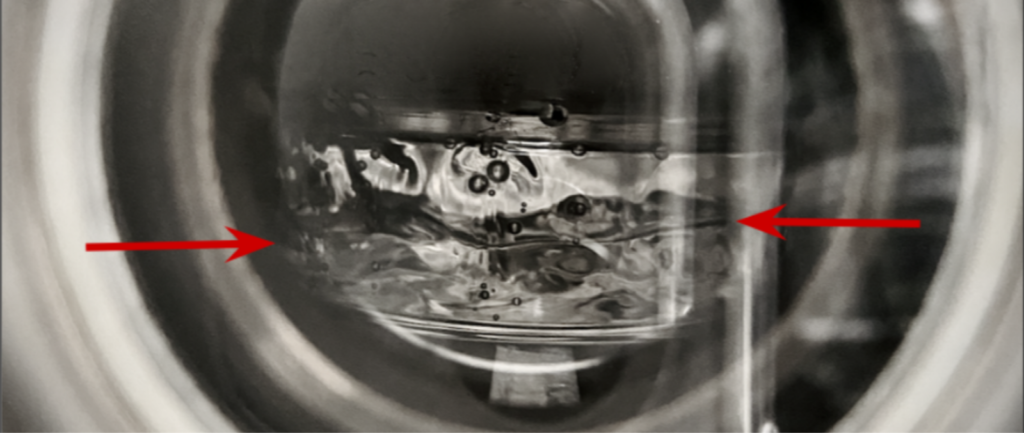
Before the supercritical setup that was built in Gavett was completed, preliminary tests were run at the Laser Lab for Energetics (LLE) in their supercritical dryer. Although the LLE system was isochoric (constant volume) instead of isobaric (constant pressure), it provided a good indication of what to expect from our setup, and aided in understanding phase behavior in supercritical conditions. Separation was visibly observed in these tests; two distinct phases were observed to form at supercritical conditions and are shown below. This result demonstrated the feasibility of the approach.
Initial trials were run using the isobaric system constructed in Gavett to determine if the thermodynamic limit could be broken. Two trials were run at 1300 psi and 40°C, with 1 and 2 cycles. The trials yielded a viscosity of 7650 and 7805 cP, respectively. These trials, as well as all other trials, were conducted using mixtures at the determined thermodynamic limit, or 1:8 heptane:PDMS by mass. For reference, the viscosity at the thermodynamic limit was 5103 cP. Both these trials were successful in showing that the supercritical extraction method could possibly achieve greater separations than drying alone.
A design of experiments (DOE) was conducted on the supercritical extraction process. The number of flush cycles, pressure, and temperature were investigated to find the general effects of each parameter on viscosity. Flush cycles refers to the number of times the system was soaked and flushed with liquid CO2. It should be noted that after each cycle, the system was allowed to depressurize, letting out enough CO2 from the system to reach around 800 psi. The individual DOE run parameters and results are shown below in Table 1.
| # | Cycle | Pressure (psi) | Temp. (°C) | Viscosity (cP) | Mass Ratio | Purity (%) |
| 1 | 3 | 1300 | 60 | 8632 | 1:53 | 97.9 |
| 2 | 3 | 1700 | 60 | 9343 | 1:110 | 99.0 |
| 3 | 1 | 1300 | 60 | 6760 | 1:22 | 95.0 |
| 4 | 1 | 1300 | 40 | 6279 | 1:18.5 | 94.1 |
| 5 | 1 | 1700 | 60 | 8278 | 1:43 | 97.4 |
| 6 | 1 | 1700 | 40 | 6936 | 1:23.5 | 95.3 |
| 7 | 3 | 1300 | 40 | 9437 | 1:125 | 99.1 |
| 8 | 2 | 1500 | 50 | 7947 | 1:33 | 96.6 |
| 9 | 3 | 1700 | 40 | 8293 | 1:43.5 | 97.4 |
The results from the DOE experiments were used as a way to analyze the best approach to achieve high sample purity. To more easily visualize the data, the viscosity values from each experiment were plotted against the rheology calibration curve. As shown in Figure 12, every DOE trial produced a sample that was at least more pure than the observed thermodynamic limit. Some DOE runs, namely runs number 2 and 7, greatly surpassed the thermodynamic limit and reached up to 99% purity. Not only did the DOE experiments prove that purification via supercritical carbon dioxide was feasible, but it also provided key information for future optimization.
Statistical analysis of the DOE trials was conducted to determine if any of the chosen run parameters had a significant effect on the resulting sample viscosity. As shown in Figures 13 and 14, the number of cycles had the largest effect on the results. The Pareto chart (Figure 13) shows that the number of cycles was the only statistically significant factor for this particular DOE with a confidence interval of 90%. Both pressure and temperature were determined to not have a significant effect on the results of each trial. The magnitude of this effect may be further visualized in Figure 14, where the main effects plot indicates that the number of cycles maintained the largest influence over sample purity. The interaction plots shown in Figure 15 were used to analyze how each of the chosen parameters interact with one another. Generally, it may be assumed that the two factors do not have a significant interaction if the lines are parallel to one another. For the pressure and temperature plot, an interesting effect was observed where the lines overlapped. This may indicate that the variables of pressure and temperature are related in some way. To confirm that pressure and temperature significantly interact in this process, further testing is suggested.
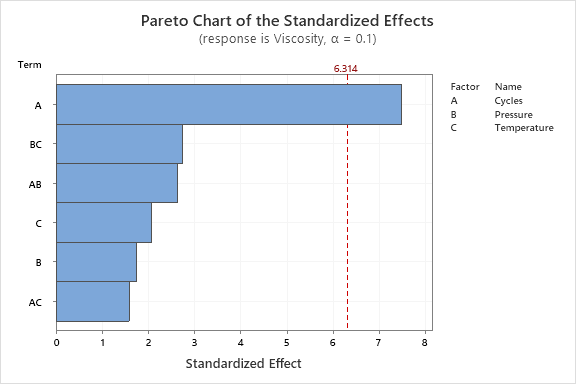
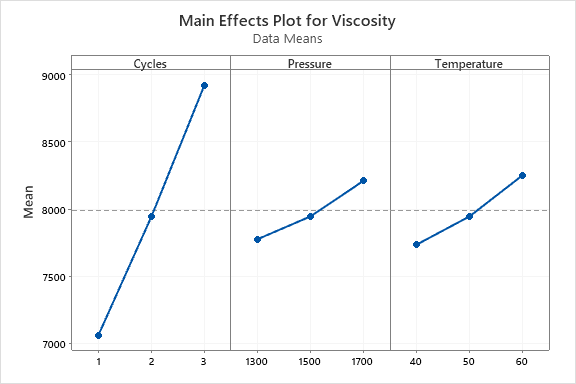
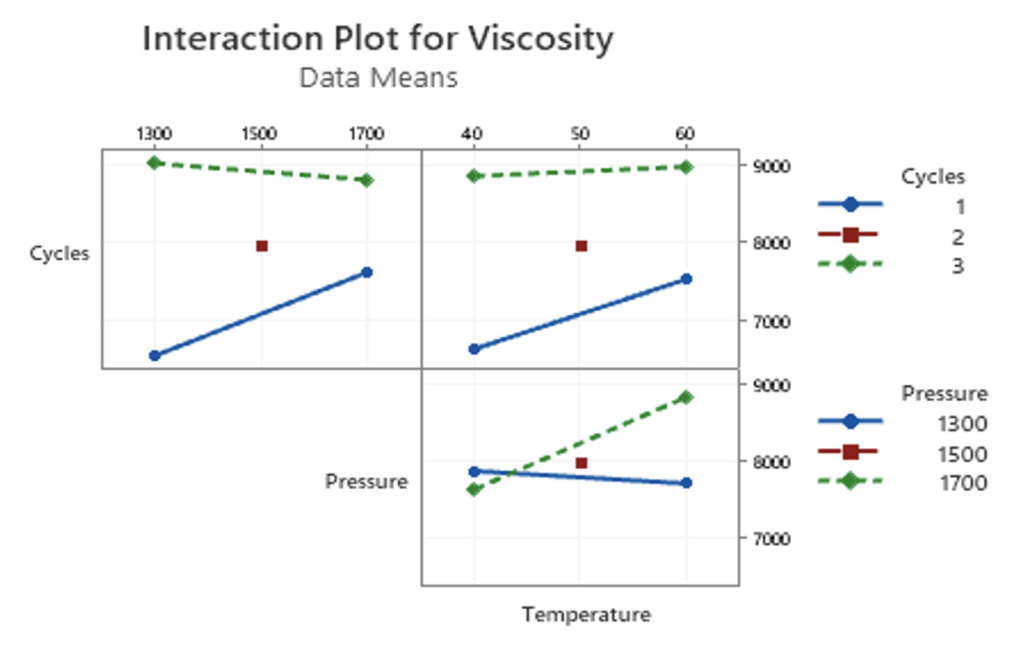
Figure 14: Main effects plots of tested parameters.
Figure 15: Interaction plots of tested parameters.
(Click the arrows to move through the figures)
Another goal of the project was to develop a reliable method for determining composition. A curve relating viscosity and sample composition was developed yielding a strong correlation with excellent resolution for various concentrations of heptane, even with high concentrations of PDMS. A very slight amount of heptane present in the solution led to large decreases in the mixture viscosity.

Conclusion
Based on the results of the supercritical extraction, it is likely that the right combination of pressure, temperature, and number of cycles will achieve the target PDMS viscosity. Future work on this project should include a more extensive DOE to investigate what combination achieves the desired result. Also, the combination of a bulk solvent evaporation followed by a supercritical extraction is recommended as the basis for the pilot scale of the process. Lab scale cost estimates put this process at about $2/kg of PDMS recovered, which meets the financial target given by Xerox of less than $3/kg. Given that this process will be scaled as large as 6,000,000 barrels per year, this separation process has the potential to save Xerox significant production costs.
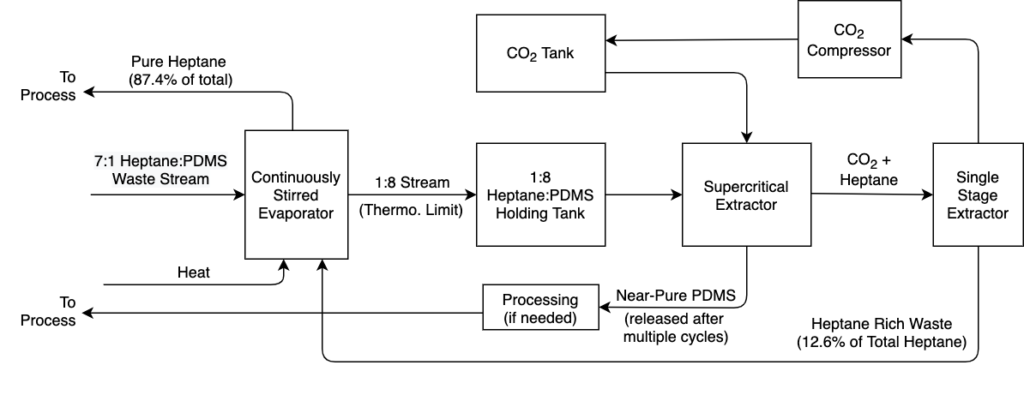
Based on the experimentation described above, it is likely that Xerox would be able to implement this process to meet their targets. A potential full-scale version of this separation process is shown in Figure 17. Here, both the heptane and the PDMS are recovered for reuse in the process, and the CO2 is reused through re-compression in a process that will both save money and reduce the overall environmental impact.
Acknowledgements
The team would like to first thank our advisors Prof. Lawton, Prof. Kelley, and Chris Wolfe from Xerox. We would also like the thank the laboratory staff Rachel Monfredo, Clair Cunningham, Jeff Lefler, Mark Juba, as well as Ryan Hayter for their ongoing support and technical assistance throughout the semester. A final thanks to Prof. Yates for loaning his syringe pump that made this project possible as well as Trajen Cracium and the LLE for letting the team run preliminary testing with the supercritical dryer.
Thank you for reading, and please let us know if you have any questions!