DSCC383 Team: Gus Vietze, Keitaro Ogawa, Rohaan Ahmad, Joseph Tschopp
Academic Advisor: Cantay Caliskan | Sponsor: Paychex
Abstract
In this research, we corporate with Paychex to develop a machine model that accurately predicts the job titles based on their Client, Payment, Product, and Workers database. Our approaches consist of initial modelings from sample datasets, model improvements using hierarchical classification on Major Code and Job Titles, and final modelings that show fairness analysis on gender and ethnicity distribution. We exemplify how advanced machine learning techniques can be leveraged in large-scale, real-world applications to provide both strategic insights and ensure ethical standards in workforce management.
Background
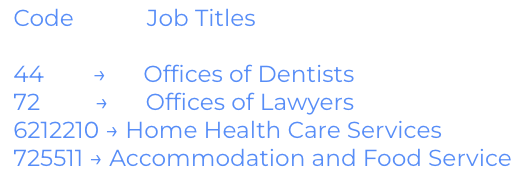
Paychex is a provider of human resources, payroll, and employee benefits outsourcing services for small- to medium-sized businesses. Paychex has good information on where it’s needed to put money into pockets or manage benefits, but one piece of information often missing is “Job Titles.” We predict the OEWS (Occupational Employment and Wage Statistics) Code, which are masked values for Job Titles. A few examples are shown below. We are also given Major Codes which are labels that sorts the job titles into “buckets”, grouping similar job titles together. There are total of 23 Major Codes.
Analysis & Modeling
Data:
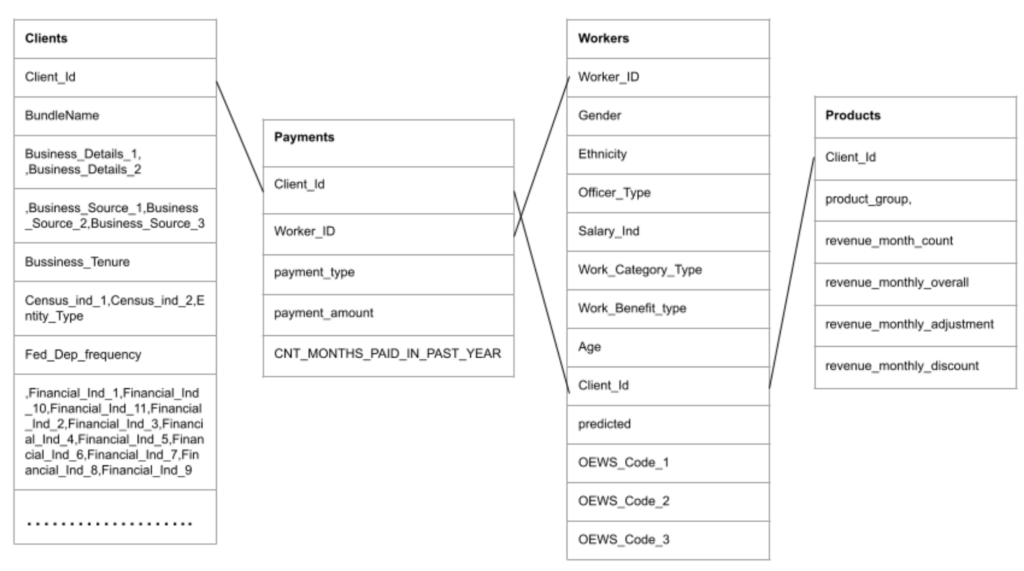
Clients, Workers, Payments, and Products tables contain information about employee, industry, firmographics, wages, hours, benefits, and demographics. Data has 850 unique job title classes among 67,278 Clients and 4,226,517 workers. Most fields are masked, meaning that we don’t have access to the true values, but instead they are converted into numerical values.
Data Insights:
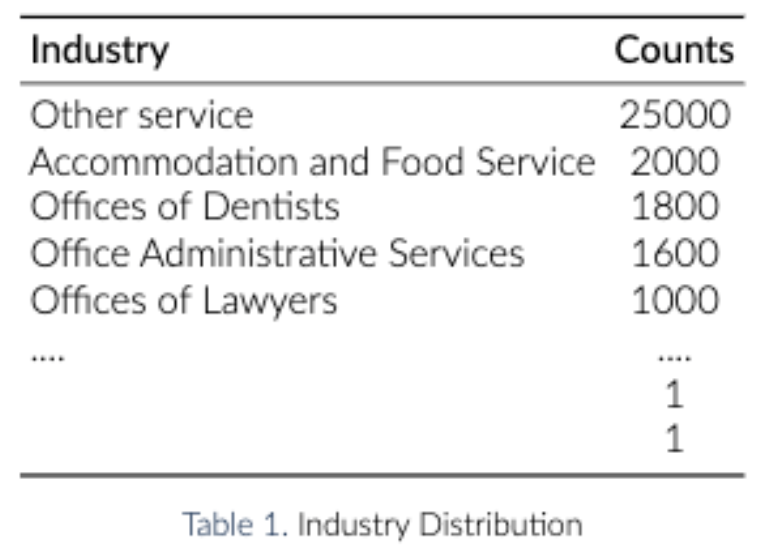
We faced imbalanced target indicators and needed to take this ‘imbalance’ into consideration when modeling because low frequency labels can cause overfitting, poor generalization, and biased predictions. For example, there are more than 50 job titles which has a frequency of less than 30, which is about 5% of the whole dataset. In addition, 16% of the classes have a frequency less than 100 and another 16% of the classes have frequency over 50000, which represent .0125% of the 4 million rows.
Initial Method:
Before diving into the model development, we set a baseline accuracy to 4.3%. This is obtained through using a dummy classifier (classified all target as the most frequent) and the frequency of the most common value (185305) was divided by the total number of columns (4226517). We did not set a target accuracy, but rather we focused on understanding the logics behind the accuracy. For instance, we have conducted fairness analysis to see how the model performs across different demographic groups rather than just improving overall accuracy. This approach is important in applications where fairness and equity are critical.
In addition, we ran a several machine learning models using 2.5% of the whole dataset to understand the models’ efficiency, memory usage, and accuracy on these highly classification tasks. Neural Network and Random Forest performed well compared to KNN, SVM, Naive Bayes, and Logistic Regression. Those two models got the accuracy to about 37%-40%. Some of the preprocessing were label encoding and min-max encoding as well as dropping unnecessary features.
Model Improvements
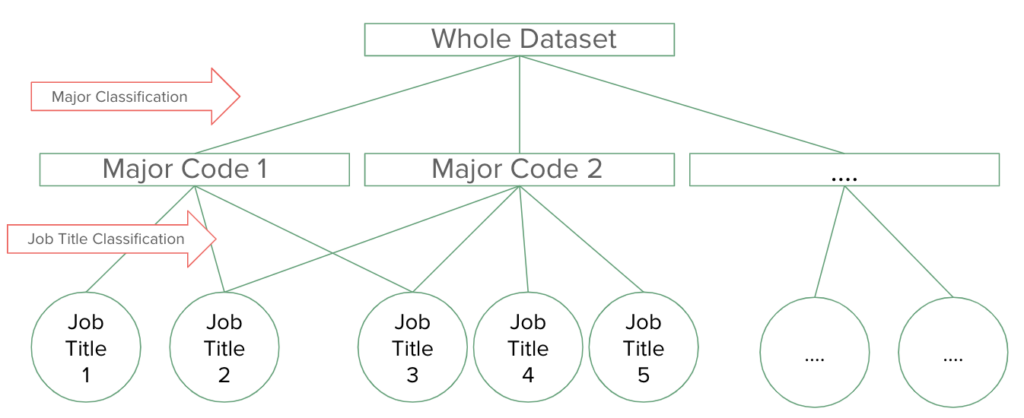
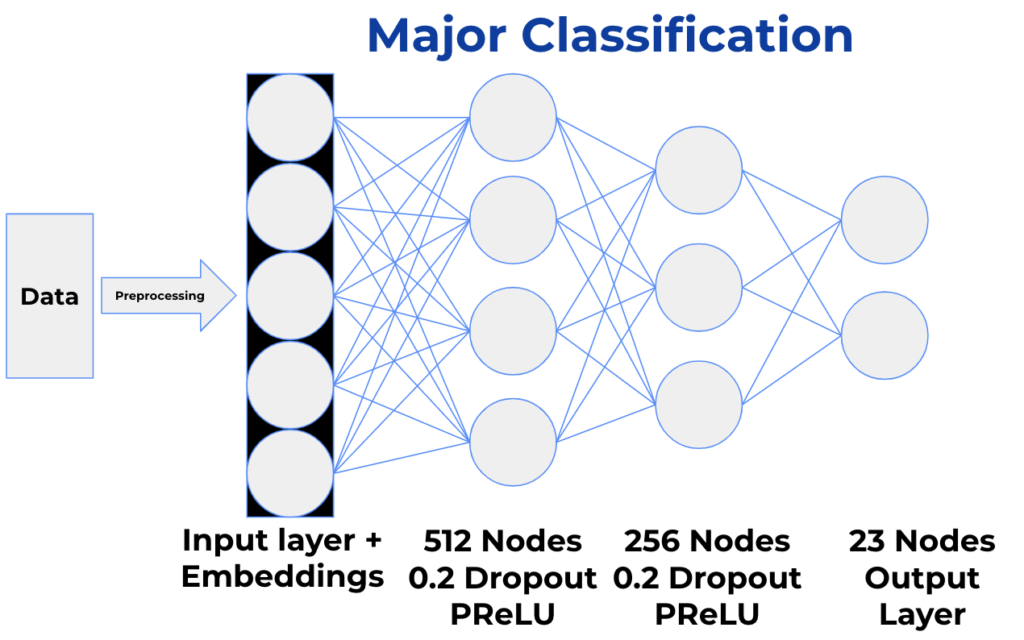
Hierarchical Classification consists of two stages: Major Classification and Job Title Classification. First, Major Classification takes a neural network approach where it incorporates embeddings. Then, we train-test split the dataset on Client ID. Embeddings consist of an input layer, hidden layers, and an output layer. They learn mappings for categorical variables to lower dimensional continuous vectors and are much more space efficient than one-hot encoding. Further, using the Major Codes, we were able to only predict 23 Total Codes rather than 850 codes.
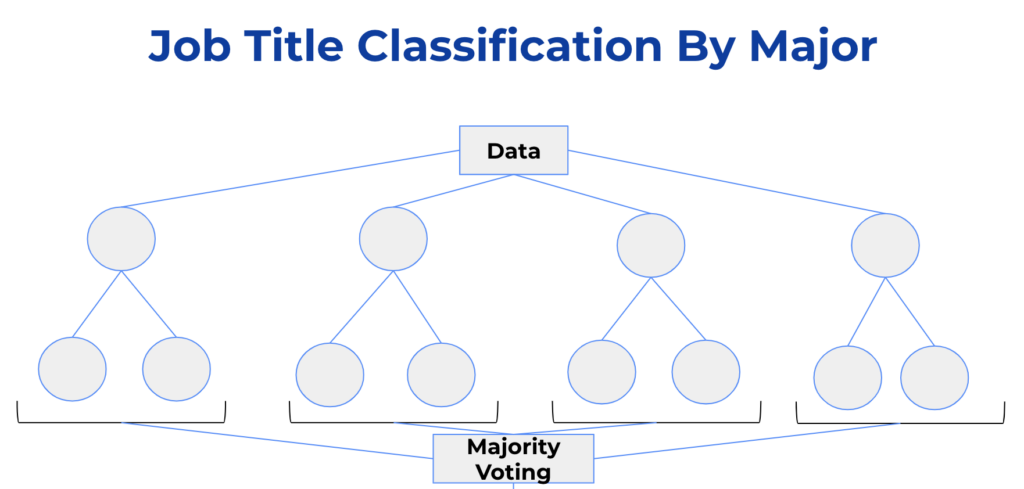
After each job titles were classified into the Major Codes, Job Title Classification takes a Random Forest approach to classify the OEWS Codes within each Major Code. This approach includes majority voting as it is an aspect of random forest. Similar to Major Code Classification, we split the dataset on Client ID for training and testing, and used kfold cross validation for train/evaluation split and model tuning. Given the data sparsity and its extensive memory usage on the whole dataset, we scaled up the modeling using BlueHive (supercomputer) because it can provide a good balance of memory, efficiency, and accuracy.
Our final Major Classification had an accuracy of 56% and F1 Score of 0.54. For Job Title Classification, we found the lowest and highest accuracy for top 1 and 3 Job Titles within a Major Code. For top 1, we got 68% for the lowest and 89% for the highest. Consequently, we achieved 85% for the lowest and 98% for the highest for top 3 Job Titles within a Major Code.
Visualization Results:
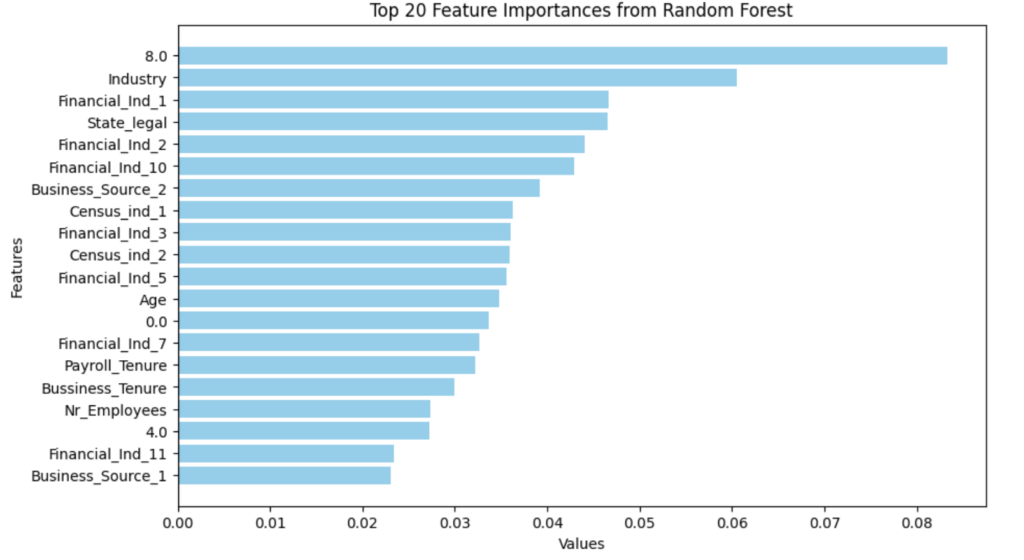
We discovered some significant features during the Random Forest process within the Job Title Classification, which were used as inputs for better model improvements.
Summary & Conclusion
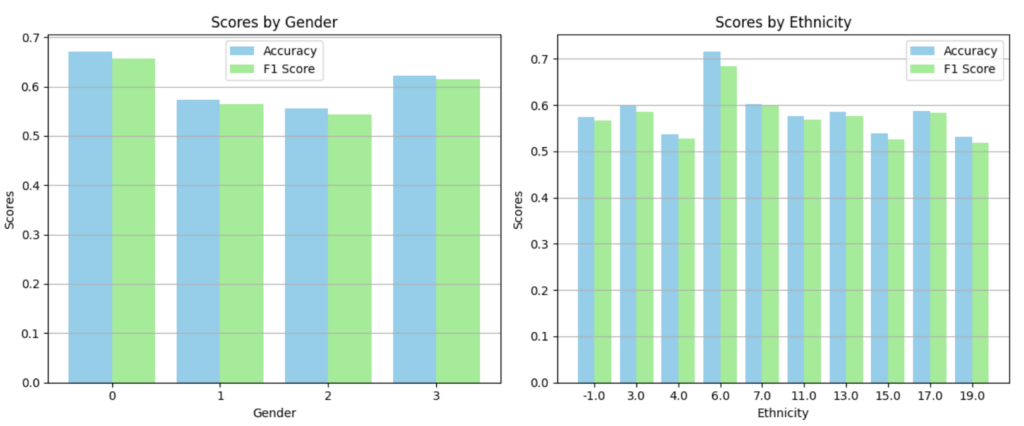
In terms of the gender analysis, the model appears to handle gender quite fairly with little variation in performance metrics across the categories shown. The gender categories are labeled as 0, 1, 2, and 3. It’s not clear what each number stands for, but they could represent different gender categories such as male, female, and possibly non-binary or unspecified categories. This uniformity can be seen as a positive sign in terms of gender fairness, assuming no gender is under-represented or biased.
However, for ethnicity analysis, the variation in scores across different ethnic groups is slightly more pronounced compared to gender, particularly for the F1 Score. Some ethnic groups (e.g., those labeled around 10 and 19) tend to have higher scores, while others (e.g., -1, 4) show lower scores. This could indicate potential biases or performance differences in the model with respect to different ethnicities, which might suggest that further investigation and potential adjustment could be needed to ensure fairness.
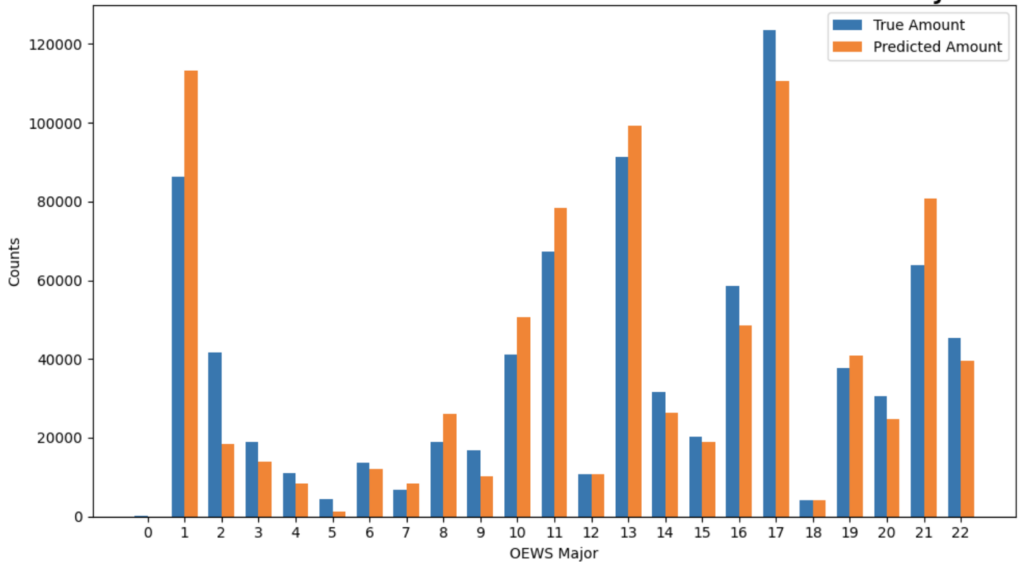
The output of the hierarchical classifications are shown in fig6. We learn that the accuracy of the model’s predictions is not consistent across all OEWS major codes. For example, in major codes like 9, 12, and 14, the predicted counts significantly exceed the true counts. Conversely, for codes such as 0, 2, and 21, the model underestimates the counts. This could suggest that certain features or characteristics of specific occupational categories are not being captured effectively by the model, so it needs better calibration for certain occupational categories. These informations can help further inform Paychex’s understanding on the compensation benchmarking, labor cost forecasting, tax credits, and equal pay. However, our analysis also revealed a limited number of unmasked fields related to the variables above, making it difficult to draw conclusions on this potential issue. Further extensive research is necessary to better understand the impact of different accuracies, particularly among Paychex’s clients.
Future Work
For future work in our research with Paychex, incorporating time series analysis could provide substantial insights, particularly in understanding how wages and salaries for clients have evolved over time. This approach would allow us to explore trends and patterns in compensation, which could be crucial for strategic decision-making and forecasting in human resources and payroll management. We can further identify whether there is a general upward or downward movement in wages over time across different sectors or job titles. This could facilitate predictions about future wage trends, enabling more informed compensation decisions.
To implement this, we would first need to address the current limitation of our datasets not including time series variables. This might involve modifying data collection processes to capture temporal data points for wages and salaries. Selecting the right models for time series analysis, such as ARIMA or Seasonal Decomposition of Time Series (STL) will be critical, depending on the characteristics of the data.
Acknowledgement
We want to specially thank Professor Cantay Caliskan for his guidance and help throughout our project. Professor Caliskan’s supports on each meeting were valuable in our progress within the different steps of this project. Similarly, we would like to thank Paychex for sponsoring this project, and giving us this unique opportunity to work with them. This research allowed us to explore different facets of work with Paychex’s clients data and the challenges encountered created a great learning opportunity for our team.
References
- Artificial neural network – meaning, types, examples. (n.d.). https://www.wallstreetmojo.com/artificial-neural-network/
- A top-down supervised learning approach to hierarchical multi-label classification in networks – M Romero, 2022
- A Hierarchical Approach to Efficient Reinforcement Learning in Deterministic Domains – Carlos Diuk, Alexander L. Strehl, M. Littman, 2006
- Cerri, Ricardo, et al. “Hierarchical Multi-Label Classification Using Local Neural Networks.” Journal of Computer and System Sciences, Academic Press, 22 Mar. 2013, www.sciencedirect.com/science/article/pii/S0022000013000718.
- Diuk, Carlos, et al. A Hierarchical Approach to Efficient Reinforcement Learning in Deterministic Domains, www.researchgate.net/profile/Carlos_Diuk/publication/221455000_A_hierarchical_approach_to_efficient_reinforcement_learning_in_deterministic_domains/links/0deec516f111ae530e000000/A-hierarchical-approach-to-efficient-reinforcement-learning-in-deterministic-domains.pdf. Accessed 18 Apr. 2024.
- K, D. (2023, February 7). Top 4 advantages and disadvantages of support vector machine or SVM. Medium. https://dhirajkumarblog.medium.com/top-4-advantages-and-disadvantages-of-support-vector-machine-or-svm-a3c06a2b107
- Khim, J., Xu, Z., & Singh, S. (2020). Multiclass Classification via Class-Weighted Nearest Neighbors. arXiv preprint arXiv:2004.04715.
- Khemani, B., Patil, S., Kotecha, K. et al. A review of graph neural networks: concepts, architectures, techniques, challenges, datasets, applications, and future directions. J Big Data 11, 18 (2024). https://doi.org/10.1186/s40537-023-00876-4
- Levatic, Jurica, et al. The Use of the Label Hierarchy in Hierarchical Multi-Label Classification Improves Performance, www.researchgate.net/publication/278702868_The_Use_of_the_Label_Hierarchy_in_Hierarchical_Multi-label_Classification_Improves_Performance. Accessed 18 Apr. 2024.
- Lorieul, T., Joly, A., & Shasha, D. (2021). Classification Under Ambiguity: When Is Average-K Better Than Top-K? arXiv preprint arXiv:2112.08851. Statistical Machine Learning.
- Luo, Jiayu, et al. “Hierarchical Multi-Label Classification Using Local Neural Networks.” Journal of Computer and System Sciences, Academic Press, 22 Mar. 2013, www.sciencedirect.com/science/article/pii/S0022000013000718.
- Meltzer, R., Rachel Meltzer What is Random Forest? [beginner’s guide + examples]. CareerFoundry. (2023, August 31). https://careerfoundry.com/en/blog/data-analytics/what-is-random-forest/#:~:text=3.,%2C%20patient%20history%2C%20and%20safety.
- Multi-label Classification Based on Label Hierarchical Compression – Jiayu Luo, Junqiao Hu, Yuman Zhang, Shuihuan Ye, Xinyi Xu, 2021
- Naive Bayes Classifier: Pros & Cons, Applications & Types Explained | upGrad blog. (n.d.). Naive Bayes classifier: Pros & Cons, applications & types explained. upGrad blog. https://www.upgrad.com/blog/naive-bayes-classifier/
- Singh, J. (2020, December 26). Random Forest: Pros and cons. Medium. https://medium.datadriveninvestor.com/random-forest-pros-and-cons-c1c42fb64f04