Background
Problem Statement:
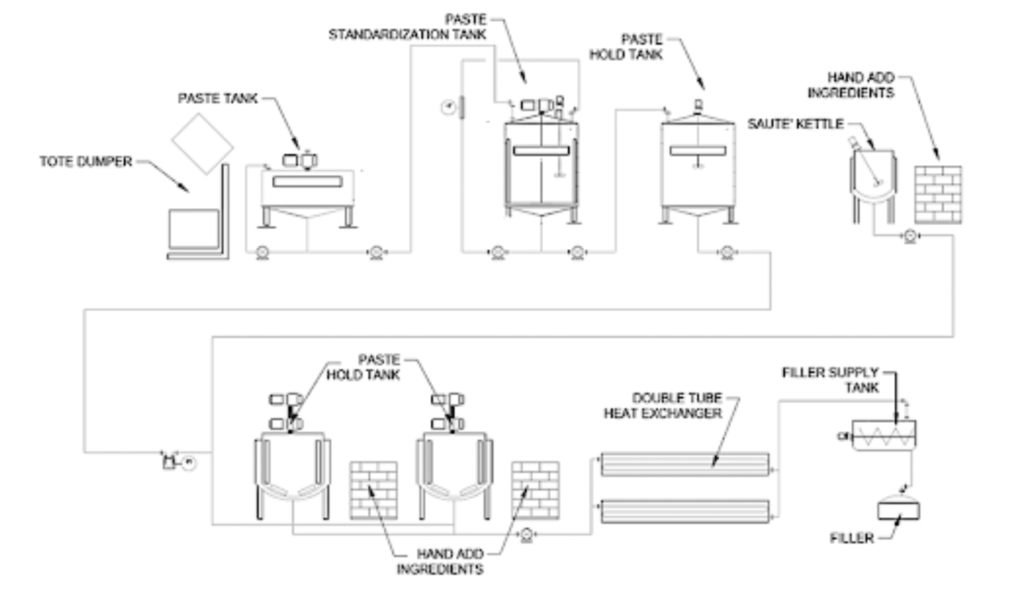
Staff members at the LiDestri Food and Drink manufacturing plant in Greece, NY have recently been trying to find a way to improve their tomato sauce production line. The process flow diagram of the tomato sauce production system is depicted in Figure 2. The specific aspect of the process that requires improvement is determined to be the tomato sauce throughput from the sauce cook kettles to the jar filler.
Pete Tateo is the cooperate Director of Engineering for the Greece location, as well as the project customer. For this project, Mr. Tateo is calling for engineers to identify the cause of the problematic system behaviors occurring in the pumping system and to resolve this problem with the implementation of potential solutions.
Problem Statement Summary:
This project focuses on solving the problematic behavior caused in the two twin screw pumps located in LiDestri. The pair of twin screw pumps which drive kettle drainage to the jar filler have a current maximum volumetric throughput of approximately 100 gallons per minute (GPM) per pump. Between the two pumps, this throughput amounts to a production rate of about 800 jars per minute (JPM). At this demanded throughputs of 100 GPM and at any level under this point, none of transported sauce recipes cause any problematic behaviors in the system. However, for only some of the sauces, demanding throughputs in excess of 100 GPM causes the pumps to violently shake.
Furthermore, as elevated pump speed in revolutions per minute (RPMs) is achieved in an attempt to speed sauce transport, the severity of the resultant shaking increases. This behavior is detected to be severe enough to cause the pumps to rattle the attached inlet pipes and create shock-waves to the integrated catwalk above them. In addition, the stress caused in the twin pumps is certainly enough to cause some degree of internal damage within the pumps. Depending on the level of this damage, the pumping system can fail to efficiently transport the sauces.
Currently, in order to resolve this problem, LiDestri is reducing the pump speed to prevent shaking. Having the pumps’ performances restricted to 100 GPM is costing LiDestri both time and money. With this solution, the plant operators are required to manually manage the unoptimized throughput process since the sauce transport procedures cannot be conducted at a uniform high speed. Currently, there is not a set procedure designed by the plant personnel to guide solution design for this issue. Thus, the main goal of the engineers assigned to this task is to empirically locate the factor which could be used to identify problematic sauce recipes and to design an integrated process solution that corrects for this sauce behavior-driving factor.
System Knows
Resources:
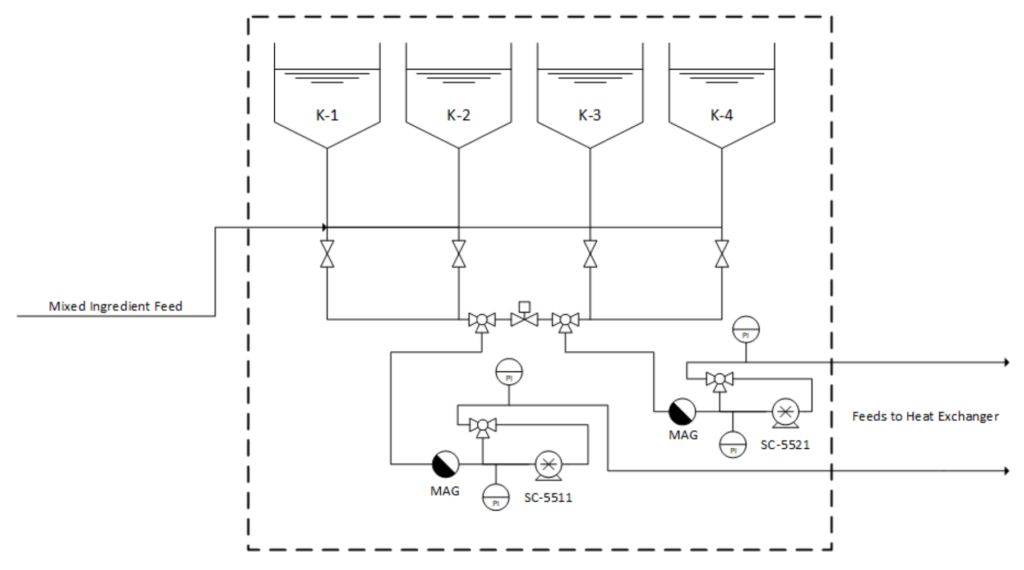
A streamlined diagram of the plant section in question for this project is displayed below in Figure 3. All the information relating to the system including plant schematics were provided by Lee Lindenmuth who is the process engineer that designed the current production system in LiDestri. The diagram has been constructed in accordance with the original full-plant process and instrumentation diagram provided by Mr. Lindenmuth.
Equipment and System Information:
The project area of interest illustrated by Figure 3 consists of four major components: the cook kettles, the piping inter-spliced with sanitary plug valves leading from the tanks to the pair of pumps, the pumps, and the pressure gauges at the inlet and outlet of each pump. The cook kettles, labeled K-1, K-2, K-3, and K-4 are all identical Feldmeier brand steel conical bottom cylindrical tanks. Each tank has a diameter of 6.56 feet along with a cylindrical section height of 6.47 feet and a total height of 7.15 feet. In addition, they have 3.875-inch inner diameter orifices on their bottoms which cap the points of each tank’s conical section. Assuming that the tank’s volume is a cylinder attached to a truncated cone, the total brim capacity of each tank is estimated to be 1700 US gallons.
Leading out of each tank is a length of grade 304 schedule 10 stainless steel pipe with an outer diameter (OD) of 4.0 inches, inner diameter (ID) of 3.875 inches, and a rating-16 machine finish. Pipes that fall within the sauce line’s area of interest all possess these specifications. The rating-16 machine finish is assumed to be a proprietary label of unknown significance. Thus, a relative roughness value of 0.0005 was assigned in place of a numerical definition for the term which was in accordance with a literature value range for turned stainless steel. The pipes which link the kettles to the pumps are connected in a manifold-like fashion.
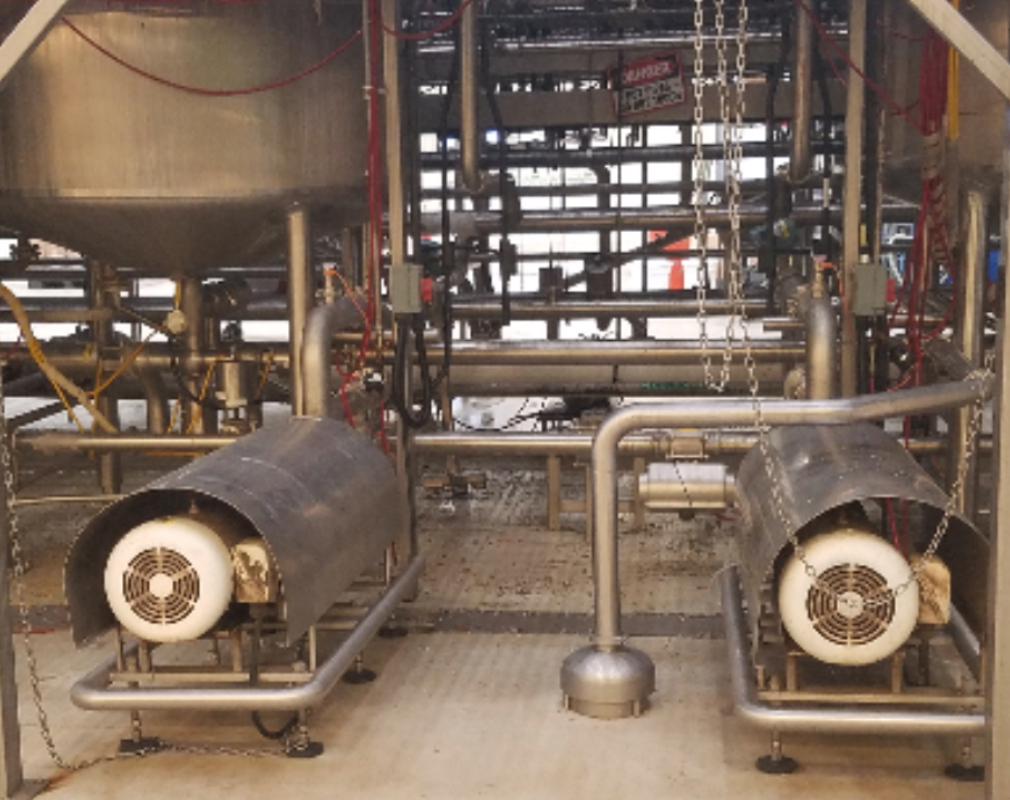
This project focuses on the two pumps that are displayed in Figure 4 which are a pair of Axiflow STS 90-57 model twin screw style positive displacement pumps. These pumps are labeled as SC-5511 and SC-5521 in Figure 3. Twin-screw type pumps were chosen for the current plant layout because these types of pumps are specifically designed to transport solid-suspensions possessing various viscosities over a wide range of temperatures. Since both pumps are appropriately applied with respect to the process, pump type was ruled out as a potential contributor to the violent shaking phenomenon early in the initial investigation process. The two pumps are operated in parallel and are always active together during kettle drainage. The tandem pump will only ever drain one cook kettle of its contents at a time, and all four kettles will always contain the same sauce recipe at any given time to prevent cross-contamination in the manifold beneath the kettles during drainage. Each kettle is drained to the pump inlets at a temperature between 150˚F and 155˚F (152.5˚F +/- 2.5˚F). The pumps are equipped with electronic model PI2794 IFM brand pressure sensors at each inlet and outlet. These pressure sensors are capable of reading pressures from -14.5 to 145.0 pounds per square inch gauge (PSIG) [1].
Problem Diagnosis: Cavitation
The Cavitation Mechanism:
After reviewing the equipment and process specifications surrounding the twin screw pumps, a potential explanation for the cause of the shaking behavior of the pumps at higher demanded volumetric throughputs was identified: cavitation. Cavitation is an issue commonly faced by pumps, caused by the creation and collapse of vapor bubbles within a pump’s interior chambers. When a high-temperature fluid is drawn through the interior of a pump, it is subjected to a transient vacuum pocket created by the pump’s suction. If the pressure within the vacuum pocket is low enough, the fluid’s boiling point temperature is reduced enough such that the liquid evaporates and unstable vapor bubbles are created. When pressure is equalized at the outlet of the interior pumping mechanism, the vapor bubbles suddenly collapse and release large amounts of energy as shock-waves. The shock-waves created by these bomb-like ruptures are absorbed by the surrounding fluid and inner pump surfaces, causing the pump to violently shake and incur damage.
Evidence for Cavitation:
Keeping the mechanism of cavitation in mind, it is known that each sauce recipe is released from the cook kettles to both twin screw pumps at a temperature between 150˚F and 155˚F. Knowing that water is a prevalent component in pasta sauce, the vapor-liquid behaviors and the standard atmospheric boiling point of water (212˚F) can be used in terms of determining the likelihood of cavitation occurring within the pumps.
During a visit to the LiDestri production plant, non-problematic pump operation conditions were observed using programmable logic controllers (PLCs) located in the operation line. The head pressures at the inlets of each pump during standard operation, indicated by the PI2794 pressure sensors integrated into the pipeline, were read out in the order of -9.0 psig. The atmospheric pressure is equivalent to 14.7 psi, and 0 psig equals to 14.7 psi. This suggests that the sauce which was traversing the pump inlet at the time must have been subjected to the appreciable vacuum pressure of 5.7 psia. Knowing that the twin-screw pumps are capable of drawing vacuums of this magnitude without causing any problematic sauce behaviors, it is reasonable to state that sufficiently extreme vacuums can be drawn at higher pump speeds such that cavitation occurs. Using the properties of water vapor and the Antoine equation, given in Equation 8, it was determined that a vacuum of -9.0 psig would lower water’s boiling point to around 162˚F, which is strikingly close to the cook kettles’ operating temperatures [12].
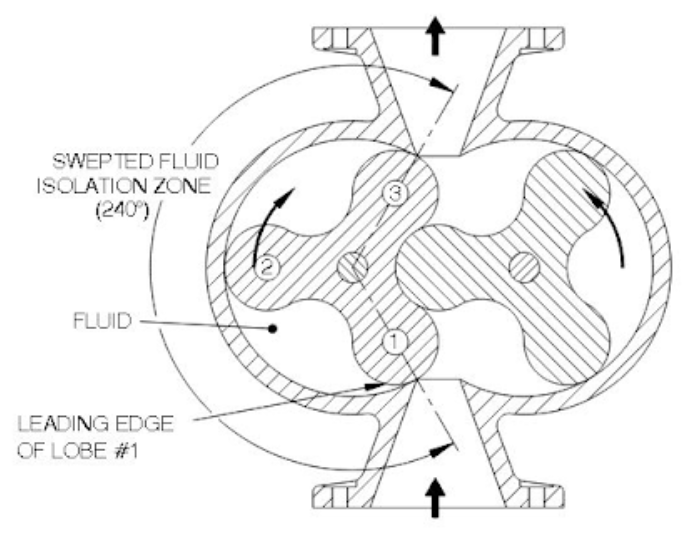
This insight about the nature of the sauce transport process corroborates the hypothesis that cavitation is the phenomenon responsible for pump shaking at elevated pump speeds [7]. This inference is further supported by an observation Mr. Tateo relayed about one of the pumps he had decommissioned before the investigation for this design project had begun. The defunct pump in question was a lobe pump, a depiction of which can be seen below in Figure 5. Mr. Tateo shared that upon opening up the pump to perform maintenance, plant personnel discovered that the steel surfaces of the interior chamber were heavily pockmarked as if they had been struck repeatedly with a hammer. This observation is clearly indicative of unstable vapor bubble ruptures which took place while the lobe pump was still in use. Overall, the evidence strongly suggests that cavitation is the phenomenon responsible for the issues LiDestri is facing with respect to the twin-screw pump’ behavior at elevated speeds.
Cavitation and Net Positive Suction Head:
As previously observed, the pump speed can be adjusted in order to reduce the effects of the problem observed in LiDestri. However, it was determined that this solution creates an additional cost for the plant. Therefore, for this project, a process model would be developed that would contain the numerical model for the transport and the plant area of interest based on the data collected from sauce samples and plant measurements. To determine the conditions under which cavitation occurs, the pumps involved must be characterized and numerically described.
One common method used to obtain quantitative characterizations for given pumps is to reference Net Positive Suction Head (NPSH) curves, a general example of which is depicted below in Figure 6. As exemplifies in this figure, NPSH is broken down into two subcomponents: Net Positive Suction Head Required (NPSHr) and Net Positive Suction Head Available (NPSHa).
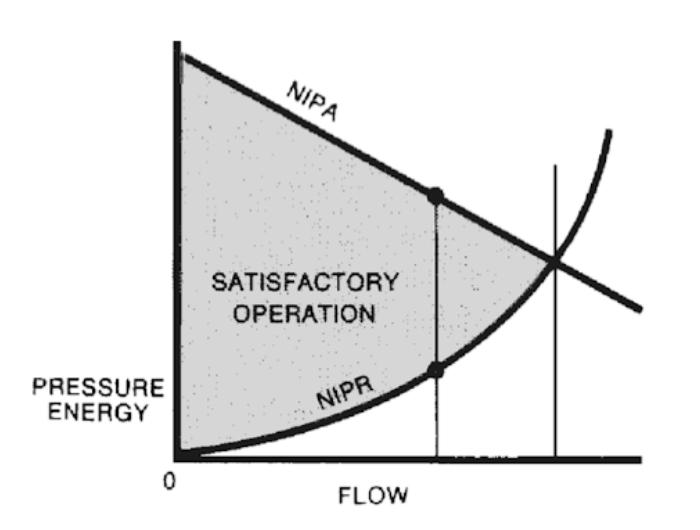
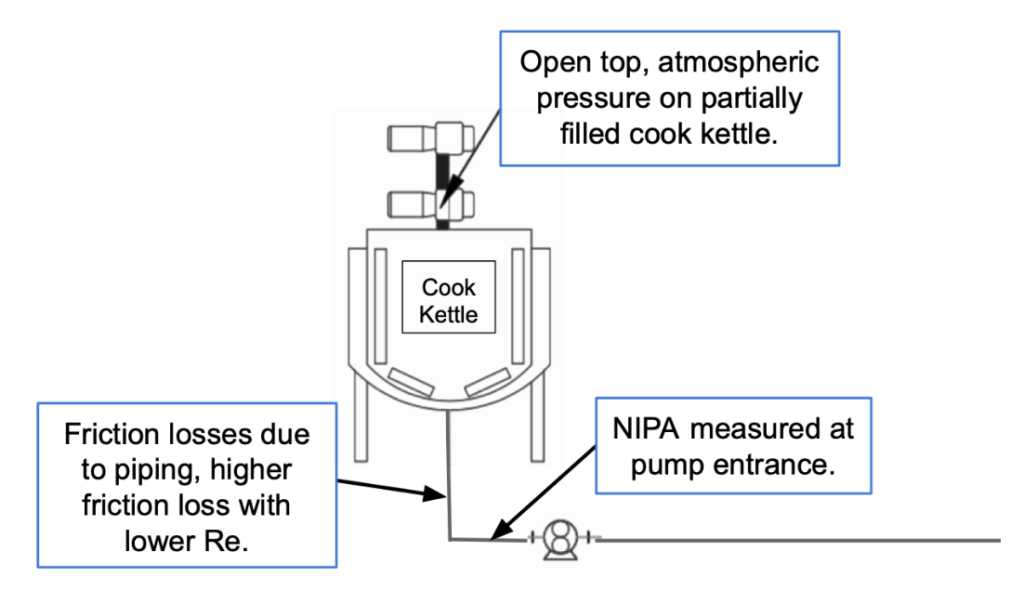
NPSHr, also referred to as net inlet pressure required (NIPR), is the pressure required at the inlet of the pump for the pump to operate normally and draw in fluid. NPSHr is most strongly influenced by the pump speed as well as the viscosity of the fluid. Typically, flow rate is plotted against NPSHr. A variety of graphs are made for fluids of different viscosities, such that each system’s characteristics are assessable. NPSHr curves can generally be obtained from the pump manufacturers. Furthermore, NPSHa, also referred to as net inlet pressure available (NIPA), is the pressure available at the inlet of the pump minus the vapor pressure of the fluid. Referring to Figure 7, NPSHa is primarily dependent on sauce static pressure and friction losses from pipes leading to the pump inlet.
In the process procedure itself, the cook kettles are initially closed off from the pump and the cooking procedure begins as a batch operation. The sauce is then mixed in the kettle while a jacket filled with steam provides heat for the duration of the cooking time. Once satisfactory conditions are met according to the recipe, the sauce is then pulled out of the cook kettles into the pumps to be transported, and it is at this last stage of the sauce cooking and delivery process which concerns NPSHa.
The equation for NPSHa is shown below in Equation 1. In this equation, h_atm represents atmospheric pressure, h_vpa represents bubble point pressure, h_st represents pressure due to the tank fill height, and h_f represents the pressure loss due to friction in the pipes.
NPSHa = (h_atm) + (h_st) – (h_vpa) – (h_f) (Equation 1)
In a singular kettle, NPSHa analysis begins at the top of the cook kettle, which is open to atmospheric pressure, represented by h_atm. Since the kettle is partially filled with sauce, the sauce on top presses down on the sauce at the bottom, subjecting it to greater pressures at depth which assists in forcing the fluid through the piping to the pump. However, as sauce drains from the kettle, the volume and surface height of the sauce left in the cook kettle drops. In return, this behavior forces the pressure acting on the sauce in the piping beneath the kettle to drop as well. This pressure due to the tank fill height is represented as h_st in Equation 1.
In addition, each sauce will boil at a different temperature. This intricacy is accounted for as h_vpa in Equation 1. This term represents the vapor pressure (for pure fluids) or bubble point pressure (for mixed fluids/solutions). Therefore, in order to accurately determine NPSHa for sauce flowing into the pump, bubble point pressure data for each sauce must be determined.
Furthermore, as sauce flows down the pipe towards the pump, it loses pressure due to friction. This is represented by h_f in Equation 1. Equations for defining h_f can be found below in Equations 2 and 3.
h_f = (32/Re)((L_eq)(v^2)/(Dg)) Equation 2
Re = (D)(v)(rho)/(mu) Equation 3
As shown in Equations 2 and 3, the fluid density (rho), the velocity (v), the viscosity (mu), the pipe equivalent length (L_eq), and the pipe diameter (D) must be known in order to determine NPSHa. For the accurate analysis, detailed measurements of the plant as well as sauce characterization data (density and viscosity) must be collected.
To determine NPSHa, the following sauce characteristics must be determined: bubble point, viscosity, and density. Futhermore, pipe details such as pipe material, length, and diameter must be known. Once NPSHa is determined, cavitation potential can be analyzed.
As demonstrated in Figure 6, as long as NPSHa is greater than NPSHr, the pump will function correctly as enough pressure will be available to run counter to the vacuum produced at the pump inlet. However, if NPSHa dips below NPSHr, then there will not be enough pressure available and the pump will cease to function properly, resulting in cavitation.
Vacuum Chamber Construction
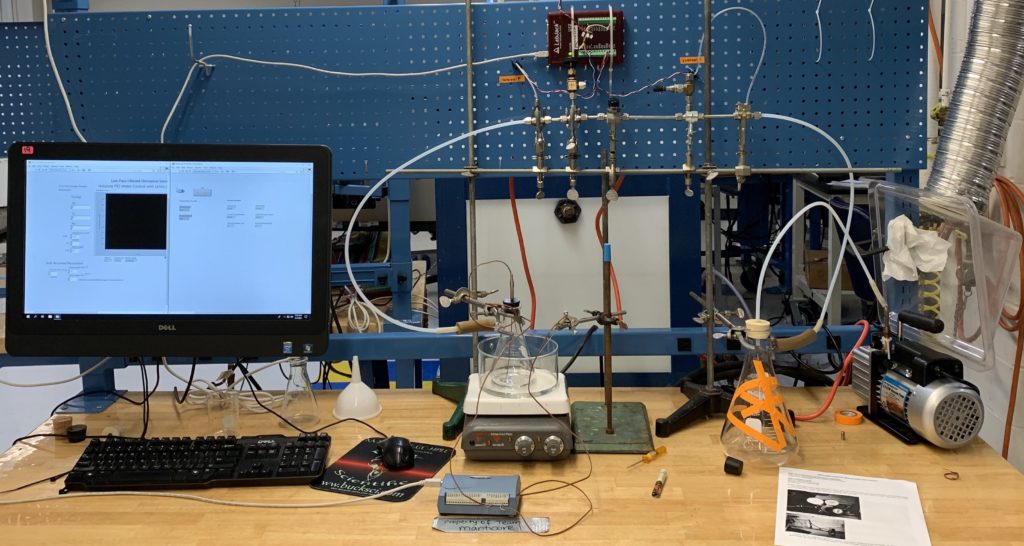
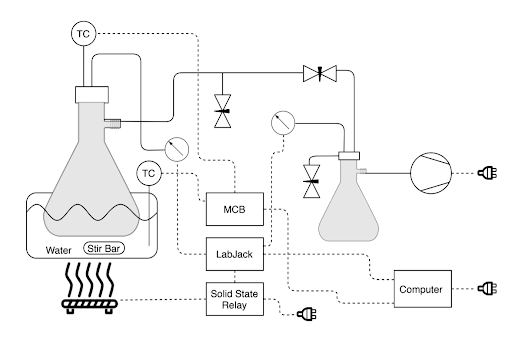
In order to determine the bubble point pressure of each sauce type at varying temperatures, it was necessary to construct a temperature controlled vacuum chamber. A photo of the vacuum chamber assembled by Team Manticore along with the process and instrumentation diagram (P&ID) utilized in the assembly of this vacuum chamber can be found in Figures 8a and 8b respectively.
Physical Assembly
The materials utilized for the construction of the vacuum chamber are listed below:
| Hot Plate | Smaller Tubing (can withstand vacuum) |
| Solid State Relay | Small Tubing for Pressure Sensors |
| Large Erlenmeyer Flask with Stopper | Three Ring Stands |
| Medium Size Erlenmeyer Flask with Stopper | Metal Support Bar |
| Vacuum Pump | S Clamps for Piping and Flask Support |
| Ventilation Equipment | Shallow Bowl for Water Bath |
| Labjack | Two Needle Valves |
| Measurement Computing Board | Globe Valve |
| Two Printer Cables | Five Swagelok T Pipe Connectors |
| Two Thermocouples | Four Swagelok Pipes |
| Two Differential Pressure Sensors | Zip Ties |
| Vacuum Tubing | Computer with LabView |
| Medium Sized Tubing (can with-stand vacuum | Tape |
In this assembly, all piping was connected using Swageloks to create a tight seal and prevent leakage. Swageloks were also utilized to connect the pipes and the tubing in the system. Tubing was selected such that they could be connected to the Erlenmeyer flasks by simply sliding one into another, creating an airtight seal. In addition, once the vacuum chamber was built, in order to detect the presence of any leakage in the system, ethanol was squirted on the connection spots while the system was operating. The signs of the ethanol bubbles would indicate the existence of the leakage in that spot.
The vacuum pump in Figure 8 created a vacuum throughout the system. The pump was connected to the rightmost Erlenmeyer flask (medium size flask), creating a vacuum there. The flask was taped to prevent injury in the case of implosion due to low pressure, although this was extremely unlikely. This flask was included as an attempt to catch any particles coming through the tubing so that they would not be sucked into the vacuum pump. The tubing continued out this flask to the piping section.
A T-joint lead to a pressure sensor immediately after the rightmost flask. The piping was then attached to another T-joint with a needle valve opening up into the atmosphere. The vacuum pump was ran at a constant speed and the needle valve was used to control the pressure in the chamber. By opening up the needle valve, more air was allowed to escape and the pressure in the chamber was lowered. The piping then led into a globe valve, which was used to separate the two parts of the system; the leftmost and rightmost flask. The piping then led into another T-joint with another needle valve opening up to the atmosphere. This needle valve was installed for safety purposes to relieve pressure on the left side of the globe valve if needed. However, this valve generally remained closed.
In this assembly, all piping was connected using Swageloks to create a tight seal and prevent leakage. Swageloks were also utilized to connect the pipes and the tubing in the system. Tubing was selected such that they could be connected to the Erlenmeyer flasks by simply sliding one into another, creating an airtight seal. In addition, once the vacuum chamber was built, in order to detect the presence of any leakage in the system, ethanol was squirted on the connection spots while the system was operating. The signs of the ethanol bubbles would indicate the existence of the leakage in that spot.
The vacuum pump in Figure 8a created a vacuum throughout the system. The pump was connected to the rightmost Erlenmeyer flask (medium size flask), creating a vacuum there. The flask was taped to prevent injury in the case of implosion due to low pressure, although this was extremely unlikely. This flask was included as an attempt to catch any particles coming through the tubing so that they would not be sucked into the vacuum pump. The tubing continued out this flask to the piping section.
A T-joint lead to a pressure sensor immediately after the rightmost flask. The piping was then attached to another T-joint with a needle valve opening up into the atmosphere. The vacuum pump was ran at a constant speed and the needle valve was used to control the pressure in the chamber. By opening up the needle valve, more air was allowed to escape and the pressure in the chamber was lowered. The piping then led into a globe valve, which was used to separate the two parts of the system; the leftmost and rightmost flask. The piping then led into another T-joint with another needle valve opening up to the atmosphere. This needle valve was installed for safety purposes to relieve pressure on the left side of the globe valve if needed. However, this valve generally remained closed.
The piping then lead into the final T-joint, which lead into a pressure sensor for the left side of the system. This pressure sensor was used to measure the pressure in the leftmost flask (large flask). The T-joint was then connected to the leftmost Erlenmeyer flask with tubing. This leftmost flask , or ‘Sauce Flask’, was filled with tomato sauce samples during the data collection process for sample testing. A thermocouple was inserted into the Sauce Flask through a hole in the cork. The Sauce Flask was placed in a water bath atop a hot plate. A second thermocouple was positioned to read the temperature of the water bath. The entire structure was supported using a series of ring stands and clamps. The process and instrumentation diagram for this vacuum chamber is presented in Figure 8b.
Pressure Sensors
The low pressure node on each sensor was connected to the system via tubing whereas the high pressure node was left open to the atmosphere. The pressure sensors were then wired to the LabJack which was then connected to the computer. The pressure sensor readings were collected by the LabView program generated by Team Manticore. Each pressure sensor output a voltage into LabView. This voltage was then converted into a pressure. To determine the relationship between voltage and pressure, the sensors were calibrated. For this calibration process, a syringe was attached to the low pressure node via tubing. The syringe was then drawn out to different volumes, and the applied pressure was determined using the ideal gas law (PV = nRT). The voltage results versus the pressure readings were then plotted. From this plot, a linear relationship was generated between voltage and pressure which was then used to interpret the pressure sensor readings.
Temperature Control
The sauce flask was held in the water bath using a clamp. The water was then heated using the hot plate. The hot plate was hooked to a solid state relay, which was then attached to a LabJack. A LabView program was generated by Team Manticore to create an on/off control system for the hot plate. One thermocouple was positioned in the water bath while the other was positioned in the sauce within the Sauce Flask. The thermocouples were then hooked to a measurement computing board so that they could be read using LabView. The hot plate was then set to a constant temperature and controlled by the LabView with on/off control. A feedback loop was then created in this LabView program between the temperatures from the thermocouples and the on/off cycles of the hot plate. A PID controller was tuned to control the temperature of the water bath to within 1 degree Farenheight. Since the specific heat capacity (CP) of water is much lower than that of tomato sauce, it is safe to assume that the control of water temperature would be greater than the control of the sauce, although this assumption was not tested. A more in depth look at the LabView program can be found in the LabView tuning instructions file in the package.
Sauce Characterization
The main goal of the second phase of this project was to perform sauce characterization tests in order to determine the variables that were causing problems in the current pumping system at LiDestri. To accomplish this part of the project, the original plan before COVID-19 was to characterize the sauces by recording the bubble-point pressure at varying temperature, the absolute pressure experienced in the pipeline, the viscosity at different temperatures and at different shear rates, and the density results at requisite temperatures. The next plan was to use these results to investigate the performance of the current pumping system with respect to each recipe. Moreover, the sauce characterization results would be utilized in exploring the effectiveness of potential solutions.
To characterize sauces, several cases of sauce were provided. However, in the LiDestri process system, the sauce samples undergo intense heating after being fed through the concerned pumps. It was determined that this heating likely changes the characteristics of the sauce dramatically. Therefore, Team Manticore planned to collect sauce samples directly from the cook kettles to compare with the packaged samples provided. Although the finished sauces were more readily available, it was determined important to test the sauce before extreme heating. If the pre-heated and post-heated sauces had similar characteristics, then the post-heated sauces could be used for further analysis. For time efficiency, it was determined that the pre-heated sauces would’ve been tested first. This type of testing was applicable to all properties.
Bubble Point Pressure
Bubble point pressure is the pressure at which the first gas bubble in a fluid of constant temperature is formed [2]. Bubble point is used in the NPSHa calculations as seen in the cavitation section. Furthermore, measuring the bubble point pressure would reveal the minimum absolute pressure necessary at the pump inlet to prevent cavitation. The plan before COVID-19 was to collect the bubble point pressure at varying temperatures for each recipe using a vacuum chamber. Additionally, the original goal was to determine whether cavitation occurs during the production period at desirable pump speeds by comparing the bubble point pressure results with the absolute pressure measurements at the pump inlet for different sauces [5].
Before the mandatory closure of the project, the goal was to test the samples that were collected from the cook kettles and to share the standard data with LiDestri. For the bubble point pressure measurements, a vacuum chamber was built by Team Manticore. More detailed information on the assembly of the vacuum chamber can be found in the vacuum chamber construction section.
Data Collection methods:
The following procedure was determined for the bubble point measurement using the vacuum chamber assembled by Team Manticore. During the data collection process, the samples would be tested at different temperature points across the range of expected kettle drain temperatures. First, the sauce would be heated to the low end of the concerned temperature range. The pressure would then be lowered until the sauce began to bubble, showing the bubble point of the sauce, which would be recorded. The sauce would then be raised back to atmospheric pressure, then would be heated up to the next temperature in question. The process would be repeated until bubble point is determined over the range of possible temperatures flowing into the pump. It is important to note that as the sauce bubbles, gasses escape from the sauce that may significantly change the composition of the pump and future bubble point. As a result, it might be important to keep the number of trials performed on each sauce sample to a minimum. To determine if this was important, trials of new sauces versus ‘re-used’ sauces could be compared.
Once all the bubble point pressure values were collected for the various sauces, the plan was to create an Excel sheet containing all the characterization results. The additional focus of this part of the project was to give the plant operators a sheet that contains all the characterization results so that they could compare the bubble point pressure with the operational absolute pressure at the pump inlets. With this sheet on hand, it would be easier for the operators to determine whether the absolute pressure at any of the pump inlets has dropped below the bubble point pressure [2]. Using the information in this Excel document, additional actions can be taken in order to avoid cavitation.
After the mandatory project closure due to COVID-19, this part of the project was cut short. Although the assembly of the vacuum chamber was completed, due to the new circumstances it had to be taken apart without being utilized for data collection.
Viscosity
Viscosity is the quantitative analysis that is utilized to understand the flow resistance of specific fluids. In order to obtain a pumping system that is capable of transferring fluids, the viscosity results of the fluid being pumped must be considered in the design. By analyzing the viscosity range of tomato sauces produced in the facility, the required viscosity boundaries for the pumping system can be detected.
The primary focus of the viscosity characterization was to obtain a quantitative analysis on the capacity of the current pumping system. After discussing with the engineers on the site, it was discovered that the entire sauce manufacturing section of the plant was built based on the characterization results of the compositionally basic Francesco Rinaldi Tomato & Basil sauce recipe at room temperature. With the production of additional sauces and the increase in the operation temperature, the cavitation problem was detected. Comparing the viscosity values of both problematic and non-problematic sauces would be utilized to create a qualitative analysis to determine whether the current pumping system is suitable for the production of this many sauces. The problematic sauces are identified as the sauces that cause the cavitation problem in the pumping system during the production period. On the other hand, the non-problematic ones show the opposite behavior where the production happens without any issue in the pumping system.
For this project, the viscosity values for each sauce would be measured at different temperature points. This is intended to illustrate the relationship between viscosity changes and temperature changes within the sauces. Using this collected information, a calibration curve would generated for future usage. In addition, these viscosity measurements would be utilized for further Reynold’s number and NPSHa calculations as discussed in the cavitation section. Moreover, the viscosity results would be analyzed in order to confirm the assumption that all concerned sauces are shear-thinning, as is typical of tomato sauce.
Data Collection
For the data collection process, the advantages and disadvantages of two different viscometers available at the University of Rochester were determined. The first one was the viscometer available at the University of Rochester Biomedical Engineering Department in Goergen. The biggest advantage of this viscometer was its ability to control the temperature of the sample. However, after testing some samples, it was decided that this viscometer is not suitable for samples that contain chunky materials since it requires only a couple drops of each sample, meaning that it could not incorporate large chunks in its testing. The second option was the viscometer available at the University of Rochester Chemical Engineering Department in Gavett 109. Although this viscometer was not temperature controlled, it had the ability to provide both viscosity and density results. In addition, this viscometer would allow the testing of larger samples, incorporating chunks into the viscosity measurements. It was concluded that due to its ability to test for larger volume of samples, the viscometer in Gavett was most suited for measuring sauce viscosity.
Unlike the viscometer in Goergen, the one in Gavett 109 is not temperature controlled, therefore a procedure must be created that would allow the sample temperature to be controlled. Additionally to provide more consistent results, the volume of all the samples must be kept constant throughout the entire data collection period.
In terms of the geometry that would be used for viscosity testing, it was determined that with the usage of the smaller geometry less noise would be generated in the data. Therefore, for this project, the smallest geometry available in Gavett 109 would be used for the data collection process. In order to save time, Team Manticore decided to test the samples from the cook kettles since the properties of these samples are the ones that are affecting the pumping system in LiDestri.
Additional Resources
Before COVID-19, it was determined that all the data collection processes for viscosity would be performed utilizing the parameters that are already implemented in the system for ketchup testing. After comparing the characteristics of the tomato sauces and ketchup, it was determined that both of these samples had fairly similar viscosity behavior. Thus, using the ketchup parameters for the tomato sauce viscosity testing should not cause any problem. The literature values for the viscosity measurements of water and ketchup at 70 ˚F can be found in Table 2. This table was generated to show the possible viscosity range for the tomato sauce samples [14].
| Temperature (deg F) | Water Viscosity (cP) | Ketchup Viscosity (cP) |
| 70 | 1 | 50,000 |
Depending on the water content of each sample the viscosity results of the sauces can be close to that of water. Additionally, the highest viscosity value they could obtain would be close to the viscosity of ketchup due to its thick consistency. Overall, the standard viscosity measurements of the tomato sauces samples should be within the viscosity results of water and ketchup. However, this is a very broad range of viscosities, which is demonstrative of the level of ambiguity when using these estimations. Since viscosity is highly dependent on shear rate and temperature, these parameters offer only a rough estimate of the actual behavior of the system. For a full analysis, testing of the tomato sauce at different shear rates and temperatures would be necessary, which is no longer possible due to the mandatory project closure.
Density:
Density is a measurement of mass per volume that analyzes the compactness of a substance [2]. In this project, the density of each sauce would be determined to be used for Reynold’s number and NPSHa calculations as described. The density values for each type of sauce would be calculated by using its mass and volume.
DATA COLLECTION
Before COVID-19, the plan was to measure the mass and the volume of each sauce sample by utilizing a sensitive scale and a volumetric flask. Both items were available at the University of Rochester Chemical Engineering Department. In addition, the viscometer in Gavett 109 collects both the viscosity and the density samples. Therefore, for the sake of saving time, the team decided to compare the results of two different density experiments: using the viscometer and calculating density by measuring mass and volume of each sample. Depending on the comparison of these results, the goal was to decide which density measurements would be more efficient.
Absolute Pressure:
Absolute pressure is the total pressure acting on a spacial point within a fluid body, equivalent to the sum of the local gauge pressure at that point and the atmospheric pressure. In other words, absolute pressure is equivalent to NPSHa.
Absolute pressure going into the pumps could be measured directly using programmable logic controllers (PLCs) previously installed at LiDestri. If this absolute pressure went below the determined bubble point pressure for the given sauce and temperature, the pump would be expected to cavitate. Therefore, this information could be used by pump operators as a simple check to verify if the pump was close to cavitation: if the absolute pressure neared the bubble point pressure, the pump should be slowed down so that absolute pressure could be raised. In addition to calculations done using NPSHa, absolute pressure could provide another quick check that could be performed by plant operators to help prevent cavitation. However, absolute pressure provides no predictive power unlike NPSHa, so it could only be used as a quick-fix solution.
Due to COVID-19, the bubble point pressure for different sauces could not be measured. Therefore, the comparison of the absolute pressure values and the bubble point pressure measurements could not be performed due to the mandatory closure of the project.
Sauce Analysis Based on Literature Estimates
The arrival of COVID-19 prevented the sauce data collection which was a major partition of the original project plan. Therefore, the tools designed to interpret data to be collected during that part of the project were left without the feedstock to generate an accurate model of dynamic system behaviors. However, after reconfirming the completeness of the math model generated from plant measurements, it was decided that this model could be repurposed to provide insight into the complex pump system behaviors and to learn more about the feasibility of potential solutions.
To serve this end, a “SaucePressurePipeLossWidget.xlsx” Excel tool was designed to calculate friction and static head losses caused by the asymmetric pipelines linking each tank to each pump. Additionally, a “DrainingSauceHeightWidgetPlugin.py” interactive Python script plugin was generated to track the changes of the net pressure suction head available (NPSHa) as the tank drains. These modeling tools were developed using literature values in place of unavailable data to generate rough approximations of NPSHa behaviors for each pump during the tank draining process. NPSHa was calculated as described in the “Cavitation and Net Positive Suction Head” section above.
It is important to note that although the following estimates used in the models currently lack precision with respect to the system present in LiDestri, they can be useful in assessing the viability and impact of potential changes to the sauce transport line. Furthermore these estimates and the programs can be updated in the future with data on sauces of interest and pump system data to yield results which better reflect the actual pump system behavior.
System Assumptions
This section mainly focuses on the assumptions that were used in developing the two process models. Overall, these assumptions were made in order to produce the estimate behavior curves.
Assumed Sauce Data
The pasta sauce data used in this rough system estimate is based on data synthesized from a few sources. The stand-in density (ρ) of the estimate is set to a constant of 1.06 g/cm^3 and is based on Gia Russa Select Tomato & Basil pasta sauce [8,10]
It is known that altering the pump speed results in changes in shear rates, which would result in changes in fluid velocity. Additionally, with respect to viscosity, the original plan was to construct viscosity versus shear rate profiles for target sauces experimentally with a viscometer. But, literature values had to be analyzed instead to arrive at a functional inferred viscosity due to the lack of data collection. Due to the new circumstances, there was a lack of a tested reference point for the dynamic behaviors of LiDestri brand sauces when subjected to pipe shear stresses and the system’s operating temperature. The observed literature values for tomato sauce viscosity over a variety of shear rates can be found in Figure 9. As shown in this figure, the effects of the shear rate on the viscosity of a tomato sauce can be observed. Additionally, in this figure, different shapes represent different spindle sizes. Therefore, it is possible to explore the effects of the spindle sizes on the viscosity and shear rate results as well.
Provided that the minimum applicable flow rate demanded of each pump is equivalent to 100 GPM, this flow rate was converted to a shear rate to get a rough understanding of the stresses on the sauce flow in the sauce transport line. To convert 100 GPM into a shear rate, Equations 4, 5, and 6 were used where S is the shear rate, v is velocity, d is pipe diameter, A_c is the cross-sectional area, and v_dot is flow rate [9]. Data used in these calculations, as well as the results, are shown in Table 3. For these calculations, it was assumed that the sauce was a Newtonian fluid.
A_c = 3.14d^2/4 Equation 4
v = v_dot/A_c Equation 5
S = 8v/d Equation 6
| d | 3.875 in |
| A_c | 0.0819 ft^2 |
| v_dot | 100 GPM |
| v | 1.658 m/s |
| S | 134.796 s^-1 |
In this analysis, a shear rate of 134.796 s^-1 was calculated. Although the shear rates analyzed in Figure 9 are an order of magnitude smaller than the shear rates estimated for the LiDestri system, Figure 9 regardless implies that the previously established shear-thinning nature of LiDestri sauces will permit sauce viscosity to plateau at a lower limit when subjected to a sufficiently high shear rate. Considering the minimum temperatures and flow rates at which sauce is being transported in the LiDestri manufacturing environment, it is possible that LiDestri sauces are subjected to a high enough shear rate that the head loss contribution of outstanding rheological behaviors is rendered negligible. So, this observation was the basis upon which an assumed constant viscosity of μ = 100cP was to be used for the estimation of system behavior in the absence of data collection. Additionally, it was determined that a constant viscosity assumption was successful in facilitating the pressure loss calculations as net pressure suction head available (NPSHa) values produced roughly reflected the observed suction capabilities of pumps SC-5511 and SC-5521.
Assumed Flow Data
Without a sufficient description of sauce density and viscosity, it is impossible to accurately judge whether the flow regime inside of the pipes is laminar, transitional or turbulent. This inaccuracy naturally affects an accurate reading of friction and static pipe head loss magnitude, as well as the magnitude of static head losses that occur while tank drainage is occurring. To proceed with the estimate, a laminar flow regime was assumed for all throughput flow rates accessible to the pump. This assumption was made based on the observation that even with a conservatively low assigned viscosity of 100 cP and at flow rates moderately above the minimum 100 GPM demanded of each pump, the Reynolds Number calculated for the system flow remains Re < 2300. This assumption may have to change if individual pumps are run in excess of 130 GPM. Additionally, if the processed sauces are capable of thinning to viscosities below 100 cP and/or if ρ >>1g/cm^3 for the processed sauces, this assumptions might need to be adjusted.
Assumed Pump Behavior
In the generated models, it was assumed that the current pump behavior would be acknowledged by the system estimate, such that the flow rate demanded of each pump remains constant during the draining process. Here, it must be noted that pump friction losses are strongly determined as a function of flow rate in a laminar regime, changing the Reynolds Number of the flow in the process. Given this fact, it is not possible at this point in time to generate a serviceable estimate of a system with a dynamic flow rate. Thus, instead of this model, an estimate model of the current pump system would be generated to demonstrate how the magnitude of friction losses changes with fluctuations in flow rate. By assuming a constant flow rate demanded of each pump, non-negligible friction losses will remain constant. With the assumption of constant values for viscosity, density, flow regime and flow rate demanded data, the resultant relationship between Percent Full and NPSHa discussed in the next section becomes first order. This suggests that NPSHa is driven exclusively by static head changes such that the following statements hold:
y = mx + b Equation 7
Using Equation 7, the following assumptions were made where y, m, x, and b values were determined to be NPSHa, pg, h, and NPSHa at 0% respectively.
System Behavior Estimation and Analysis
The following three sets of values listed in Tables 4, 5, and 6 were utilized in the models generated by Team Manticore. These parameters shown in each table for different conditions were utilized in the “SaucePressurePipeLossWidget.xlsx” and “DrainingSauceHeightWidgetPlugin.py” programs in order to generate the models.
| μ | 100 cP |
| ρ | 1.06 g/cm^3 |
| v_dot | 100 GPM |
| v | 1.658 m/s |
| T | 153 K |
| BPP | 3.985 psia |
| μ | 100 cP |
| ρ | 1.06 g/cm^3 |
| v_dot | 120 GPM |
| v | 1.99 m/s |
| T | 153 K |
| BPP | 3.985 psia |
| μ | 100 cP |
| ρ | 1.06 g/cm^3 |
| v_dot | 120 GPM |
| v | 1.99 m/s |
| T | 150 K |
| BPP | 3.702 psia |
The stand-in data points listed in tables 4,5, and 6 were charted and rendered as the comparisons depicted in Figure 10 and Figure 11. The following relationships were generated to map the changes in NPSHa during the drainage of tank K-1 from 100% to 0% where kettle is brim-full to a height of h = 7.15ft. In addition, these figures were utilized in determining the effects of the variations in NPSHa on the flow rate and the temperature values.
Figure 10 was generated to examine the relationship between the NPSHa and tank fill percent at 100 GPM and 120 GPM for different pump models used in LiDestri. In this figure, it was determined that escalating the flow rate of the pump from a fixed 100GPM to 120GPM significantly affects the NPSHa at each pump inlet. According to this model, an additional ~0.4 psia is lost to pipe friction at the inlet of each pump when flow rate is increased. Additionally, the pressure loss disparity between SC-5511 and SC-5521 grows from ~0.2 to ~0.3 due to friction losses caused by the flow rate increase as well. As SC-5521 is the pump furthest away from tank K-1, this disparity further limits the amount of suction SC-5521 can pull.
In Figure 11, the analysis was conducted to determine the changes in NPSHa with the tank fill percent at different temperature points. Using this figure, it is achievable to state that lowering the temperature a minuscule 3 degrees significantly affects the NPSHa at each pump inlet. According to this model, ~0.3 psia is restored to the system by dropping the temperature while keeping the elevated flow rate constant. The pressure loss disparity between SC-5511 and SC-5521 remains the same as in Figure 10 at ~0.3 when the flow rate stays constant. Additionally, it was determined that since SC-5521 is the pump that is furthest away from tank K-1, this disparity further limits the amount of suction SC-5521 can pull.
Given the above estimations of the twin-screw pumps’ behaviors in the sauce line, it must be acknowledged that there is a potential applicable process solution that can solve LiDestri’s cavitation problem without any additional large equipment installations: a pump controller. To keep the suction drawn by both pumps below their NPSHa lines such that cavitation does not happen, the flow rate of the pumps could be varied such that tank drainage is faster at the beginning of the process while the tank is fuller, but is dialed back progressively as the tank empties. However, provided that the pasta sauce is shear-thinning and the influences of static head losses and friction losses are non-negligible, accurate dynamic pump control can only be achieved with a more robust understanding of the system parameters. All three factors which a controller would need to take into account would necessarily be dependent on a time-dependent flow rate in a dynamic pump control scheme. It is possible to optimize sauce throughput with dynamic pump control, but an optimized higher-order controller program would need to be researched, written, and integrated to dynamically account for the friction losses and dynamic static pressure losses during the tank drainage process.
To tune the pump without collecting a large amount of system data, a quick trial-and-error approach for establishing higher order dynamic pump control can be performed. One possible approach to implementing this variable-flow controller would be to install a motion sensor on each pump and run the pumps at the desired pump speed. When the pump begins to cavitate, this stress created by the cavitation rigs the motion sensor to send a signal to the controller which drops the flowrate by a fixed amount. A graph with a series of step changes will emerge from these actions. The discontinuous points at which the pump speed/flow rate is suddenly dropped can be fitted with a 2nd or 3rd order approximation curve in Excel to provide a better estimation of the function by which the controller output needs to operate in order to optimize the dynamic control scheme for sauce throughput. This control-based solution could bolster the impact of any one of the process modifications suggested in the following section if implemented in combination with one. It is highly recommended that this avenue of project work be pursued in addition to sizing an equipment-based solution.
Solution Recommendations
Some of the following solutions found in this section were determined after the investigation of the pumping system in LiDestri. Although these solutions were determined without considering sauce characterization results, the goal was to provide some insight on what the team was considering to implement before the unexpected closure due to COVID-19.
Bubble Point Estimate and Temperature Effects:
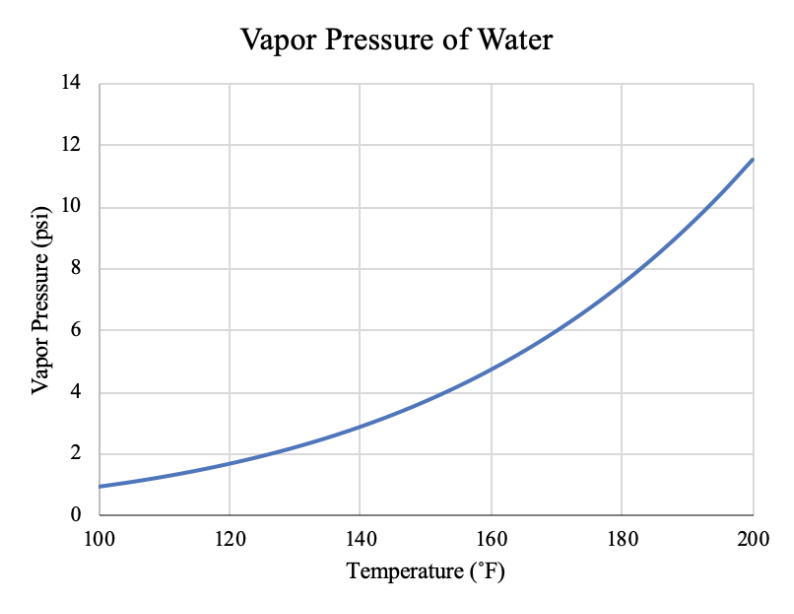
Due to COVID-19, bubble point data could not be collected for the range of sauces available. However, it was known that there is high water content in tomato sauce. As a result, the boiling point for water as a function of temperature was analyzed to provide insight into the system. To generate a vapor pressure versus temperature curve for water, Antoine Equation 8 was utilized. It is important to remember that this equation is valid only for pure fluids, so even though it is useful for the analysis of water, it could not be used for sauce vapor pressure calculations.
(log_10){P_vap} = A – [B / (T(˚C) + C)] Equation 8
In this section, a saturation curve for water was generated using the Antoine Equation given in Equation 8. The specific parameter utilized for the calculations can be found in Table 7 below. The results calculated using these parameters were plotted in Figure 12.
| A | B | C |
| 8.07131 | 1730.63 | 233.426 |
Figure 12 below shows a strong dependence between temperature and vapor pressure. Since tomato sauce has high water content, it is likely that its vapor pressure also shows a strong dependence on temperature. A change in only a few degrees Farenheight can cause a drastic change in vapor pressure relative to the NPSHa shown in the system. Therefore, it is possible that lowering the temperature of the sauce going into the pump would eliminate cavitation. However, in this analysis, it is impossible to draw a definitive conclusion or know exactly how much to lower the sauce temperature without having precise data on the sauce itself. Tomato sauce is a mixture with many different components, meaning that using water as a reference is only an extremely rough estimate. However, it can be stated that in general, lower sauce temperatures should cause less cavitation. This is certainly a promising avenue for future investigation.
Surge Tank:
One solution is to place a surge tank before the inlet of the pump. By placing a surge tank before the inlet of the pump, the head pressure of the pump can be increased. This increase in pressure will raise the temperature at which water can bubble, thus cutting down on the cavitation that occurs. This surge tank can be pressurized with compressed air. The LiDestri plant already has a pressurized airline that can be used for this purpose. This solution is both convenient and can cost anywhere in the range from 100 to 1800. One of the cons with this solution is that due to its size there might not be enough space to place this surge tank between the cook kettle and the pump.
Pump Bypass:
Another solution is to implement a pump bypass. Currently, only one cook kettle is drained at a time. The cook kettle is drained by the two existing pumps simultaneously. To decrease the capacity handled by each pump, another pump could be added such that three pumps handle the output of the cook kettle. As stated by Pete Tateo, the pumps start to shake when they are set to +100 GPM. Because the three pumps can run simultaneously to deliver the same load as two pumps they can be run at a lower rpm where no shaking and cavitation occurs. This solution is very feasible because LiDestri already has extra piping and a spare pump that can be used for this project. With this in mind, this potential solution may be the most practical and the easiest one to implement. However, it is important to ensure that each pump stays within its highest efficiency range. Every pump has a range of speeds in which it is most efficient. It is vital that the load of the system is split between the three pumps in such a way that none of their speeds fall below the pumps’ respective efficient ranges.
Taller Tanks:
Replacing the current cook kettles with larger ones is another possible solution. Increasing the size, and therefore maximum capacity of the cook kettles would significantly raise the NPSHa value at each pump inlet by increasing the contribution of static head pressure to the definition of NPSHa. This solution would allow more sauce to be pumped faster at the initial stages of tank drainage, but the cavitation issue would likely reappear since the amount of static head and its influence on NPSHa decreases as a tank’s fill percentage approaches zero.
Piping Alterations:
The last solution is to increase all pipe diameters that are in between the cook kettles and the pump. This increase in diameter will cut down on the friction loss as the sauce moves from the cook kettles to the pumps. In turn, the decrease of the friction loss will increase the absolute pressure at the inlet of the pump. Similarly to the surge tank solution explained in previous section, this increase in absolute pressure will raise the temperature at which the sauce will bubble which then will mitigate cavitation. Although previously stated in previous sections that LiDestri has spare piping, this only applies to the current pipe diameters in use. For this potential solution, completely new piping would have to be ordered and fitted to replace the current piping in use from the cook kettles to the pump. This solution can be easily implemented, but machine finish 16 piping can be quite expensive.
Overall Considerations:
Previously both pros and cons have been discussed for some of the solutions, but with all solutions four things must be kept in mind. The first is scaling. In the facility, the space between the cook kettles and the pump is rather small. All solutions may not be able to be scaled to fit this space. The second is feasibility. LiDestri has extra machinery and may want to use this for its familiarity, easy installation, as well as cost-effectiveness. Cost-effectiveness must always be kept in mind as the third point. In coordination with Pete Tateo and Lee Lindenmuth, a budget must be discussed. Considering this budget, the most efficient solution should be developed for this project. The fourth is safety. While all these solutions do not bring in any new machinery or technology that already is not in the plant, it is important to continue working closely with Pete Tateo to inform the staff of any new safety procedures or methods.
References
- {Electronic Pressure Sensor IFM PI2794}; Retrieved from https://www.automation24.com (accessed Feb 11, 2020).
- {Introduction to Chemical Engineering Thermodynamics}; Smith, J. M., et al.; McGraw-Hill Education; 2018.
- {Shear Rate Effect on Viscosity of Homemade and Commercial Tomato Sauce}; Jorge-Octavio, V.; Claudia-Karina, L.; Carmen, B.; Frixia, G.; Micloth, L.; Journal of Food Science and Engineering; 2017.
- {The Effect of Particle Shape on Suspension Viscosity and Implications for Magmatic Flows}; Mueller,S., et al.; AGU Journals, John Wiley & Sons, Ltd; 6 July 2011.
- {Water Supply}; Ratnayaka, Don D., et al.; Butterworth-Heinemann; 2009.
- {Waukesha Engineering Manual}; Waukesha Cherry-Burrell; 2002.
- {Wired Chemist}; Retrieved from http://www.wiredchemist.com/chemistry/data/vapor-pressure (accessed Feb 11, 2020).
- {Aqua-Calc.}; Retrieved from https://www.aqua-calc.com/page/density-table/substance/pasta-blank-sauce-coma-and-blank-upc-column–blank-026825008908
- {Shear Rate}; 2019, September 29 ; Retrieved from https://en.wikipedia.org/wiki/Shear$_$rate
- {UPCitemdb}; Retrieved from https://www.upcitemdb.com/upc/26825008908
- {Saturated Vapor Pressure}; Retrieved from http://ddbonline.ddbst.com/AntoineCalculation/AntoineCalculationCGI.exe?component=Water (accessed Apr 28, 2020).
- {Vapor Pressure of Water Calculator}; Pamu, H.; Retrieved from https://www.omnicalculator.com/chemistry/vapour-pressure-of-water (accessed Apr 28, 2020).
- {Fundamentals Of Momentum, Heat And Mass Transfer.}; Welty, J. R.;, Rorrer, G. L.;, Foster, D. G.; John Wiley&Sons.
- {Viscosity Tables}; Retrieved from http://www.vp-scientific.com/Viscosity$_$Tables.htm.