Author
Jingyan Yu
- Class of 2024
Lucy Chen
- Class of 2024
Xinyi Liu
- Class of 2024
Veronica Chistaya
- Class of 2024
Advisor
Cantay Çalışkan, PhD
Sponsor
Jack Bramley and Irena P. Boyce, Ph.D
Overview
Working closely with the UR Medicine Quality Institute, we are dedicated to enhancing search efficiency and fostering collaboration through our comprehensive improvement of the Quality Institute Projects Tracker. This platform is designed to capture, update, and systematically report on all continuous improvement efforts across UR Medicine. To tackle the complexity of project data and its interconnections, a multifaceted analytical approach was adopted.
Through detailed network analysis and intuitive visualizations, we have revealed the intricate web of project connections, thus facilitating more intuitive navigation and discovery. Additionally, by utilizing various clustering techniques, we have successfully classified projects into meaningful categories, thereby streamlining the search process. Furthermore, advanced text analysis was integrated to support a similarity search feature, which allows users to input keywords and swiftly discover related projects within the database. This functionality not only enhances collaboration but also assists researchers in designing new projects, grounded in the proven insights of past methodologies and outcomes.
Exploratory Data Analysis
Our data consists of two datasets. The first dataset provides a project-level summary of all existing projects in the Quality Tracker, consisting of various aspects such as the main purpose of each project, the medical specialty involved, the names and roles of all team members, a concise problem statement, and the primary improvement strategy employed. This dataset serves as a critical resource for understanding the scope, focus, and team dynamics of each initiative undertaken within the URMC.
The second dataset is a roster dataset containing detailed information about individuals involved in research at URMC. This includes data on each individual’s role, specialty, contact information, and their involvement in specific projects. This dataset is essential for mapping the network of collaborations and expertise, allowing us to analyze the distribution of research activities across different specialties and identify key contributors to various projects. Together, these two datasets offer a comprehensive overview of the research landscape at URMC.
Network of collaborations
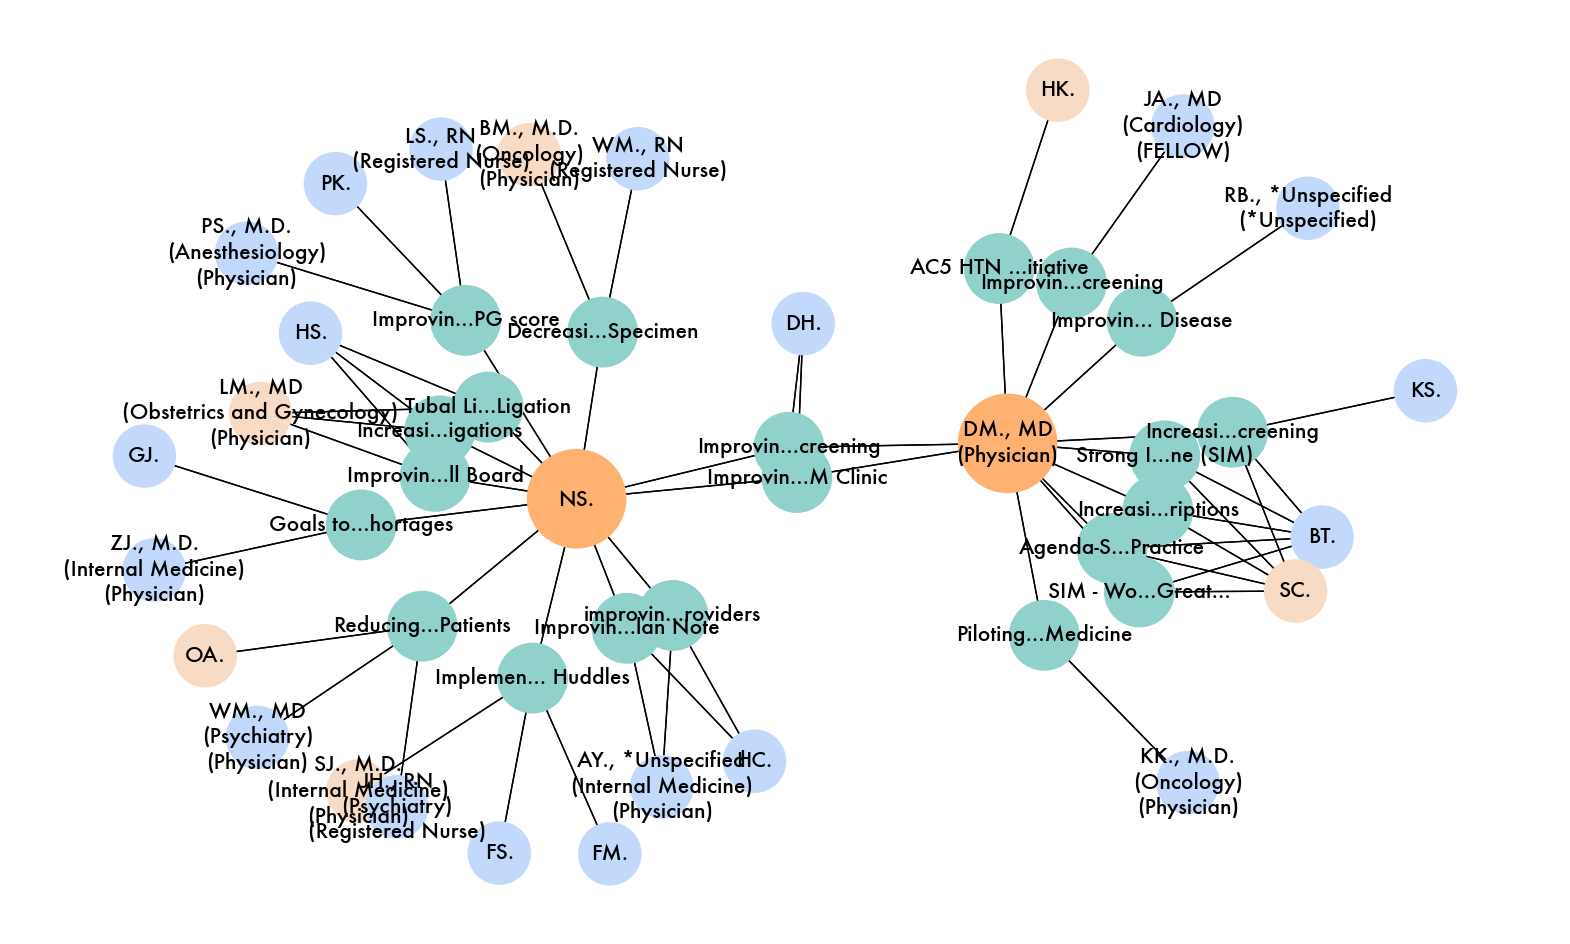
To visualize collaboration between projects, we drew network diagrams between individuals. Names and project titles were anonymized for privacy concerns.
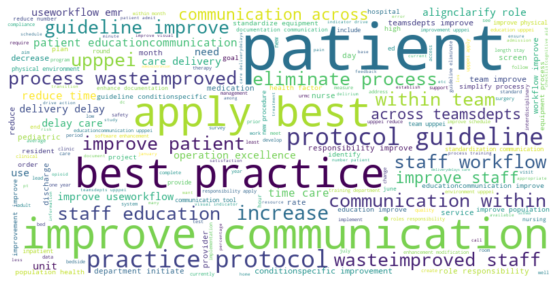
To account for the data scarcity, we merged various text features for text analysis. Here’s the word cloud for visualization.
Methods
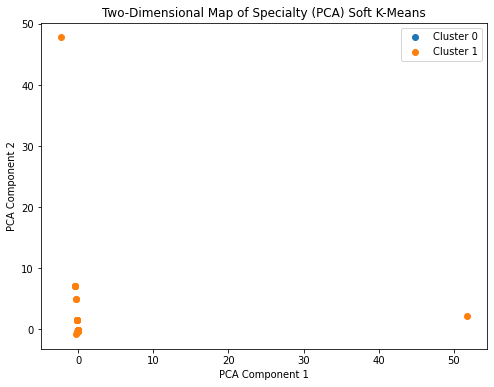
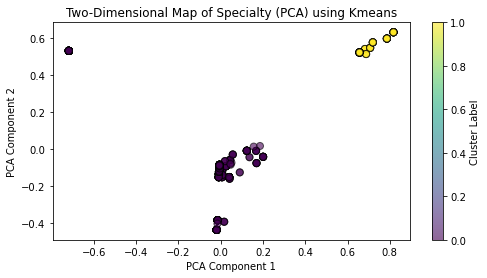
Clustering
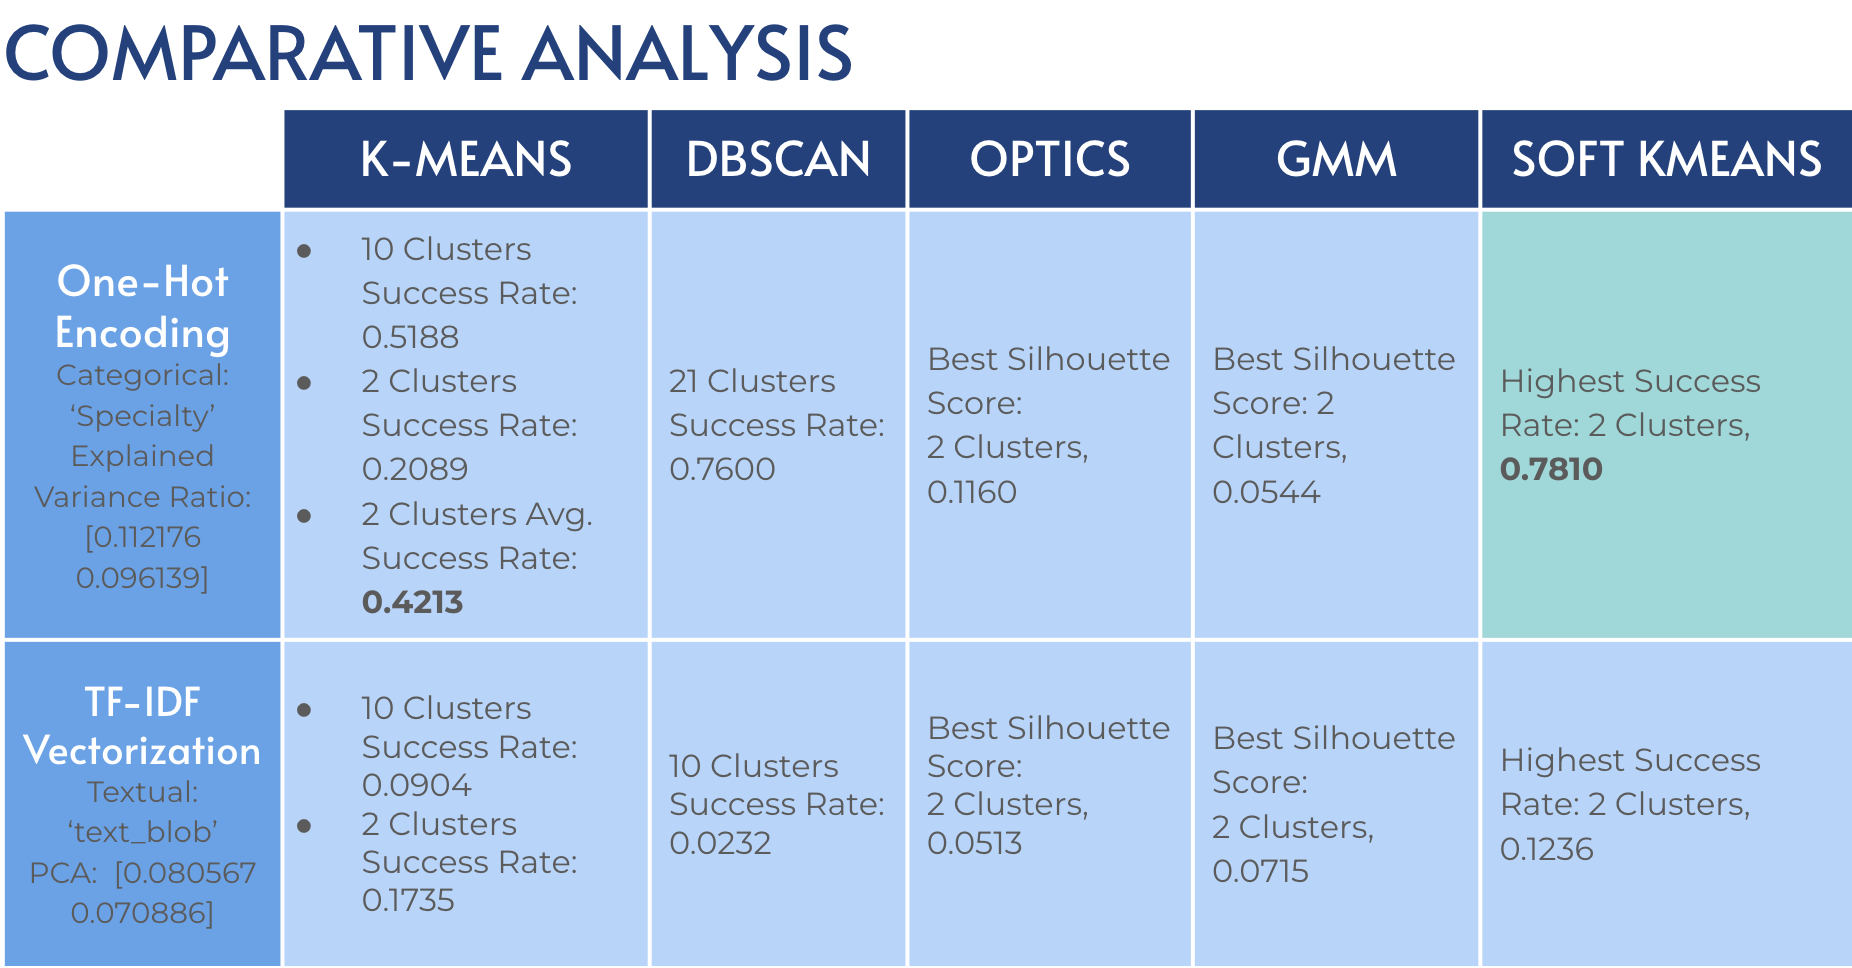
Density-based, centroid-based, probabilistic, and hierarchical clustering with One-Hot Encoding for the categorical columns and TF-IDF Vectorization for the textual columns were used to better understand the structure of the data.
Network Analysis
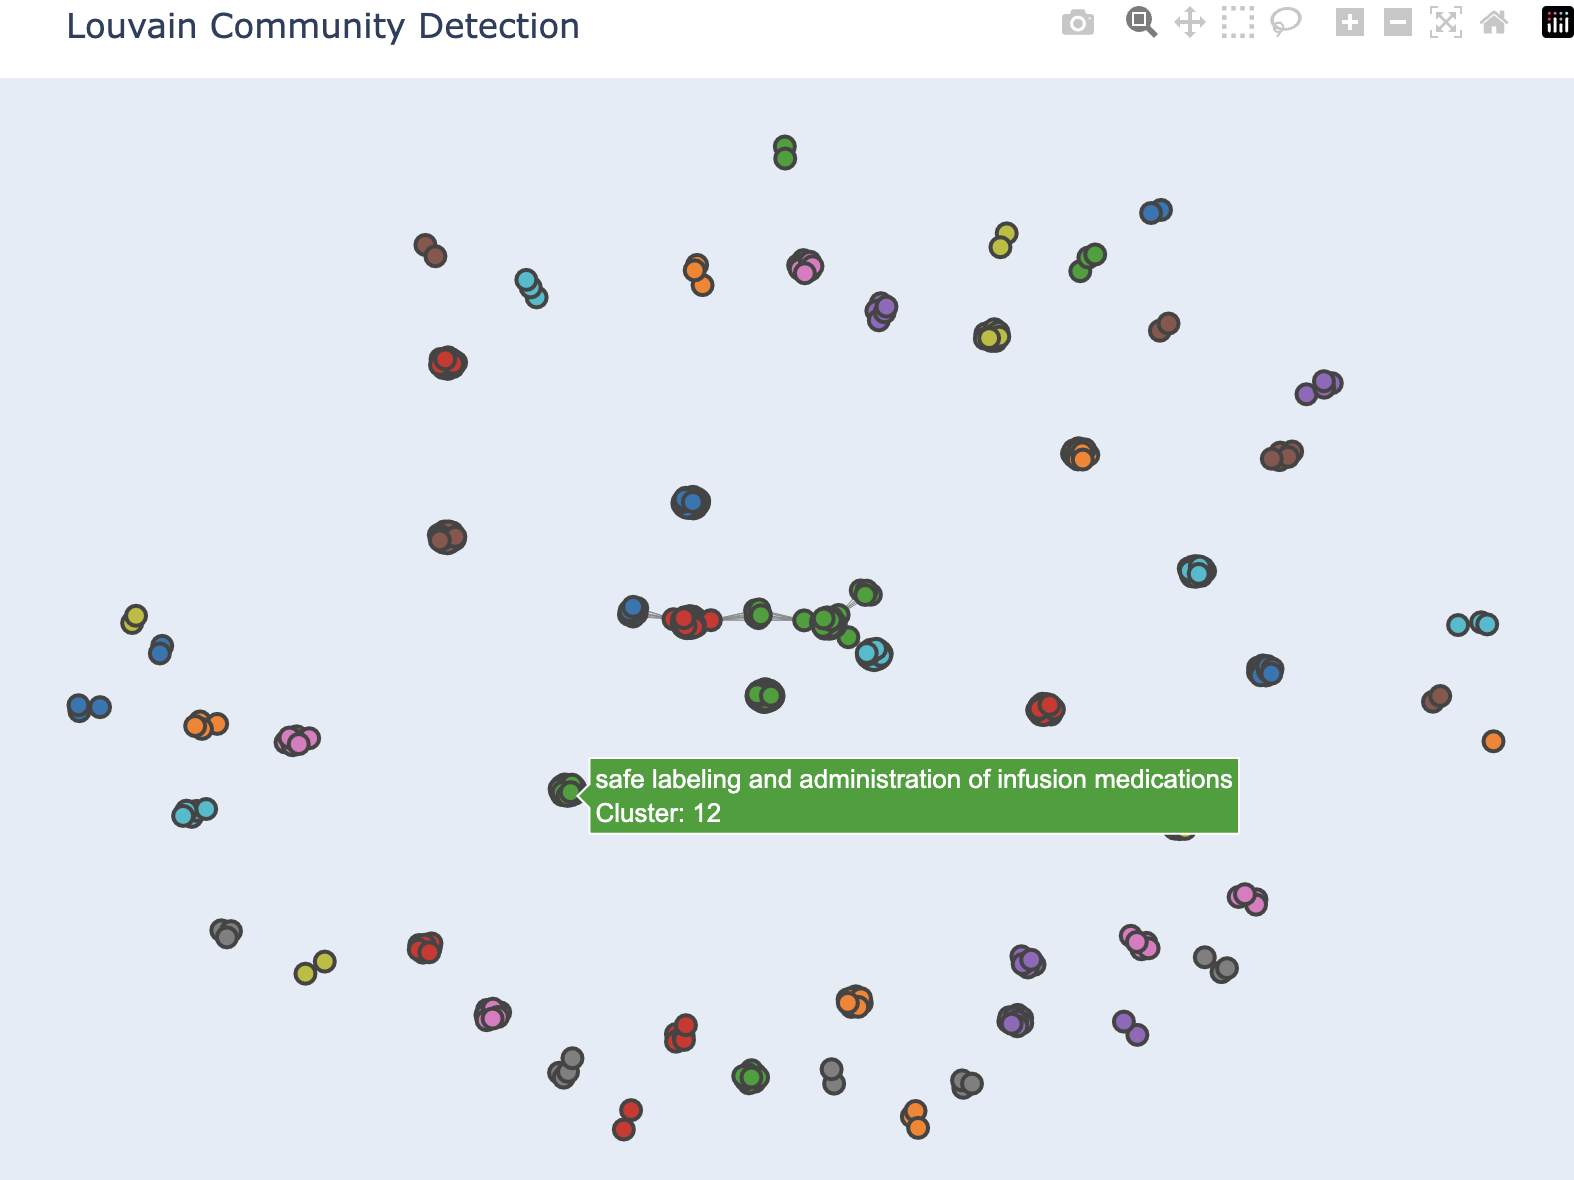
Louvain:
- An algorithm for detecting communities in networks that relies upon a heuristic for maximizing the modularity.
- The first step is to greedily assign nodes to communities, favoring local optimizations of modularity.
- The second step defines a new coarse-grained network in terms of the communities found in the first step.
- These two steps are repeated until no further modularity-increasing reassignments of communities are possible.
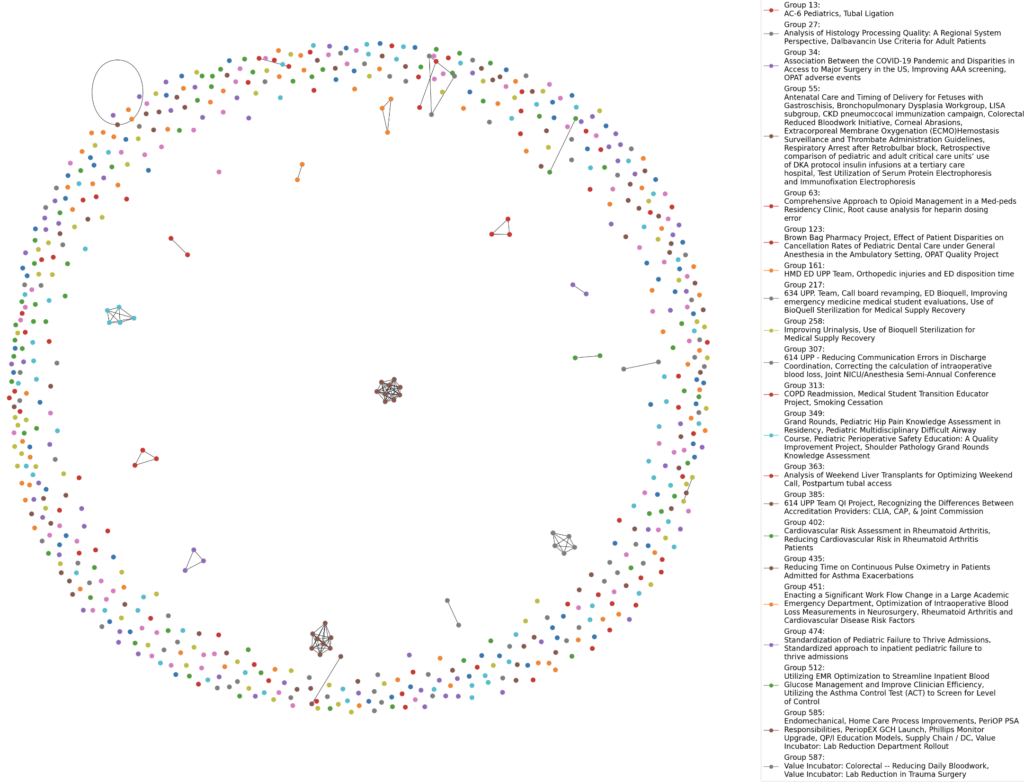
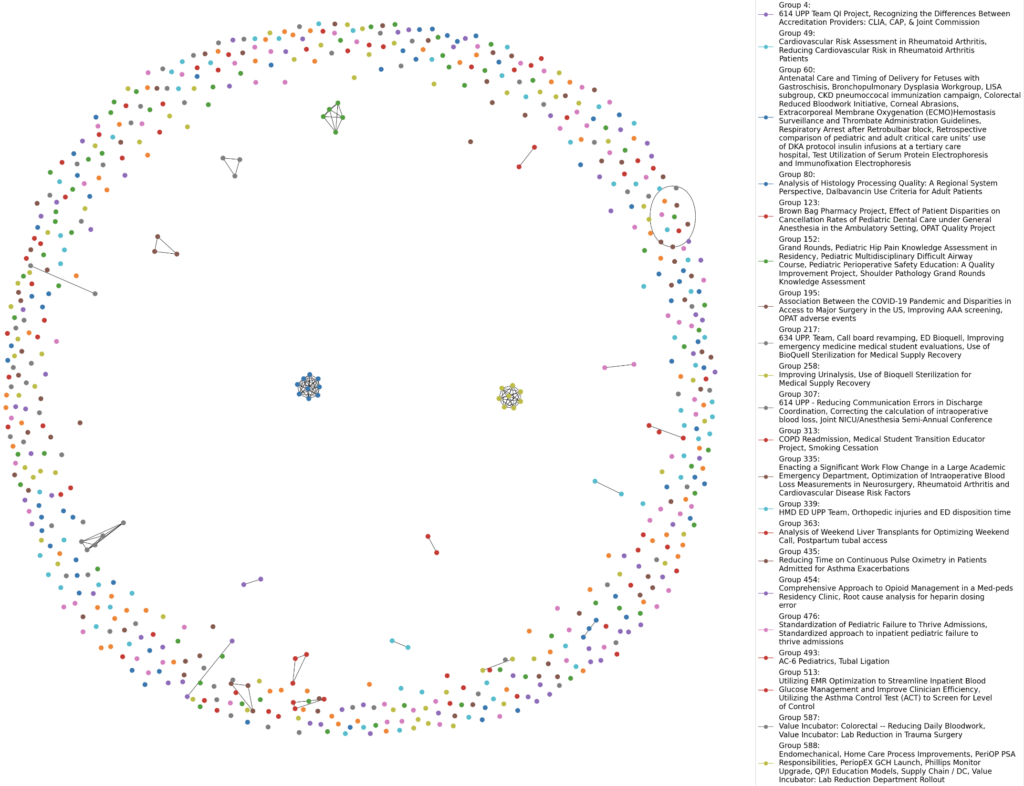
The graph below is an example of a network graph of how the different projects are grouped together by their specialties using the Louvain algorithm.
The graph below is an example of a network graph of how the text similarity in the projects text_blob groups together the different projects.
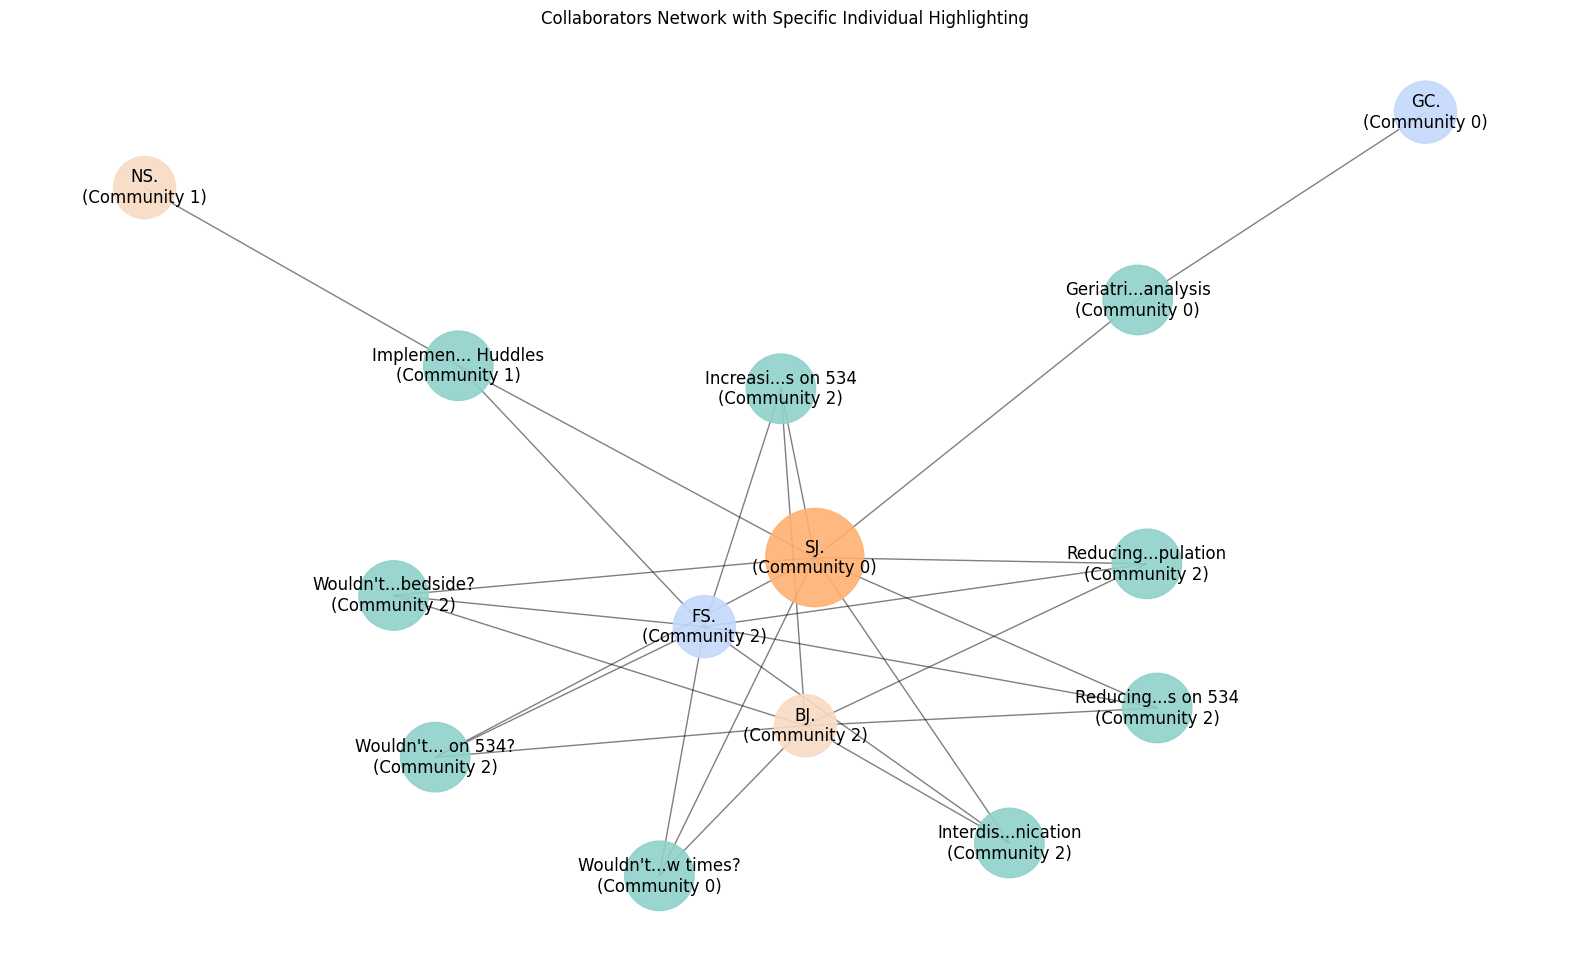
This graph is an example of a network graph for a singular person in this case the person “S.J.”
Leiden:
- A hierarchical clustering algorithm that merges communities into single nodes.
- Greedily optimizes modularity, which repeats in the condensed graph.
- The Leiden module has a resolution parameter that determines the scale of the partitioned cluster and the coarseness of the clustering.
- A higher resolution parameter leads to more clusters.
The graph below is an example of a network graph of how the different projects are grouped together by the text similarity in the projects text_blob using the Leiden algorithm this time.
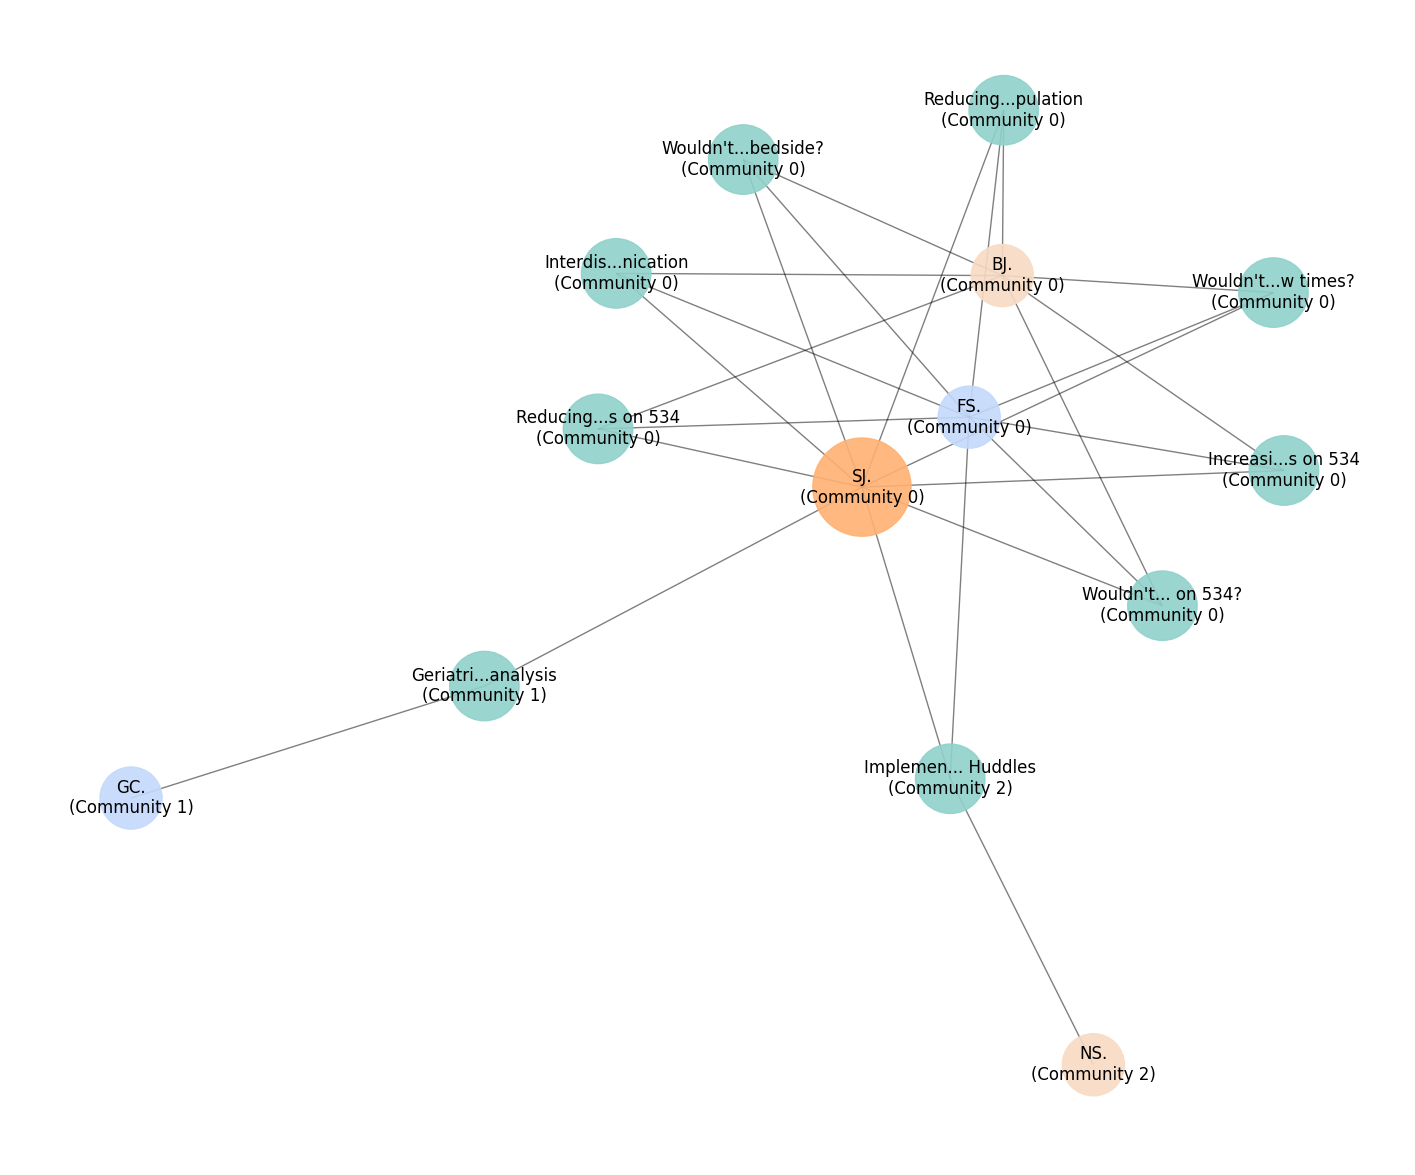
This graph is an example of a network graph for a singular person, in this case, “S.J.” However, this time, it is using the Leiden algorithm instead of the Louvain algorithm.
Similarity Search
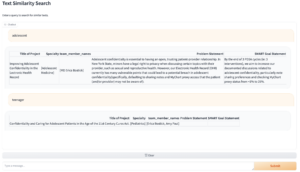 Each project is embedding into a vector with a pre-trained BERT model based on textual data, improvement strategy and team members. We used Facebook AI Similarity Search tool (FAISS) to match user queries with relevant projects based on cosine similarity between the vectors.
Gradio Chat Interface is used to allow users to input queries and view details about the relevant projects easily.
Conclusion
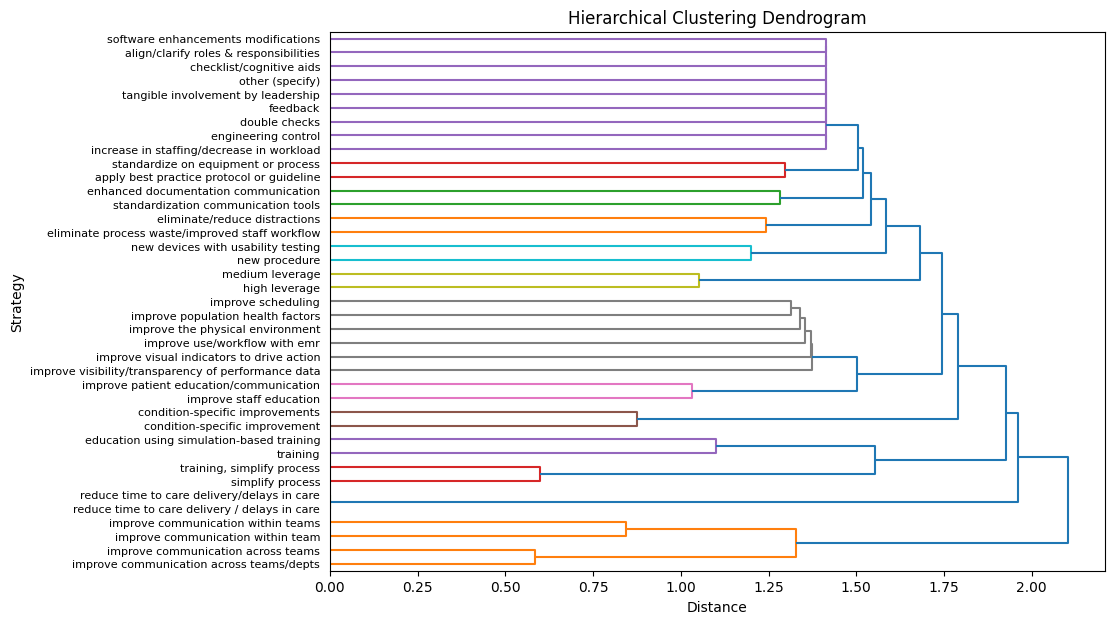
We compared the effectiveness of clustering projects with various clustering methods [3]. Our findings revealed that hierarchical clustering provided a deeper insight into project relationships.
Additionally, we performed network analysis to explore community relationships which was not apparent through traditional clustering methods. The combination of these methods allowed us to better visualize and understand project interactions and communities.
Our next step is to explore exponential random graph [4] models which can model the probability of edges between projects.
Acknowledgments
We would like to thank Prof. Cantay Caliskan for his continuous help and advice throughout the semester, as well as our sponsors, Jack Bramley and Irena Boyce, for their support throughout the project.
References
- Dawari, A. (2023). What are the advantages and disadvantages of K-Means Clustering? Towards AI. Retrieved April 6, 2024, https://towardsai.net/p/machine-learning/what-are-the-advantages-and-disadvantages-of-k-means-clustering
- Grabowski, E., & Kuo, J. (2023). Comparing K-means and OPTICS clustering algorithms for identifying vowel categories. Proceedings of the Linguistic Society of America, 8(1), 5488. https://doi.org/10.3765/plsa.v8i1.5488
- Olamendy, J. C. (2024). Understanding Gaussian Mixture Models: A Comprehensive Guide. Medium. Retrieved April 6, 2024, https://medium.com/@juanc.olamendy/understanding-gaussian-mixture-models-a-comprehensive-guide-df30af59ced7
- Introduction to ergms. Social Network Analysis for Anthropologists. (n.d.). https://eehh-stanford.github.io/SNA-workshop/ergm-intro.html