Team Flamingo Tongue Snails
- Christina Caulkins
- Kellie McCrea
- Theo(Peter) Thompson
Mentors
Wayne Griffin and Mark Juba
Abstract
Manufactured “forever chemicals” known as PFAS are abundant in consumer and industrial products, posing health risks. This project explores the most effective foam fractionation system for PFAS removal from landfill leachate. The impact of air flow rate, additives, and number of stages was investigated. The project also sought to increase the accuracy of PFAS concentration and surface tension correlations. Results indicate that a gas to liquid flow ratio of 2.5 had a percent removal of 60.3%. This flow was four times larger than last year’s value, which gave a percent removal of 54%. After an economic model was established for scale-up, the cost per gallon for treatment was calculated to be approximately $0.03 / gallon, assuming the operating cost of the plant would be 10% of the total capital cost.
Introduction
It is vital to improve PFAS (perfluoroalkyl and polyfluoroalkyl substances)
removal techniques because they will contaminate wastewater and cause health concerns, including increased risk of cancer, decreased response to
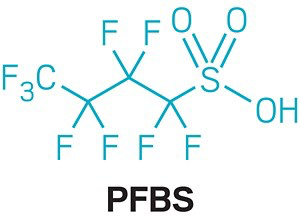
vaccines, and numerous types of birth defects (CDC, 2022). PFAS are present in items such as raincoats, electronics, food containers, cookware, beauty products, and cleaning products. These items accumulate in landfills, contaminating the leachate that is then sent to a water treatment plant, but these plants are not designed to remove PFAS. In March, the EPA released a proposal for enforceable drinking water standards that would limit PFOS and PFOA to 4 parts per trillion each, and a combined limit on PFBS, PFHxS, GenX (HFPO-DA), and PFNA. As the regulation is approved, water utilities will start investing millions of dollars each year to comply.
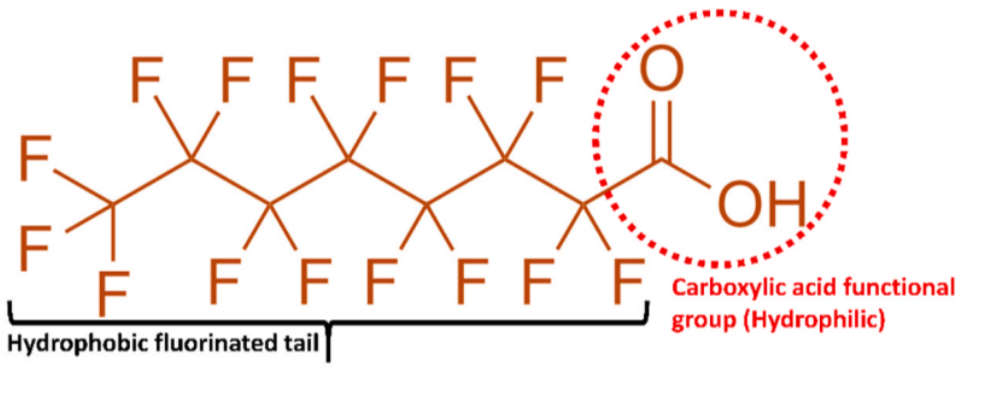
The carbon-fluorine bond in PFAS molecules is the strongest covalent bond, making PFAS very chemically and thermally stable and therefore difficult to remove. These molecules have varying chain lengths. Hydrophobic and electrostatic interactions are the basis for most removal techniques. Longer chains exhibit greater hydrophobicity due to their longer fluorinated tail, giving them increased adsorption rates (Gagliano, 2020). While previous removal techniques have proven to be successful, they are not economically viable for scale-up. Thus, foam fractionation was selected, with key variables including additives, air flow rate, and number of stages. Additives are chemicals that can be incorporated to improve foaming and PFAS separation. Two electrolytic additives are calcium chloride and sodium nitrate. Inorganic salts strengthen foam by limiting bubble coalescence and reducing the drainage of liquid films. Thus, the amount of PFAS returning to the bulk solution after foam collapse would be reduced. Another additive is hydroxypropyl methylcellulose (HPMC), which has been shown to increase PFAS removal by promoting better foam formation due to its high surface activity.
Maximizing the surface area of the bubbles is key for PFAS removal. In this project, the surface tension and PFAS content correlation must be improved to increase the confidence of in-house PFAS measurements. An economic model for the scale-up of the process will also be developed in parallel. Hypotheses include: (1) the accuracy of the correlation can be improved by incorporating a wider range of data into the fit; (2) the PFAS concentration in leachate will decrease with additives, increased air flow, and additional treatments. The ultimate goal is increasing PFAS removal while minimizing foam volume.
Methods
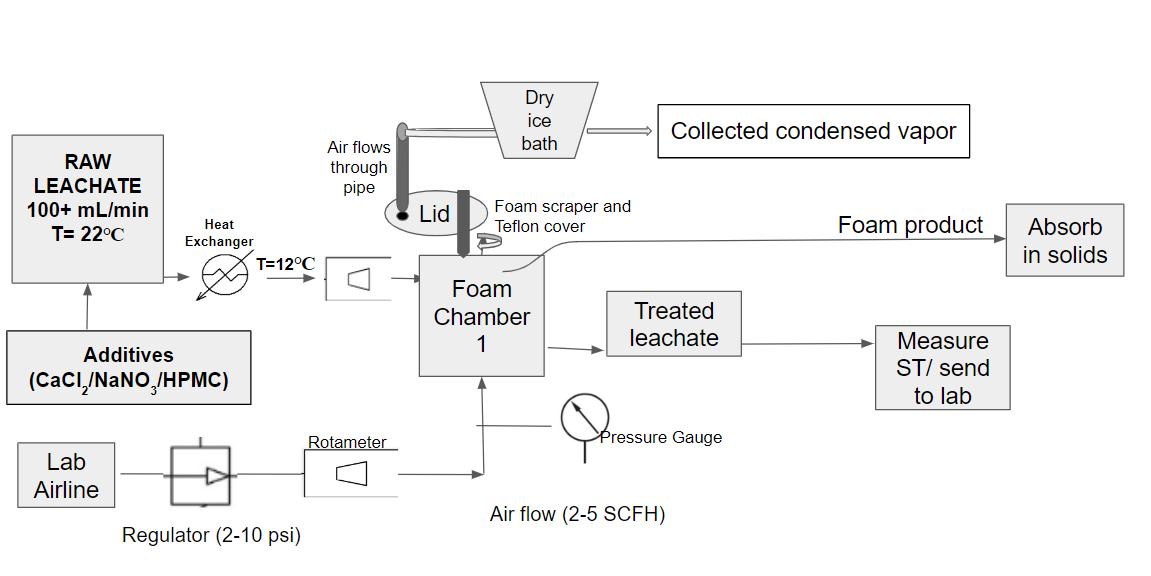
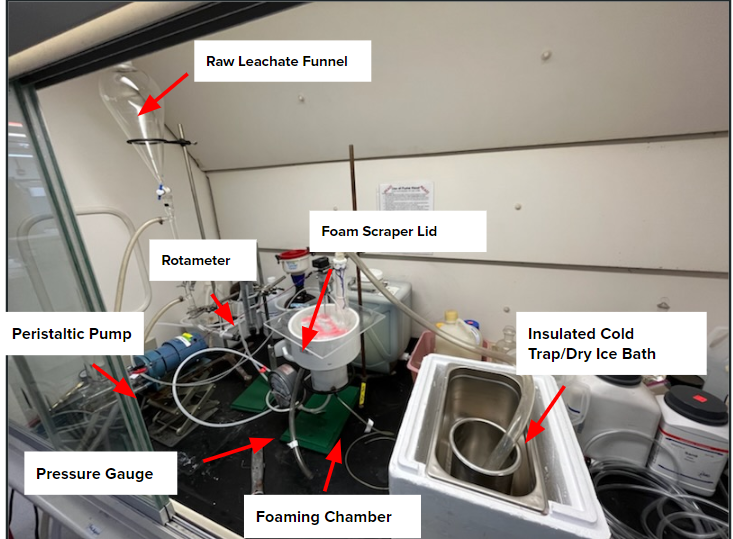
The foam fractionation setup operates by pumping raw leachate and air into the chamber to induce foaming via an air stone. Two exit streams leave the system, one for the PFAS-rich-foam and one for the treated leachate. Leachate is pumped from a separatory funnel through a cooling tube at 55 °F into the system, with some leachate already present in the
foaming chamber. As the foam is generated, it falls or is scraped over the top into the collection basin leading to an outlet tube. The treated leachate flows out a tube at the bottom of the chamber. A pressure gauge and rotameter aid in monitoring the air flow rates and pressure drop. A rotating foam scraper also hangs into the chamber to assist with foam collection. A plexiglass lid resting on top the chamber isolates vapor collection, as it contains a tube that leads to an insulated cold trap of dry ice and acetone. This cold trap will condense any gas to evaluate any PFAS content. The final prototype process-flow diagram can be observed below:
Correlation Results
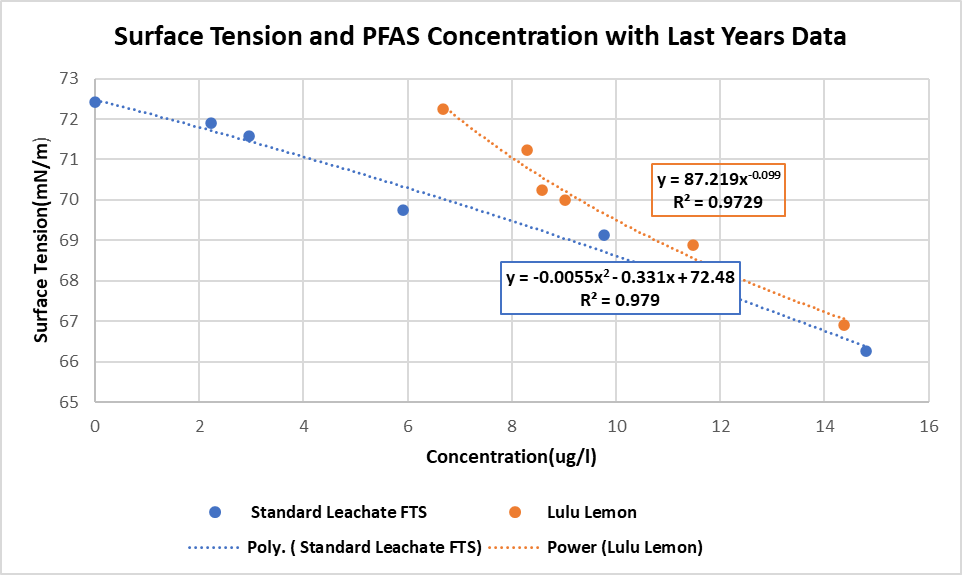
Figure 5 compares the current work of Team FTS with last years team with the same project. Whereas Team FTS diluted leachate and measured the surface tension, Team Lulu Lemon created their correlation only after trials were performed and outside analytical data was returned.
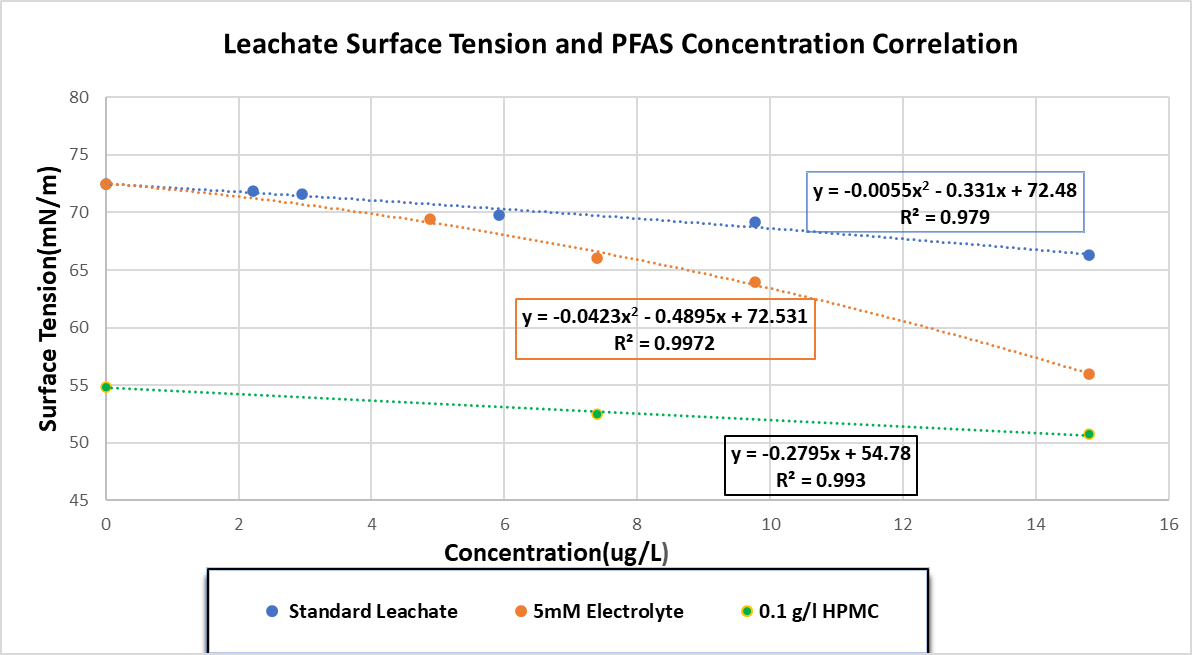
In the case of dilutions with electrolytes: NaNO3 and CaCl2, and HPMC, surface tension decreases. Depending on which additives are present in a foaming trial, the matching correlation will be used to estimate percent removal of PFAS.
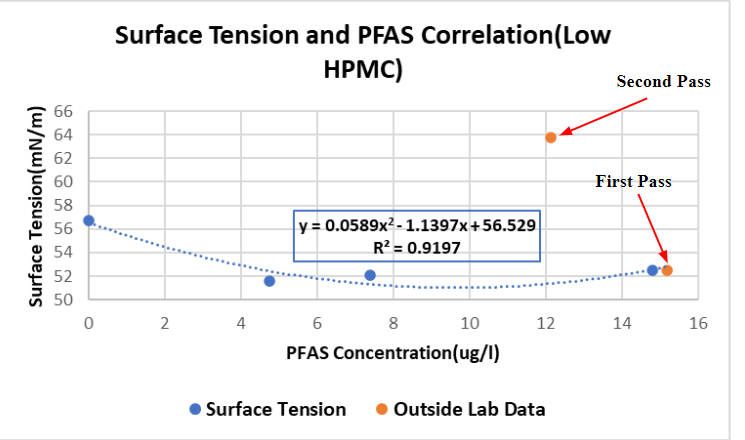
In the trials where a leachate concentration of 0.05 g/L of HPMC was used and two passes were performed, the surface tension noticeably increases from the first to the second. This can be attributed to most HPMC, which initially caused the low surface tension, going into the foam as opposed to the treated leachate
PFAS Removal Results
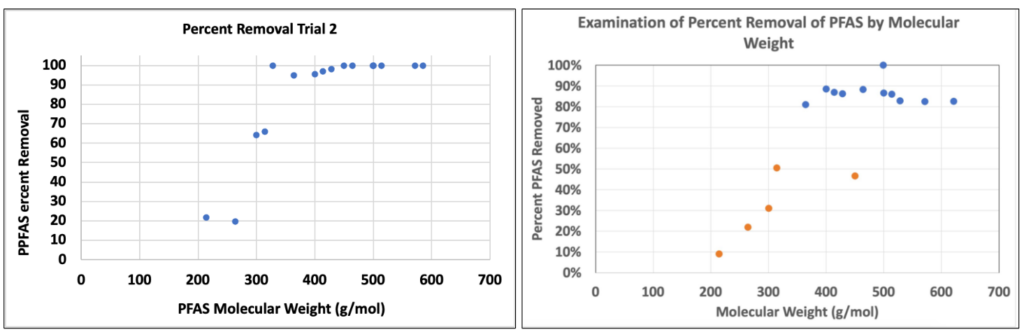
Figure 8: Percent Removal versus Molecular Weight of PFAS (Team FTS and Team Lulu Lemon)
Overall percent removals: 60.3% and 54.0%, respectively.
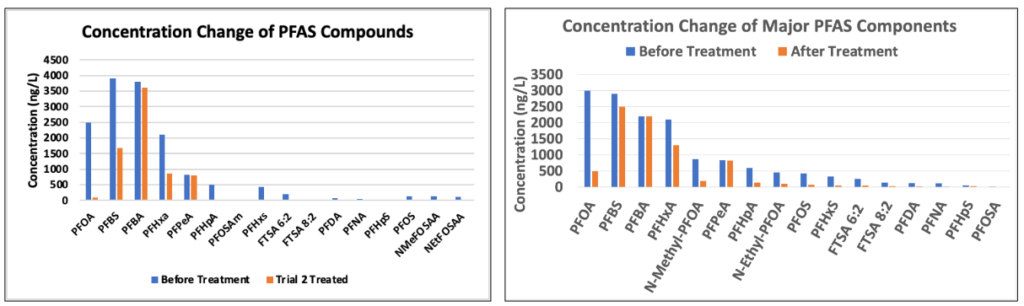
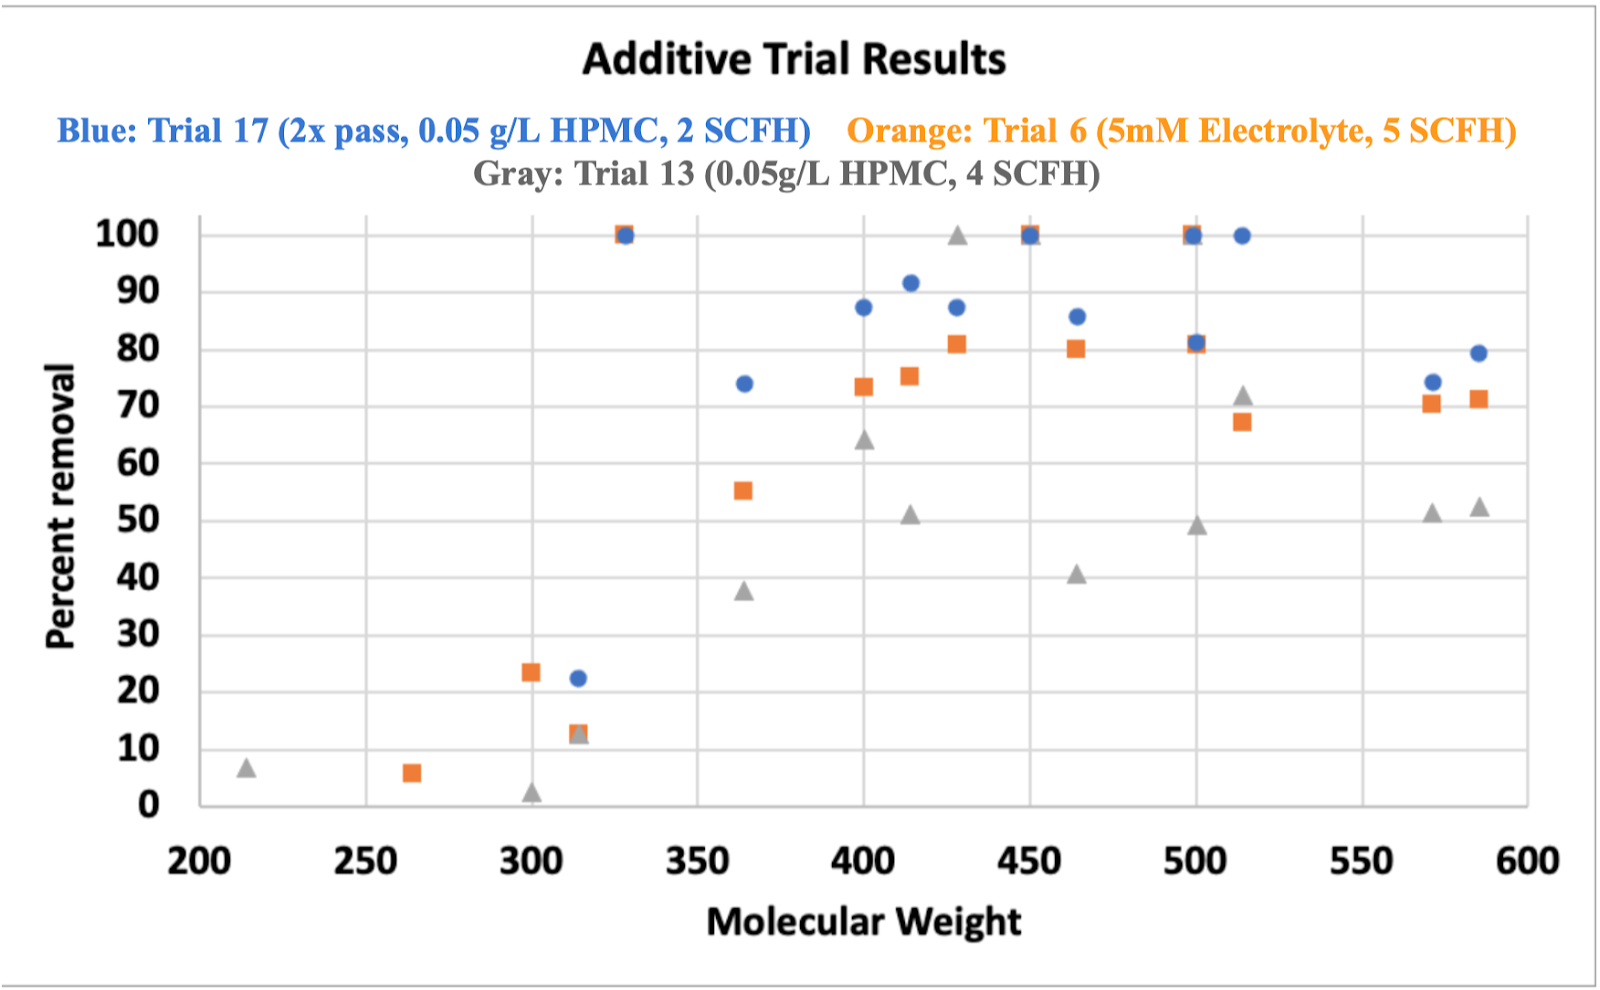
These percent removal results obtained from the lab were lower than the expected values from the surface tension correlations. The results of the trials with additives indicate evidence of contamination, as certain PFAS compounds had a higher mass in the treated samples than in the raw samples. Some potential causes for these discrepancies in the percent removal results include contamination due to residue in the foam fractionation system and uncertainty in volume measurements. It is still evident that a second pass through the system significantly increased the percent removal.
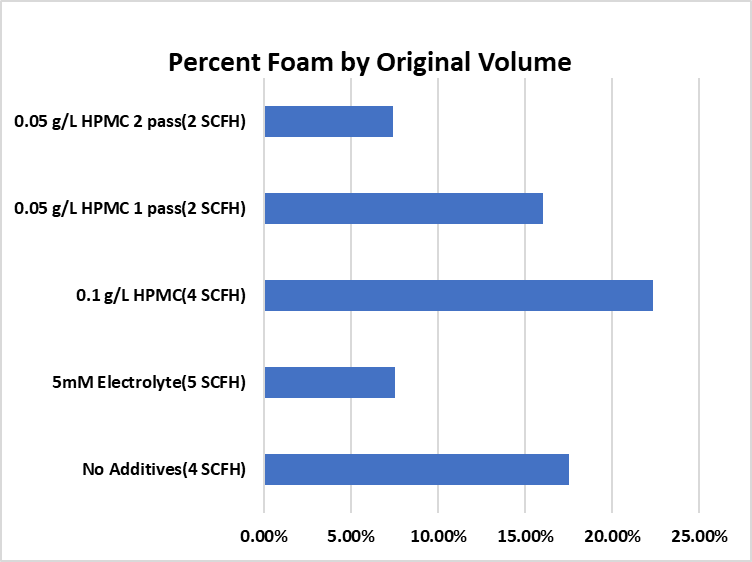
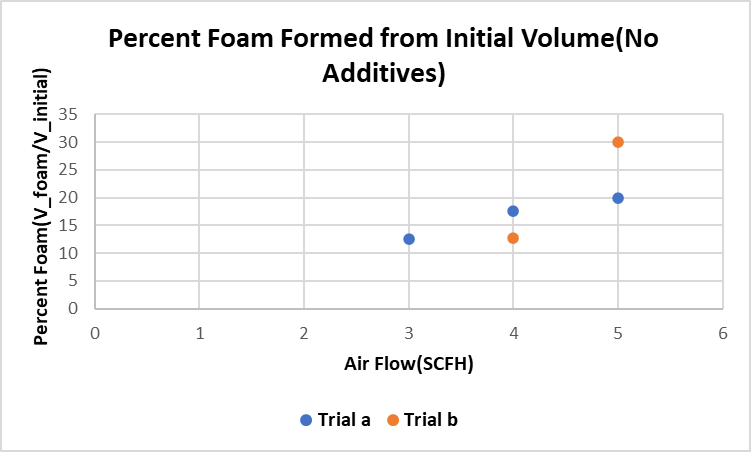
The fraction of foam volume compared to initial volume increases with greater flow rates as well as in the case of an increased concentration of HPMC, a strong surfactant and thickening agent.
Economic Model
Economic Model Calculation Parameters(D. Burns, 2023):
- Estimated capital cost
- Purchase cost
- Annual interest
- Lifespan of operation
- Annual flow rate
- Operation cost
- Disposal cost
- Cost of additives
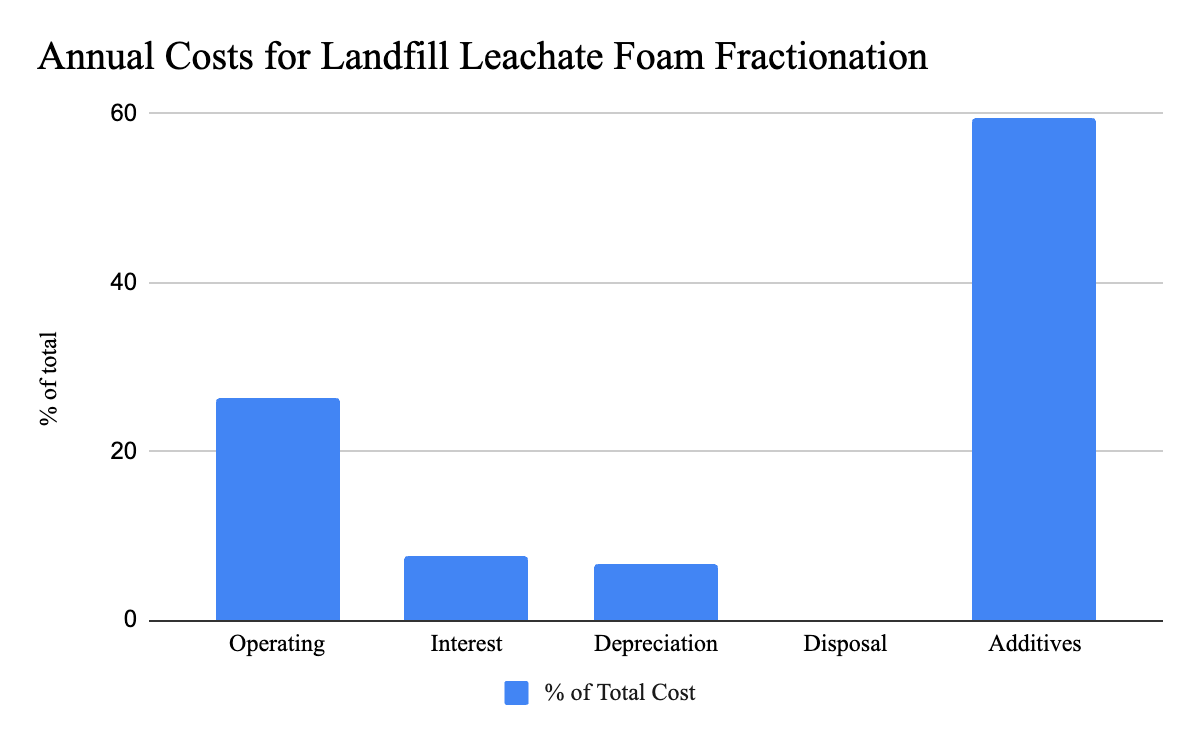
Costs of Treatment:
If operating cost = 20% of capital cost:
cost of treatment = $0.04 / gallon
If operating cost = 10% of capital cost:
cost of treatment = $0.03 / gallon
Key Learnings and Conclusions
- Percent removal increases with molecular weight; PFBA remains most difficult to remove
- Higher airflow (4 SCFH) increased percent removal in short/mid chain PFAS compounds
- HPMC increases foaming capacity significantly (more than the electrolytes)
- Based on ST correlations, ST can be used as a control parameter to optimize the system
Recommendations for Future Work
- Explore different additives
- Optimize HPMC and electrolyte concentrations
- Other foam removal methods and scraper configurations
- Explore different air stones
- Determine calibration and cleaning method for air stones
- Pressure gauge with a greater range
- More stable air flow regulator
- Take more care with consistency of volume measurements and contamination prevention
Acknowledgements
Special thank you to the Senior Design Advisors in the Chemical Engineering Department: Melodie Lawton, Douglas Kelley, Mark Juba, Mason Garlatti, Clair Cunningham, Jeff Leffler; TAs Faraan Hamad and Levi Sunday-Lefkowitz; Brian McGrath and Erin Ryan at Barton and Loguidice; Nicole Simonetti and David Cross at Waste Management; and finally David Burns from EPOC in Australia for providing numeric estimates and economic advice for the scale-up.
References
- Yadau, S., Singh, L., Al-Juboori, R., Ibrar, I., Altaee, A., Subbiah, S., Samal, A., Karbassiyazdi, E., Kazwini, T., & Ganbat, N. (2022). Updated Review on Emerging Technologies for PFAS Contaminated Water Treatment. Chemical Engineering Research And Design, 667–700. https://doi.org/I82
- Hogue, C. (2021). US EPA revises controversial PFBS assessment. Cen.acs.org. Retrieved January 29, 2023, from https://cen.acs.org/environment/persistent-pollutants/US-EPA-revises-controversial-PFBS/99/web/2021/04
- Centers for Disease Control and Prevention. (2022, November 1). Potential health effects of PFAS Chemicals. Centers for Disease
Control and Prevention. Retrieved January 27, 2023, from https://www.atsdr.cdc.gov/pfas/health-effects/index.html - Erica Gagliano, Massimiliano Sgroi, Pietro P. Falciglia, Federico G.A. Vagliasindi, Paolo Roccaro. (2020). Removal of poly- and
perfluoroalkyl substances (PFAS) from water by adsorption: Role of PFAS chain length, effect of organic matter and challenges
in adsorbent regeneration. Water Research. Volume 171, 115381, ISSN 0043-1354,